Abstract
This paper describes ground-penetrating radar (GPR) surveys that were conducted to characterize the ice and shallow subsurface of a frozen lagoon at Bowness Park, Calgary. We used Sensors and Software Inc.’s 250 MHz NOGGIN and Smart Cart system as well as a Pulse EKKO 4 system with 100 MHz antenna. 3D GPR surveys were acquired over the frozen lagoon in two consecutive years (2003 and 2004). Hyperbolic velocity analysis gave ice velocities of about 0.15 m/ns with velocities decreasing in the sediments to about 0.11 m/ns. We interpret the ice thickness to be about 0.4 m from the GPR profiles, which is consistent with augur holes drilled through the ice. Channel sediments and stratigraphy beneath the ice are interpretable from the 3D radar reflectivity. Penetration of the 250 MHz data reached about 2 m at several locations in the area.
Introduction
Ground penetrating radar (GPR) provides a powerful tool for mapping the thickness of ice - as ice is largely transparent to radio-wave signals and the underlying ice-sediment or icewater interfaces can be quite reflective. To investigate ice thickness and its underlying sediments, we acquired two 3D GPR surveys on a frozen lagoon at Bowness Park in Calgary (Figure 1). Bowness Park is situated in NW Calgary, on the south side of the Bow River and covers about 30 hectares of land. The ice on the lagoon (a popular skating area) is created by first draining the lagoon and then slowly filling it with water that freezes. Much of the topographic relief in the City of Calgary is a result of Quaternary rivers downcutting through the near-surface Paleocene units. Lithologically and stratigraphically, the area is composed of unconsolidated sediment, mostly tills, glaciolacustrine deposits and alluvium, overlying sandstone and shale (Osborn and Rajewicz, 1998).
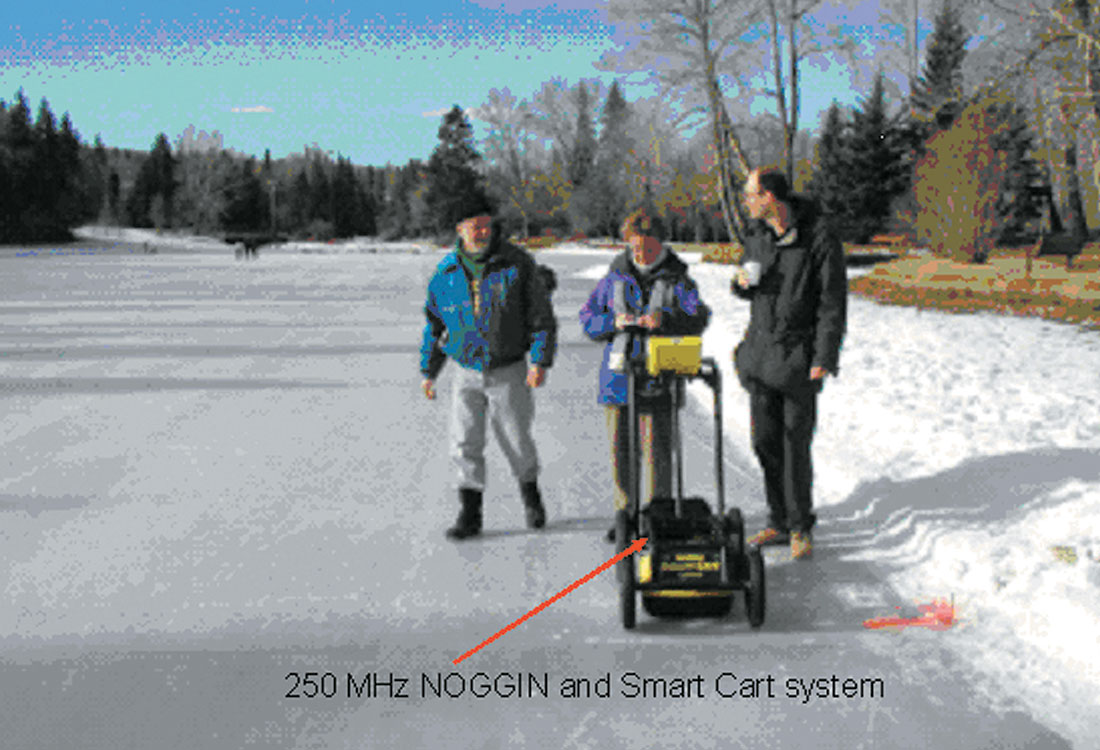
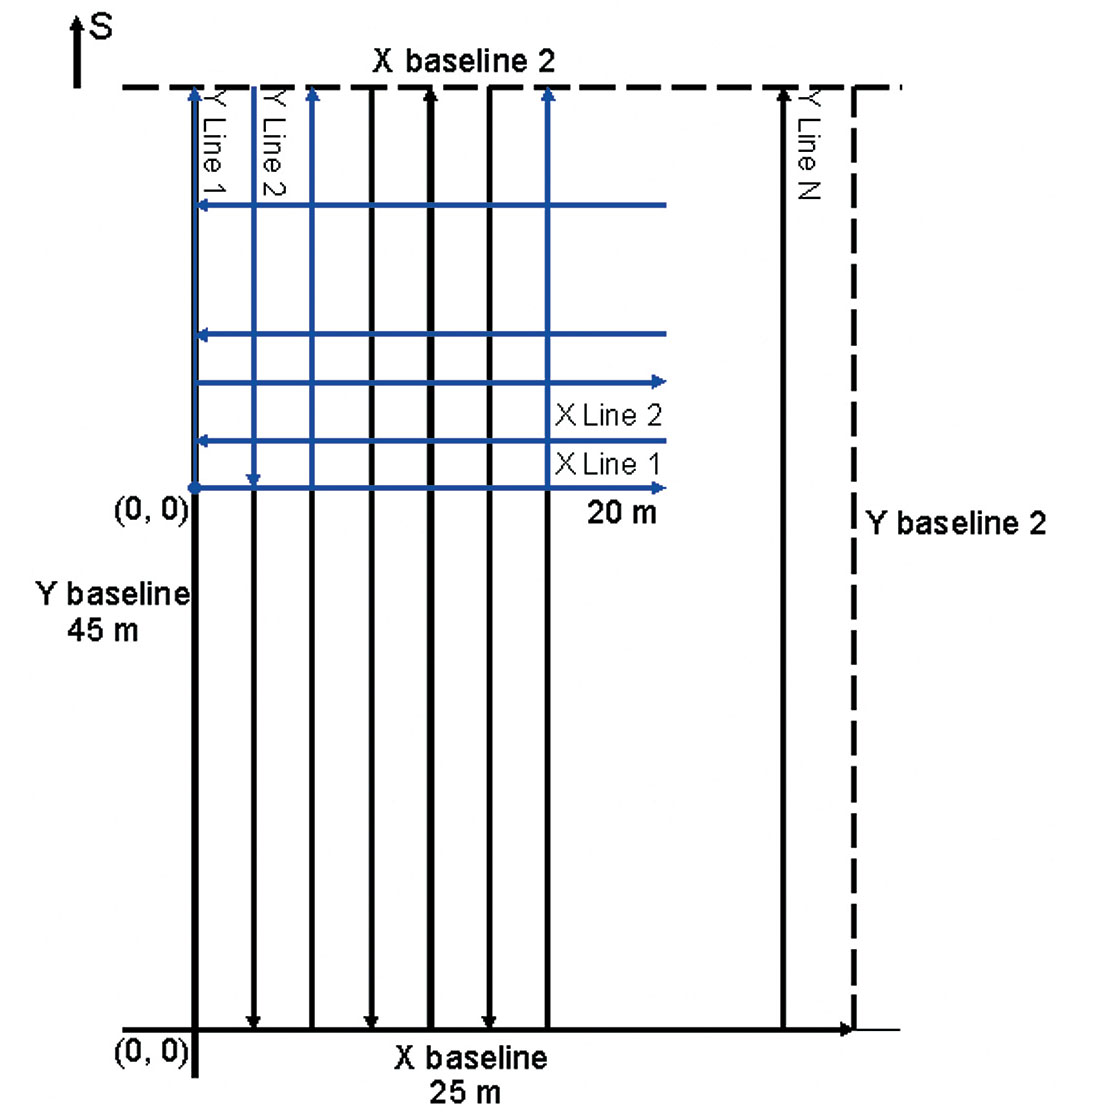
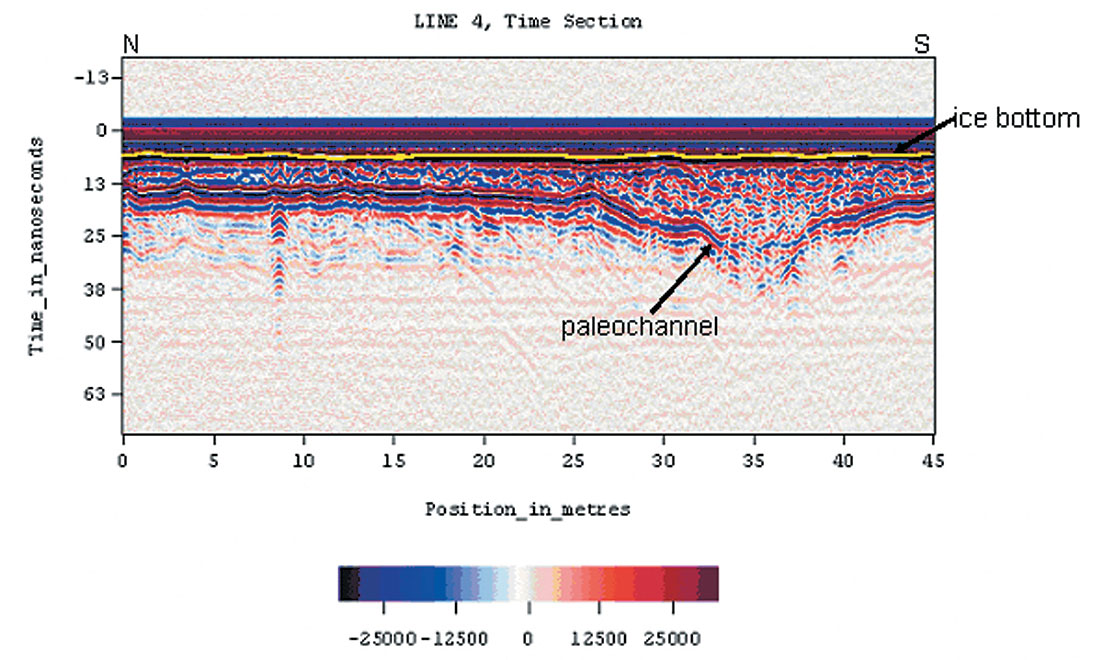
The 2003 3D GPR survey covered an ice surface of 25 m by 45 m (Figure 2) with 26 N-S lines set 1 m apart (one of the investigators actually wore skates to help with the traverses). These lines were acquired in a forward/ reverse manner (every second line was collected in the reverse direction). The data were collected with Sensors and Software Inc.’s NOGGIN 250 MHz system. As indicated, the centre frequency is 250 MHz and the internal antennae separation is 0.28 m. A trace was acquired automatically every 0.10 m as controlled by a counter on the SmartCart wheel. To process the data, we used Win EKKO and EKKO Mapper software from Sensors & Software Inc. Planview maps of the near-surface structure at different times and depths were computed to analyze the horizontal distribution of the subsurface features. A single line, from the survey, is shown in Figure 3. The 2004 survey covered a surface of 20 m by 20 m (Figure 2), but with lines in orthogonal directions. In this case, we acquired a total of 42 GPR profiles, 21 lines on the E-W direction (X axis) and 21 lines on the N-S direction (Y axis). The NOGGIN system was again used, but with a trace acquired every 0.05 m.
Data analysis
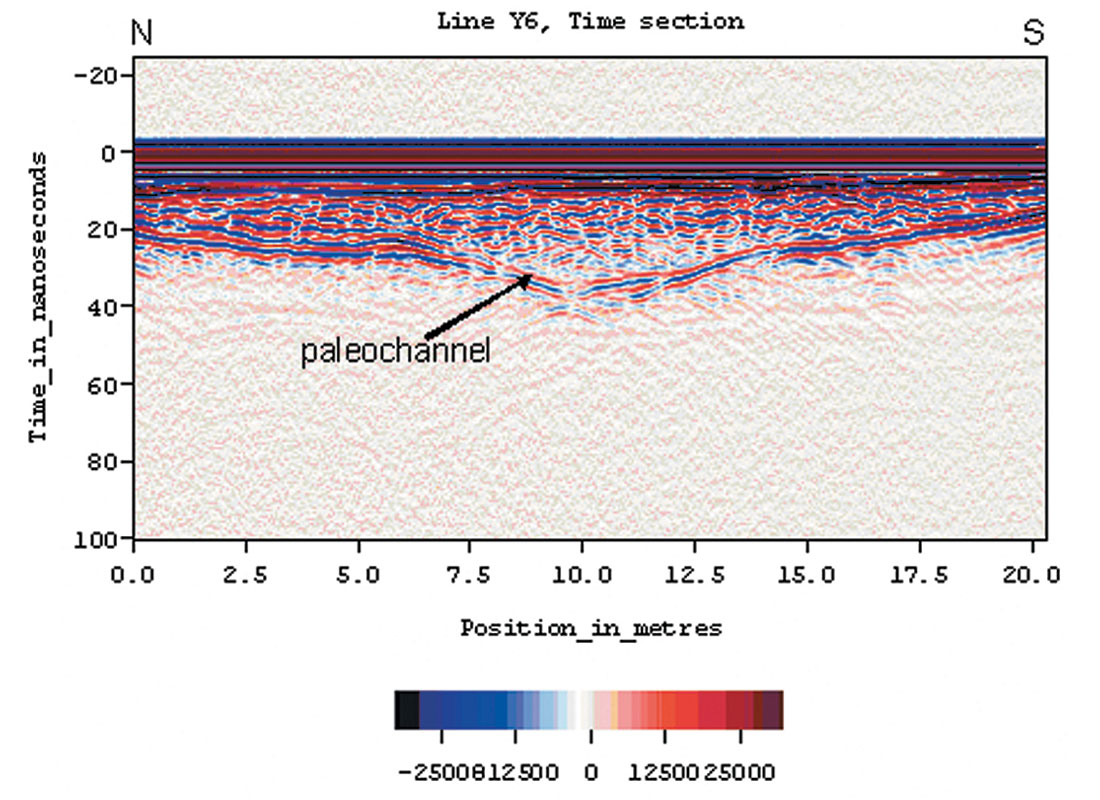
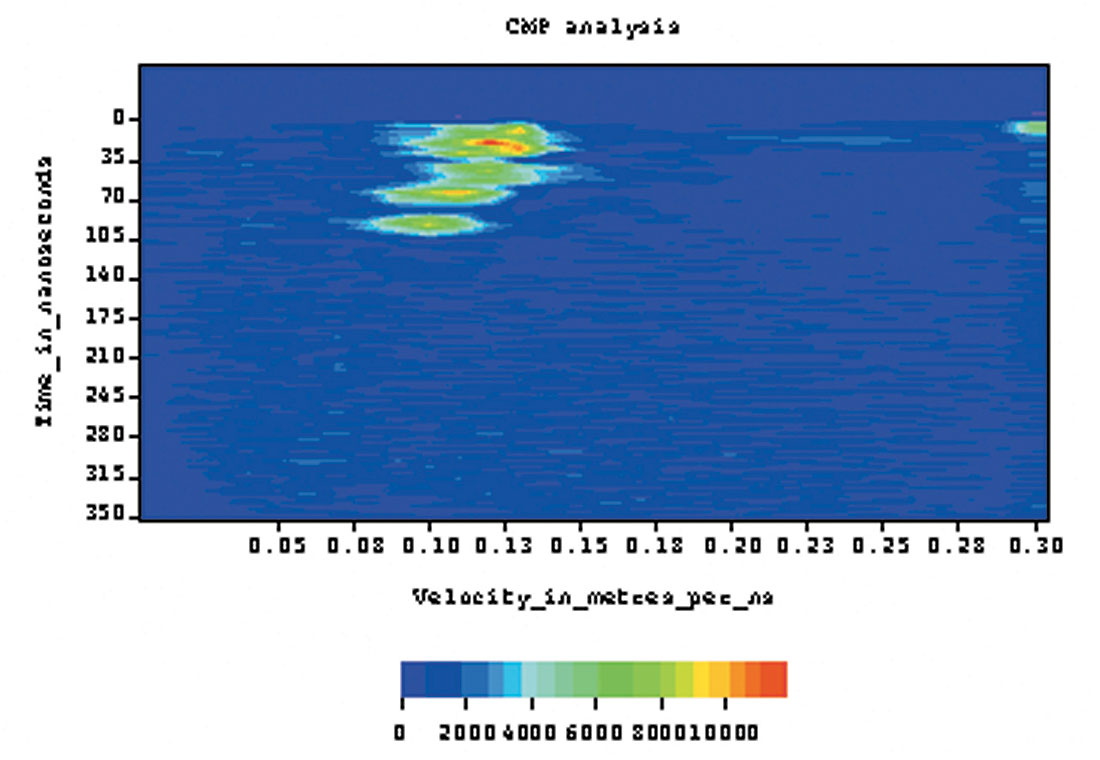
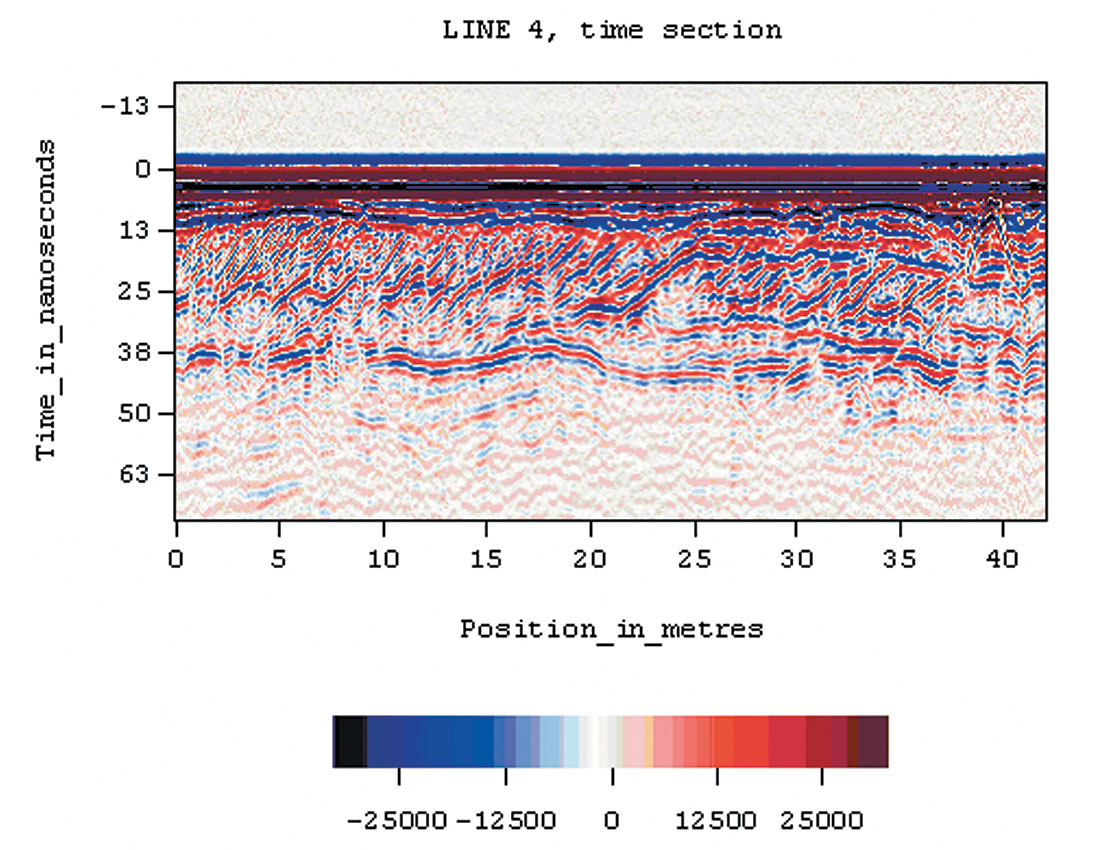
The raw GPR field data acquired were of reasonably good quality on their own. Nonetheless, we used GPR data processing procedures as outlined by various authors (e.g. Young et al., 1995, Fisher et al., 1996, Peretti et al., 1999) to further enhance the signals. These steps included: temporal filtering (“de-wowing”) to remove very low- frequency components, time gain (an automatic gain control) to compensate for the rapid attenuation of the radar signal and to enhance deeper reflectors, and background subtraction to remove the air and ground wave from the time section and enhance shallow reflections. We interpret a reflection from the bottom of the ice and also reflections from the sediments beneath the ice (Figure 3). The channel area of the lagoon was re-surveyed in 2004 to provide a more detailed look at the channel (Figure 4). In addition, we also acquired a CMP gather using the PulseEKKO system with source and receiver antennae at different offsets, for the purpose of performing velocity analysis. This CMP gather, acquired on frozen ground near the lagoon, gave velocities from 0.13 m/ns in the very near surface to 0.11 m/ns at several meters depth (Figure 5).
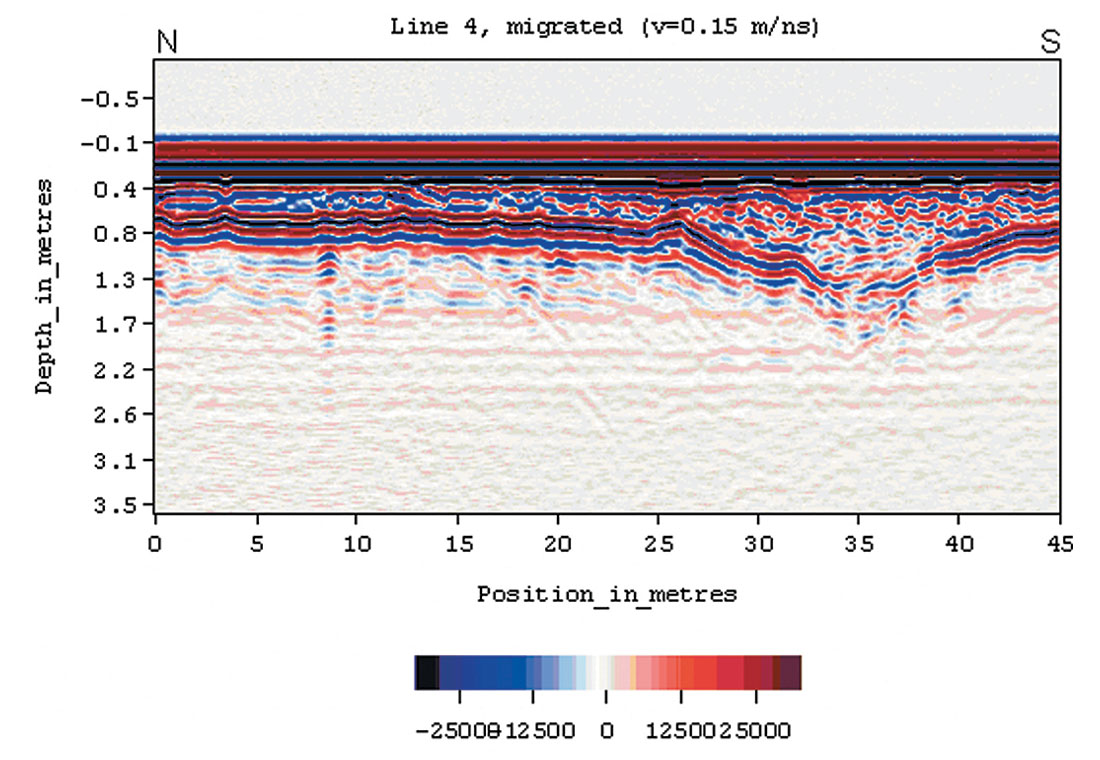
The velocity value for ice, determined during acquisition by fitting a hyperbola to diffracting objects in the ice or just below it, was 0.15 m/ns. Migrating the data with this velocity (Figure 6) provided a good image (i.e. the diffractions were collapsed and continuity increased). We also used this velocity to map the section to depth and interpret the event at 0.42 meters to be the ice bottom. Holes augured through the ice gave a thickness of about 0.4 m. The maximum depth of penetration of the reflected GPR signals is about 2 m, based on a velocity of 0.11 m/ns and 40 ns two-way travel time.
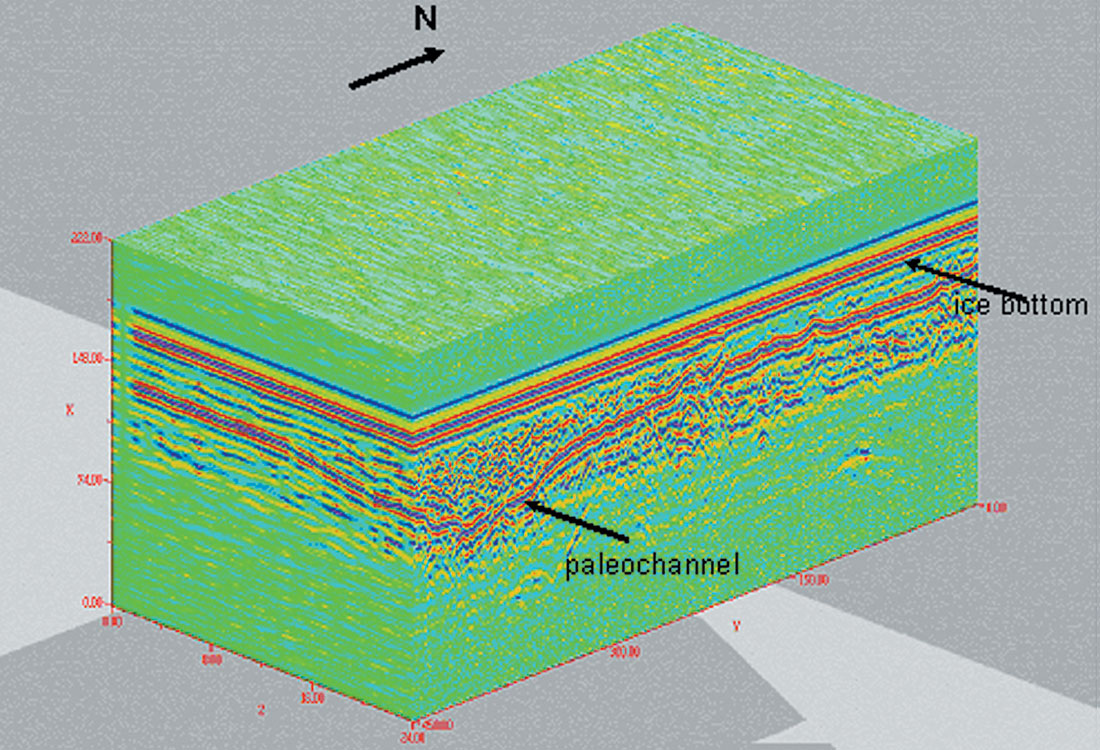
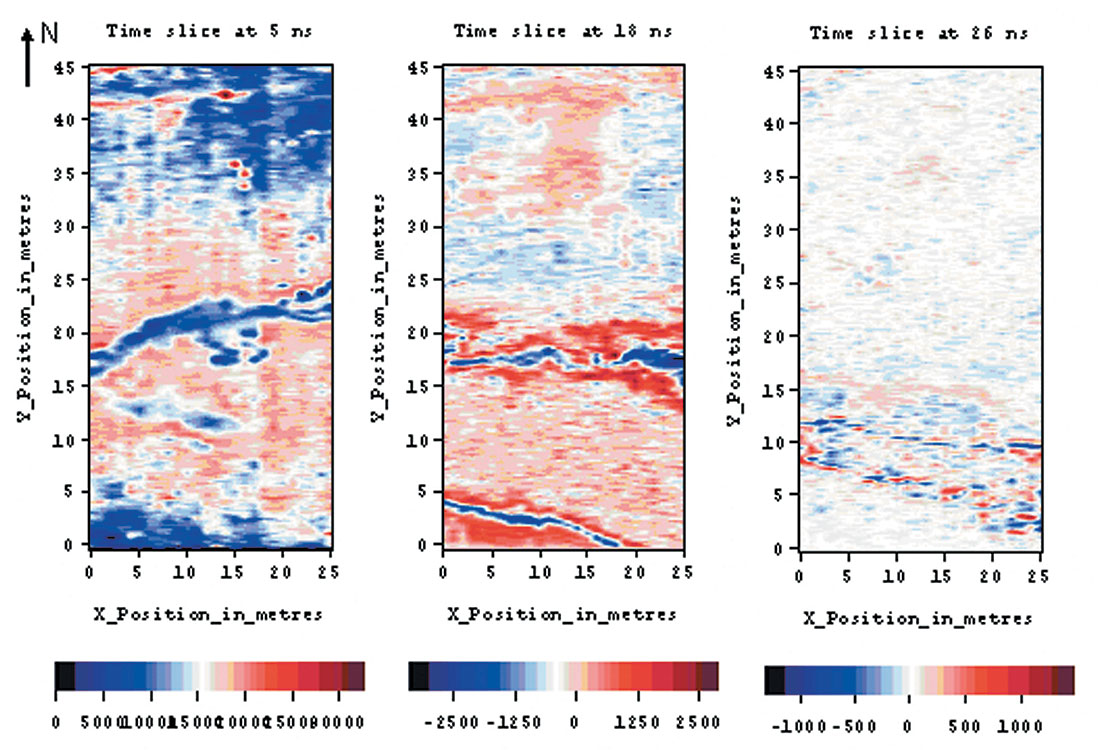
A3D volume was next assembled using Sensors & Software’s 3D analysis package (Figure 7). Areas of low-amplitude reflectivity may indicate more uniform materials or soils, while those of high amplitude denote areas of larger subsurface contrast such as significant stratigraphic changes (Conyers and Goodman, 1997). From three time slices (at 5 ns, 18 ns, and 26 ns two-way travel time), we can determine some subsurface structures. In particular, we can see detail at the bottom of the ice layer as well as the shape and orientation of the channel (Figure 8).
Dipping structures that are an indication of sediment deposition in a fluvial environment are also evident on lines acquired over frozen land several hundred meters north of the lagoon (Figure 9). The cross-bedding in the sediments was likely laid down in moving water and is similar to river environment profiles illustrated by Jol (1993).
Conclusions
The GPR investigation over a frozen lagoon in Bowness Park, Calgary was useful in determining the thickness of the ice (about 0.4 m as confirmed by auguring) and imaging fluvial structures beneath the ice. Velocity of the radar waves through ice was determined to be approximately 0.15 m/ns and the maximum depth from which we have information was approximately 2 m (using the deepest coherent reflections and a velocity of 0.11m/ ns).

Acknowledgements
We would like to acknowledge Dr. Larry Bentley and Ms. Julie Aitken of the University of Calgary and Mr. Greg Johnston of Sensors & Software Inc. for their assistance in the 2003 survey. We would also like to thank Mrs. Malcolm Bertram and Eric Gallant for their assistance in both 2003 and 2004 surveys. We appreciate the help of Mr. John Szureck of City of Calgary Parks and Recreation.


Join the Conversation
Interested in starting, or contributing to a conversation about an article or issue of the RECORDER? Join our CSEG LinkedIn Group.
Share This Article