Summary
The effect of wave induced fluid motion between fractures and pores results in complex elastic stiffness coefficients that ultimately gives rise to frequency-dependent attenuation. Therefore, permeability estimates are obtainable through a spectral analysis of the seismic wavefield. In this study, we analyze the attenuation response associated with a time-lapse seismic survey acquired before and after hydraulic fracturing to investigate the permeability within the stimulated zone. The results obtained from the attenuation analysis were in qualitative agreement with microseismic observations and 4D seismic amplitude and traveltime anomalies, suggesting that a permeable fault diverted the energy from the hydraulic fracture treatment to re-stimulate a specific portion of the reservoir.
Introduction
An integrated study to predict and characterize well performance in the Horn River gas shales was conducted by Goodway et al. (2012) through application of advanced quantitative interpretation methods for reservoir characterization. The study detailed the workflow from which “sweet spots” were identified through geomechanical and rock property estimation from 3D seismic. Furthermore, the microseismicity associated with the hydraulic fracture treatment and time-lapse (4D) seismic were used to evaluate the extent of the stimulated reservoir volume (SRV), which provides a tool to confirm and calibrate the predictions of the seismic reservoir characterization study.
In this paper, we provide a more detailed description of the 4D analysis performed to evaluate the permeability of the stimulated zone. We begin with an overview of the squirt flow phenomenon in fractured porous media and the corresponding frequency dependent attenuation response. Subsequently, we present the interpretation of the induced microseismicity and 4D seismic anomalies to determine the SRV and the 4D attenuation analysis for permeability estimates to corroborate information acquired from the various sources.
Squirt flow in mesoscale fractures
Wave-induced fluid flow between open fractures in a poro-elastic background was discussed by Brajanovski et al. (2005). In their description of the phenomenon, mesoscale fractures were considered, where mesoscale means small compared to the seismic wavelength but much larger than the size of individual grains and pores. For the present study, the assumption of mesoscale fractures is reasonable because the hydraulically induced fractures are not directly resolvable seismically and the grain and pore sizes in shales are much smaller. For the case of liquid-filled fractures that are not hydraulically isolated, the application of a stress induces fluid flow between fractures and pores, resulting in an excess fracture compliance that alters the effective elastic properties of the medium. In addition, the mechanism responsible for fluid transport can be regarded as a diffusion process. Therefore, the passage of a seismic disturbance consisting of various driving frequencies results in fluid flow characteristics and hence effective elastic properties that varies with frequency. This frequency dependence of the elastic parameters ultimately results in velocity dispersion and attenuation of the seismic energy, which can be used to provide an indication for the ability of fluids to flow or the permeability within the medium.
The dynamic-equivalent saturated P-wave modulus for the system as discussed is given by (Brajanovski et al., 2005)
where
and

where the quantity, Ω, is known as the normalized frequency, K, Kg and Kf are the bulk modulus of the dry matrix, solid grain and fluid respectively, μ is the shear modulus, α is the Biot-Willis coefficient, ϕ is porosity, ω is the frequency, Η is the fracture spatial period, ΔN is the normal fracture weakness (Schoenberg and Sayers, 1995), κ is the permeability and η is the dynamic viscosity. The effect of fluid motion between fractures and pores gives rise to complex elastic stiffness coefficients that result in a frequency dependent response. The corresponding attenuation is given by

where Q is the quality factor. Figure 1 shows the attenuation as presented by Brajanovski et al. (2005) for a constant normal fracture weakness of 0.2 and different background porosity values. The wave-induced fluid flow between fractures and pores exhibits an attenuation response that is characteristic of a relaxation phenomenon (Brajanovski et al., 2005) where the attenuation peaks at some frequency and falls off thereafter.
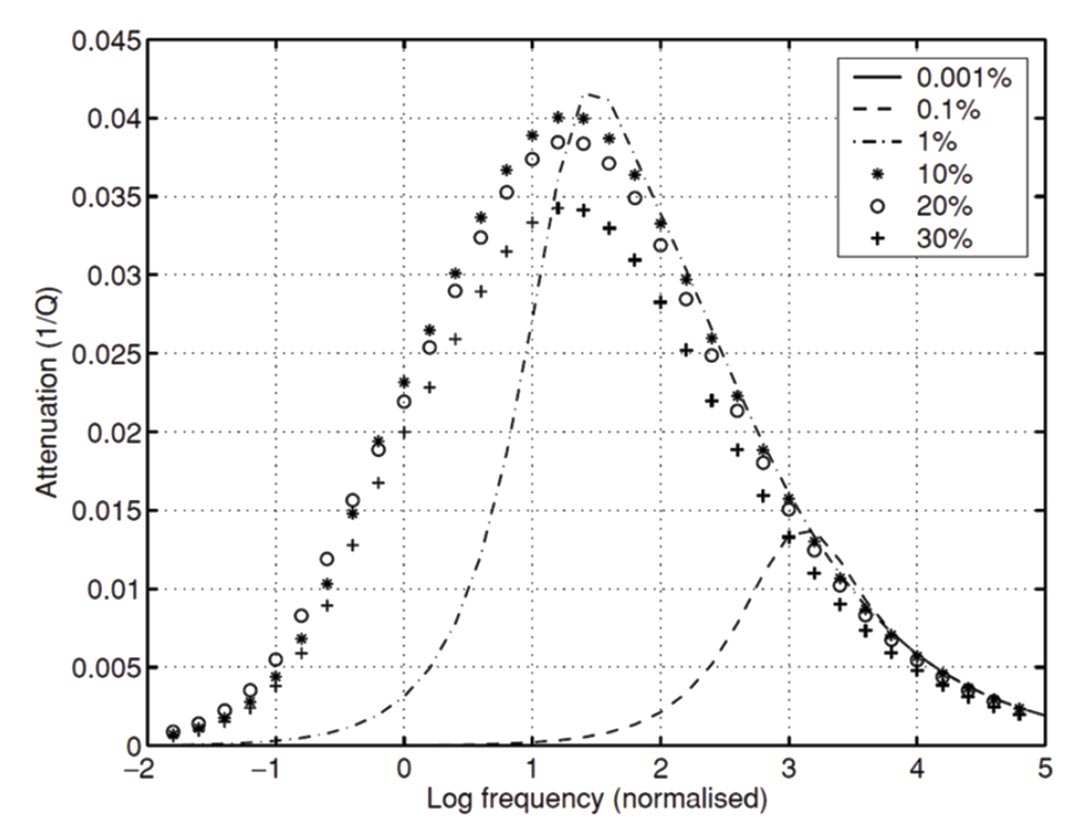
The P-wave modulus given by equation 1 represents the response for an applied stress normal to the fracture plane, and is therefore only applicable for plane waves propagating along the fracture normal. However, due to the source-receiver offsets in the data acquisition, plane-wave components should exist that are normal to the fracture plane for various fracture geometries. Therefore, we expect a finite attenuation response despite the non-ideal experimental setup. In addition, for a quantitative description of the attenuation response, we require knowledge of parameters such as the fracture dimensions and a fluid mobility parameter, which are unknown at present. Therefore, we are restricted to a qualitative analysis to evaluate the attenuation response and hence the estimation of permeability in the stimulated zone.
Microseismic and 4D Seismic Analysis
The induced microseismicity as a result of the hydraulic fracture treatment was recorded to determine the extent of the SRV. Figure 2 shows the microseismic event locations overlaid on a curvature attribute map illustrating the location of a fault cutting through the well pad. For the completion of stages located near the fault, a lack of microseismic events was observed in the immediate vicinity as outlined in yellow. However, microseismic events appeared at the toe of the wells suggesting a deflection of energy that re-stimulates the NW end of the pad.
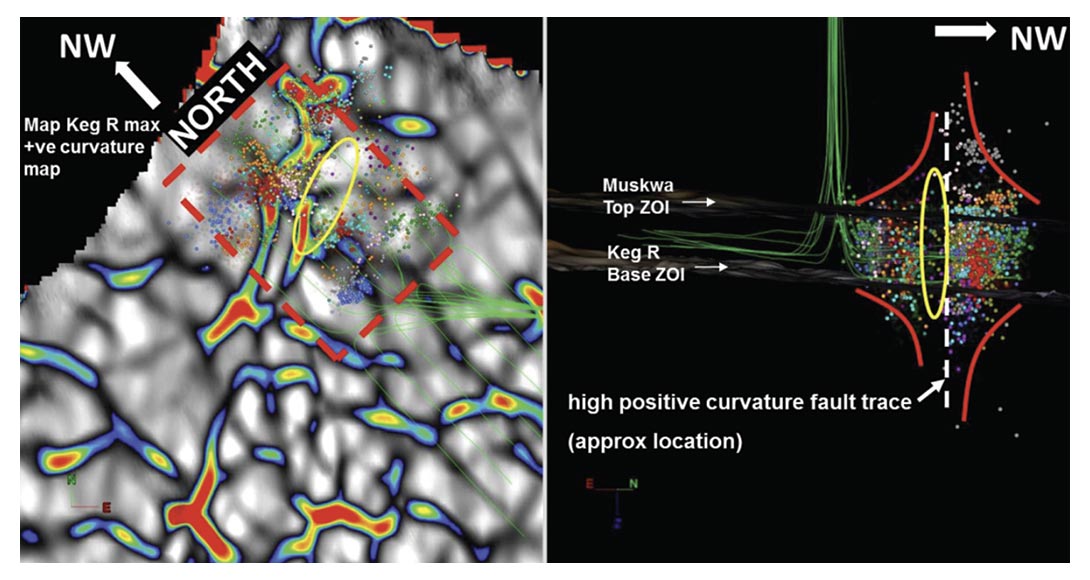
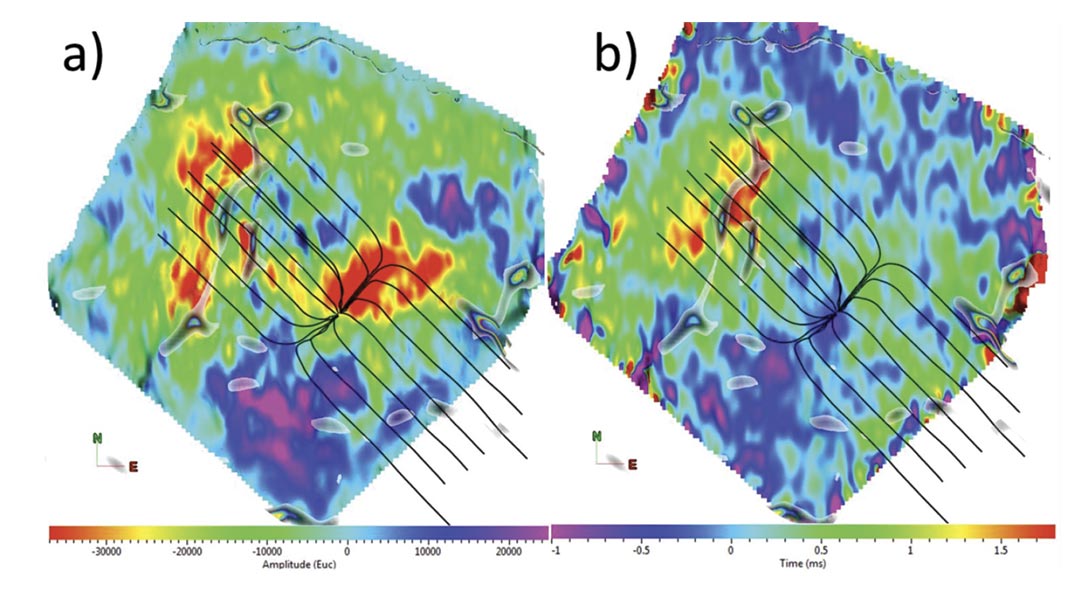
Figure 3 shows the 4D amplitude and traveltime anomalies for the stimulated interval. The two properties demonstrate a consistent 4D anomaly at the toe of the wells where the apparent re-stimulation created a significantly damaged zone that was detectable seismically. In addition, the anomalies appear to be bounded by the curvature event and in conjunction with the microseismic observations, suggest that fluid was transported through the fault but resulted in little change in the fault zone.
4D Attenuation Analysis
To provide an indication for relative permeability in the stimulated zone, we perform a spectral analysis to investigate the presence of attenuation effects as discussed above. The monitor survey for the 4D analysis was acquired during the completions program where the frac fluid has not yet been recovered. As the original state of the reservoir was completely gas saturated, even existing fractures that are permeable will not produce the attenuation effects due to the motion of a liquid phase between fractures and pores. Therefore, the baseline survey provides a reference to detect any attenuation effects in the monitor survey.
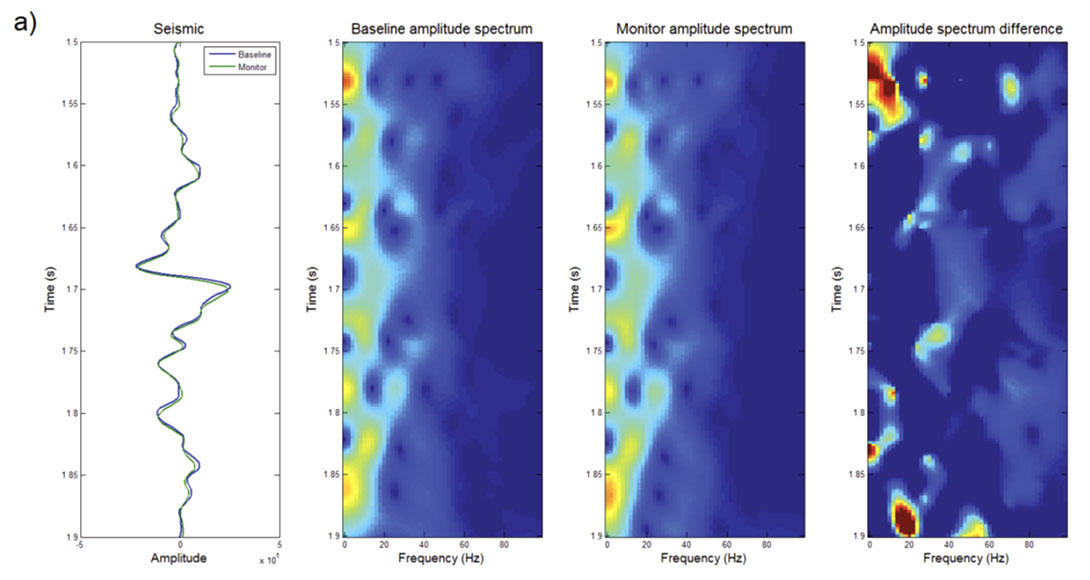
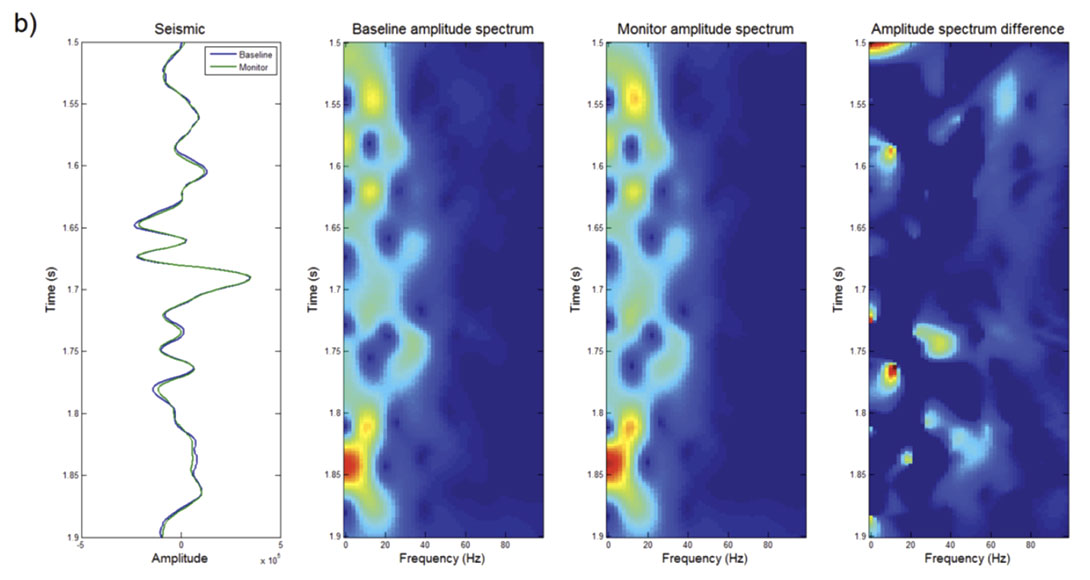
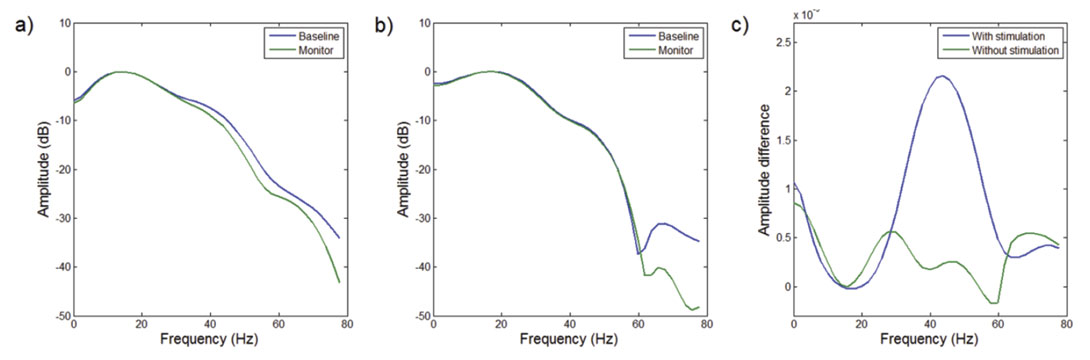
Figure 4 shows time-variant amplitude spectra and their difference for a single trace extracted from the baseline and monitor surveys in an area with and without stimulation, where the reservoir interval is approximately between 1.6 and 1.7 seconds. In the area without stimulation, a minimal amplitude difference is observed throughout the reservoir interval. Conversely, in the area with stimulation, a finite amplitude difference is observed that extends throughout the reservoir interval and is isolated to a specific frequency band. Figure 5 shows a slice through the time-variant spectra in the reservoir interval where these effects are more clearly seen. The difference amplitude spectrum demonstrates a decrease in amplitude that peaks at some frequency and falls off thereafter.
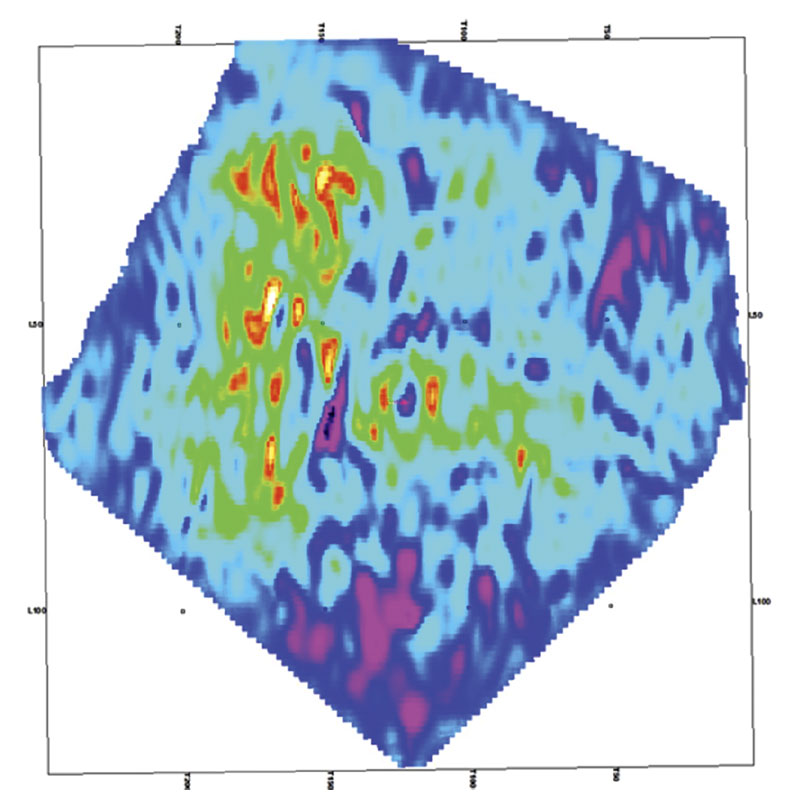
To illustrate the areal extent of the attenuation response, a spectral decomposition was performed for the 4D volumes windowed around the reservoir interval. Figure 6 shows the difference in the 35 Hz spectral component between the baseline and monitor surveys, where the hot colors represent areas of increased attenuation and hence, fluid mobility within the stimulated zone. The attenuation response is consistent with the amplitude and traveltime anomalies which are concentrated near the toe of the wells. However, the spectral-difference map also exhibits an attenuation trend that tracks the curvature event outlining the location of the fault. As suggested by the microseismic observations and seismic amplitude and traveltime anomalies, energy is deflected towards the toe of the wells through the fault. The attenuation response therefore, is consistent with the interpretation of a permeable fault, which served as a conduit for the transport of fluid to restimulate the NW end of the well pad.
Conclusions
Estimates of permeability in hydraulically induced fractures were performed through spectral analysis of a time-lapse seismic survey. Estimates are based on theoretical predictions that the effect of fluid mobility results in a frequency dependent attenuation response. Comparison of time-variant amplitude spectra for baseline and monitor surveys shows a bandlimited spectral anomaly consistent with theoretical expectations. The attenuation analysis is consistent with microseismic observations and 4D seismic amplitude and traveltime anomalies, suggesting that fluid was transported through the fault, diverting energy from the hydraulic fracture treatment to re-stimulate the NW end of the well pad.

Acknowledgements
The authors would like to thank the management of Apache for permission to publish this work. The support provided by the sponsors of the CREWES project is also acknowledged.
Related Reading


Join the Conversation
Interested in starting, or contributing to a conversation about an article or issue of the RECORDER? Join our CSEG LinkedIn Group.
Share This Article