Abstract
Two bright amplitude seismic anomalies, on drilling, tested normal grade oil. However, the association of oil with bright amplitudes in the area, where such seismic signatures are known to be habitually associated with gas, was intriguing and provoked a study of seismic rock physics for the two oil sands.
Well data comprising dipole sonic and density logs and seismic 3D data were analyzed to understand the phenomenon of bright amplitudes associated with oil. The analysis, besides exemplifying some basic tenets of rock physics, also leads to a few interesting inferences. The most significant inference is that the bright amplitude anomalies are unlikely to have been caused by oil saturation.
Introduction
Two high amplitude seismic anomalies stacked one above the other, on drilling, resulted in discovery of normal grade oil of 38° API in two sands. The Pliocene reservoirs are located offshore, India, in a depth range of 2200-2450 m. The petrophysical parameters for the two oil sands are quite similar, except for their thicknesses and oil saturation, and are seen as bright amplitude anomalies in 3D seismic.
Classical ‘bright spots’ are commonly identified with gas sands though a few associated with oil saturated sands are also reported in literature (Clark,. A, 1992; Whang and Lellis, 1988). While the phenomenon of “bright spot” anomaly due to compressibility of free gas in a reservoir is well understood, the premise of normal grade oil sands causing such anomalies, presumably due to similar compressibility of dissolved gas in oil, may be contentious. Several experimental studies have demonstrated (Gregory, 1977; Wang, 2001 that dissolved gas in water has marginal or no effect on seismic response and extending it logically, one can expect similarly little effect due to dissolved gas in oil. Could there be, then, other unidentified reasons for the bright spots, thus far speciously thought to be linked to only oil saturation?
Two interesting motives encouraged the investigation of the present case study. First, high amplitude anomalies are seen for the first time associated with oil in an area where similar anomalies have so far led to discovery of only gas sands. Second, with a recorded dipole sonic it offers a rare opportunity to analyze and better understand the seismic rock physics related to a reservoir partially saturated with normal grade oil.
Full wave sonic, petrophysical and 3D seismic data were analyzed. VSP data was used for well calibration besides providing the obligatory check on the reliability of sonic velocity. Lack of petrographical data, however, was a constraint as inferred rock properties, such as rock textures and pore shapes, could not be validated.
Seismic Rock Physics in brief
Seismic rock physics is an integrated study of seismic response to changes in rock-fluid properties. Seismic response of a rock is mostly expressed by two seminal properties, the amplitude and the velocity which is determined by elasticity and density of the rock. In addition to the elastic properties, pore shape, and texture – especially anisotropic texture such as bedding or fractures can influence seismic. Additionally in-situ parameters such as temperature, pressure, and viscosity can also be important. Furthermore, a rock consists of three elements, the matrix, the pore space and the pore fluid, and a change in property of any of the rock constituents will influence the overall seismic response. The effects due to individual changes are often interrelated and their interaction can alter the ensuing resultant seismic response profoundly. Some of the effects may be individually too small to be perceived by seismic but a few of them when happen to add up, can create a change discernible in seismic. Predictably, the seismic responses can vary widely depending on the geology of the area which controls the rockfluid properties.
Analysis of Rock-fluid Properties
The rock-property analysis is based on the attributes density (ρ), compressional velocity (VP), shear velocity (VS) and the VP/VS format for Poisson’s ratio, measured by the full-wave sonic and density logs recorded in the well. Formations and evaluation parameters of the zones of interest are estimated from the other suite of logs. The good quality caliper log provides confidence on reliability of logged data.
| Depth (m) | Desc. | ρ (g/cm3) | VP (m/s) |
VS (m/s) |
VP/VS ratio |
Water saturation |
|---|---|---|---|---|---|---|
| 2225-2237 | Shale | 2.4 | 2565 | 1185 | 2.2 | - |
| 2237-2247 | Oil sand | 2.2 | 2360 | 1335 | 1.8 | Sw=54% |
| 2247-2265 | Marginal Oil | 2.35 | 2685 | 1365 | 2.0 | Sw=70% |
| 2265-2272 | Shale | 2.4 | 2475 | 1150 | 2.2 | - |
| 2272-2298 | Shaly Sand | 2.4+ | 2660 | 1340 | 2.0 | Sw=85% |
| 2298-2305 | Shale | 2.4 | 2570 | 1200 | 2.2 | - |
| Table 1: Upper Zone (2225-2305 m): median Values | ||||||
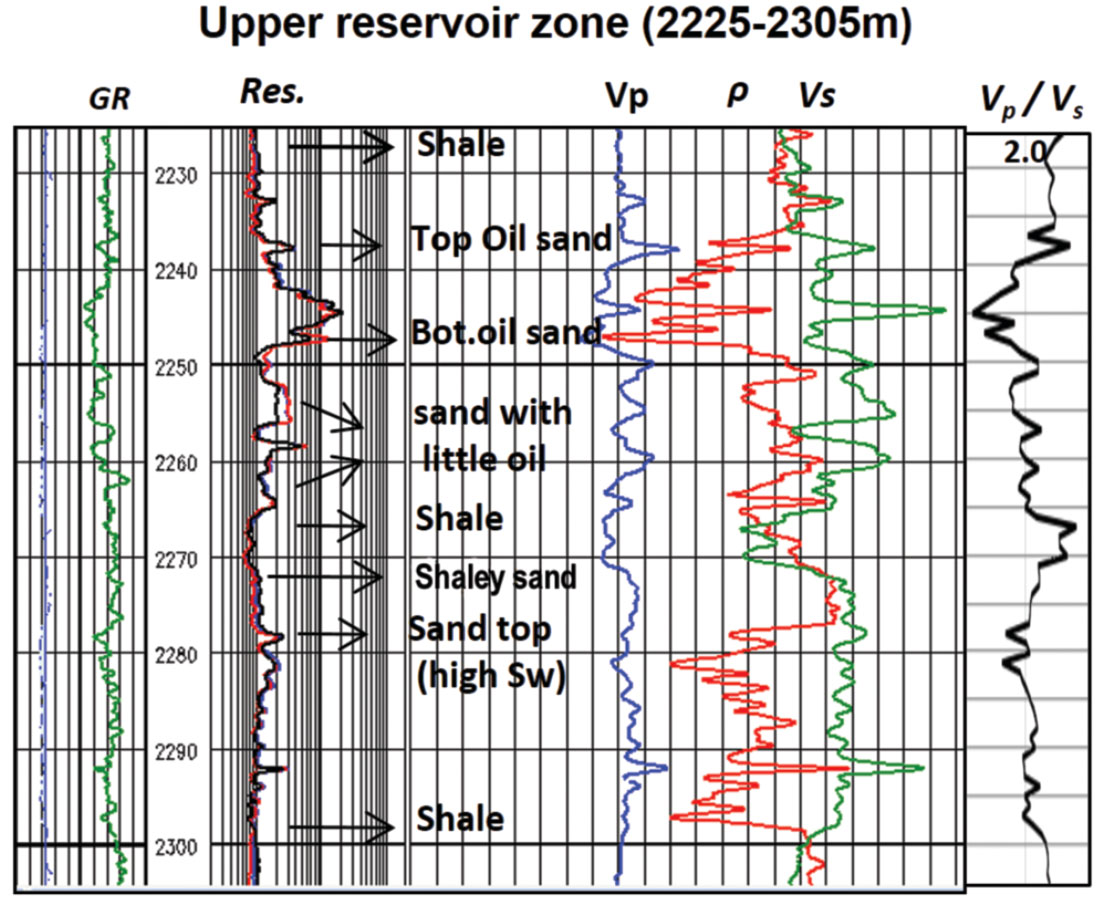
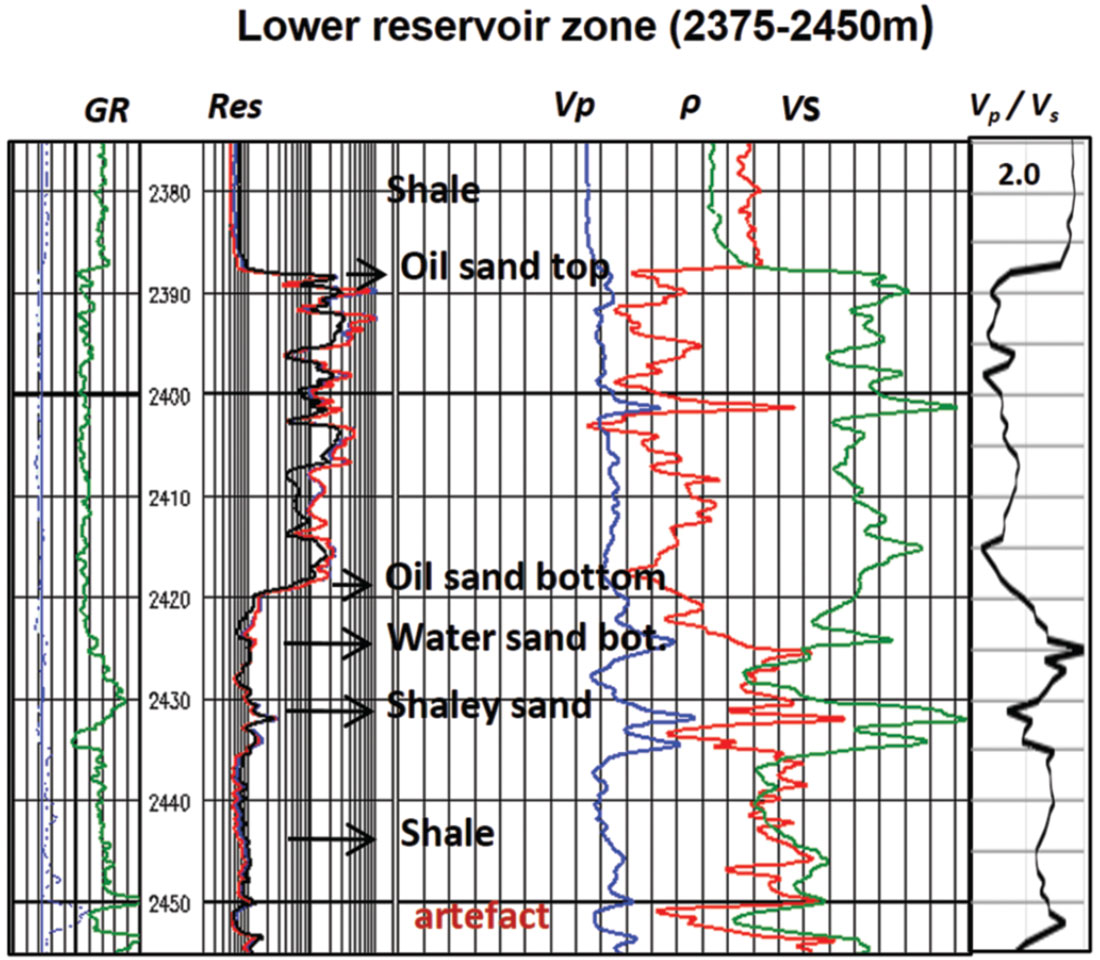
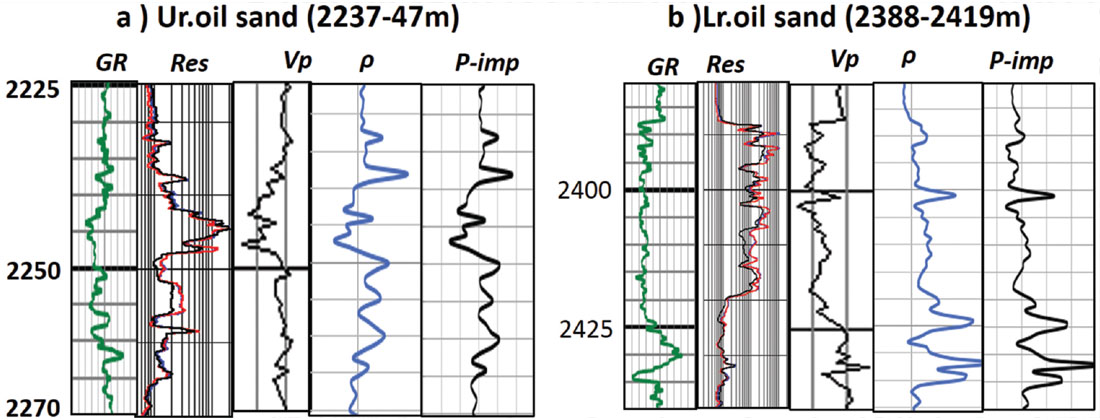
The analysis of properties is limited to two principal zones of interest in the well, the upper reservoir (2225-2305 m) and the lower reservoir (2375-2450 m) (Figure 1 and 2). Based on the conspicuous changes in character of the sonic and density (ρ) logs, each zone is subdivided into 1) upper shale unit, 2) oil/marginal oil sand reservoirs, 3) shaly sands/water sands and 4) lower shale unit. Since the velocity and density values within these units, even after editing the transients, are seen to vary over a wide range, ostensibly due to heterogeneity in rock facies, evaluation is done by considering the median values of the ranges. These values are shown in Table 1 and 2. Deviations in values of ρ, VP, VS and VP/VS ratio of litho units, with respect to those of the overlying one, are also indicated.
| Depth (m) | Desc. | ρ (g/cm3) | VP (m/s) |
VS (m/s) |
VP/VS ratio |
Water saturation |
|---|---|---|---|---|---|---|
| 2375-2388 | Shale | 2.4 | 2435 | 1005 | 2.4 | - |
| 2388-2419 | Oil sand | 2.2 | 2625 | 1480 | 1.8 | 25% |
| 2419-2425 | Water sand | 2.3 | 2830 | 1410 | 2.1 | 100% |
| 2425-2435 | Shaley sand | 2.35 | 2890 | 1365 | 2.1 | 100% |
| 2435-2450 | shale | 2.4 | 2690 | 1290 | 2.2 | - |
| Table 2: Lower Zone (2375-2450 m): median Values | ||||||
Upper Reservoir Zone (2225-2305 m):
(Figure 1 and Table 1)
1) Upper Shale unit (2225-2237m)
The shale unit, capping the oil sand is characterized by an average high ρ = 2.4g/cm3, VP = 2565 m/s, VS = 1185 m/s and a high VP/VS ratio = 2.2.
2a) Oil sand (2237-2247m):
(lower ρ, lower VP, higher VS and lower VP/VS with respect to overlying shale)
The oil sand having porosity, (φ) = 23%, Vcl = 22% and water saturation (SW) = 54% shows average values ρ = 2.2 g/ cm3, VP = 2360 m/s, VS = 1335 m/s and VP/VS ratio = 1.8.The striking drop in density of sand from that of shale above by nearly 0.2 units indicates high porosity. Compared to shale, the median value of VP (= 2360 m/s) shows an appreciable reduction while the VS (= 1335m/s) shows a considerable increase in value, resulting in VP/VS ratio of 1.8. The sizable decrease in P-velocity (~200 m/s), however, may be mainly due to pore shape rather than the porosity, and aided considerably by the texture of the sand. The inferences are drawn from the log motifs and are supported by the known depositional history of the reservoir sands in the area. The fining upward sequence in the logs is suggestive of channel sands which are inferred as fine grained and well sorted with flat pores. However, this could not be validated in the absence of sedimentological data. The increase in VS (by ~150m/s) is due to high shear modulus of the sand and the VS seem poorly sensitive to rock porosity (23%).
2b) Sands with marginal oil (2247-2265 m):
(higher ρ, higher VP, higher VS and higher VP/VS with respect to oil sand)
Two sands separated by a thin shale in the unit are characterized by nearly similar parameters, average ρ = 2.35 g/cm3, φ = 16%, Vcl = 24% and SW = 70%. Compared with oil reservoir, the sands show lower porosity and higher water saturation. The VP = 2685 m/s shows a considerable increase of 325 m/s whereas, VS = 1350 m/s shows only a slight rise of 30 m/s. Considering the small decrease in porosity, the attendent high increase in P-velocities may be largely due to pore shapes and texture of the sands. Larger grain size, poor sorting and spherical pore shapes which increase bulk modulus, seem to typify these sands. The box shaped log motif, in contrast to that of the oil sand, lends support to the inference of the sands being deposited under different environments. It is also likely that higher water saturation may have aided in increasing the VP . Nonetheless, the large increase in VP resulted in higher VP/VS ratio, 1.9 - 2.0. The small increase in VS despite good porosity of the sand, shows S-velocity as a poor porosity indicator.
3a) Shale: (2265-2272):
(higher ρ, lower VP, lower VS and higher VP/VS with respect to marginal sands)
The shale unit is typified by a median value of high density 2.4 g/cm3, lower velocities of VP = 2475 m/s and VS =1150 m/s and by a high VP/VSratio of 2.2. Despite higher depth, the velocity value is a tad lower compared to shallower shale, suggesting a dissimilar type of shale, deposited in a different environment. But the values 2.4 g/cm3 for density and 2.2 for VP/VS distinctly typify the shale in the area.
3b) Shaley Sand: (2272-2298 m):
(higher ρ, higher VP, higher VS and lower VP/VS with respect to shale)
The top of the unit is characterized by a sharp increase in ρ(= 2.45 g/cm3), VP (= 2660 m/s), VS (= 1340 m/s) and VP/VS ratio (= 2.0). While the velocities are slightly less than those of marginal sands, the large jump in density (by 1.0 gm/cc) may be due to presence of some heavy mineral. All values thereafter monotonically decline indicating a shaly sand section. The sand (2278-83m) has a porosity (21%) and water saturation (85%). The VP/VS ratio for the water saturated sand is 2.0, higher than that of the partially saturated oil sand (1.8).
The variance in density in a strange pattern in the interval 2282- 2298m, without attendent velocity changes is inferred due to effect of constituent minerals.
4) Shale: (2298-2305 m):
(higher ρ, lower VP, lower VS and higher VP/VS with respect to shaley shale)
The shale unit has values of density 2.4 g/cm3, VP = 2570 m/s, VS = 1200 m/s and VP/VS ratio = 2.2, figures akin to those of the other shale units in the zone.
Lower reservoir zone: (2375-2450 m): (Figure 2 and Table 2)
1) Shale unit (2375-2388m):
The shale unit is typified by high density of 2.4 g/cm3, VP = 2435 m/s, and VS = 1020 m/s. Compared to the shale at the top of the upper zone, both the velocities are lower, despite greater depth of occurrence and more so for VS, which results in a higher VP/VS ratio of 2.4. This may be an indication of a shale (pelagic clay) deposited under a different, deep water environment.
2a) Oil sand (2388-2419 m):
(lower ρ, higher VP, higher VS and lower VP/VS with respect to shale)
The oil sand, on an average, shows a lower density of 2.2 g/cm3, higher velocities, VP = 2625 m/s, VS = 1480 m/s and a lower value of VP/VS ratio = 1.8. It has porosity, j = 24%, Vcl = 13% and oil saturation = 75%. The rock and seismic parameters are similar to those of upper oil sand (Table-2a) except for the VP and oil saturation, both being higher. The large increase in VP compared to that of upper sand, despite similar porosity is inferred primarily due to texture. The barrel shaped log motif with a flat top is different from motif of the upper oil sand and is inferred as a stack of fan sands with large grains and poorly sorted an inference based on known depositional history of Pliocene reservoir sands in the area. The VP/VS value as 1.8 for both the oil sands, despite dissimilar l oil saturation, indicates that the ratio is a poor indicator of oil saturation.
2b) Water sand (2319-2425 m):
(higher ρ, higher VP, lower VS and higher VP/VS with respect to oil sand)
The water sand, below the oil water contact (2319 m MD) shows increased density=2.3 g/cm3, higher VP = 2830 m/s, lower VS = 1365 m/s and larger VP/VS ratio = 2.1.The reservoir parameters for the water sand are φ = 22%, Vcl = 16% and SW = 100%. As the reservoir parameters are very similar to those of oil sand except for the saturant, differences observed in seismic properties of the sand can be ascribed due to water saturation. Rocks saturated fully with water are known to have higher bulk modulus which explains the rise in VP. Lowering of VS is due to increase in fluid density, resulting in the higher VP/VS value, akin to that of shale.
3) Shaley sand (2425-2435 m):
(higher ρ, higher VP, higher VS and higher VP/VS with respect to water sand)
The shaley sand/sand unit is typified by marginally higher values of density (= 2.35 g/cm3), VP (= 2890 m/s), VS (= 1365 m/s) and VP/VS (= 2.2). A conspicuous decrease in density in the interval (2433-2435m) may due to a streak of porous sands fully saturated with water.
4) Shale (2435-2450 m):
(higher ρ, lower VP, lower VS and lower VP/VS with respect to shaley sand)
The shale section is characterized by increase in density and decrease in velocities with the typical VP/VS ratio of 2.2. The increases in VP (2690 m/s) and VS (1290 m/s) compared to shale at 2225-2237m (2565 m/s and 1185 m/s) signifies compaction effect related to depth.
Seismic response of the oil reservoirs
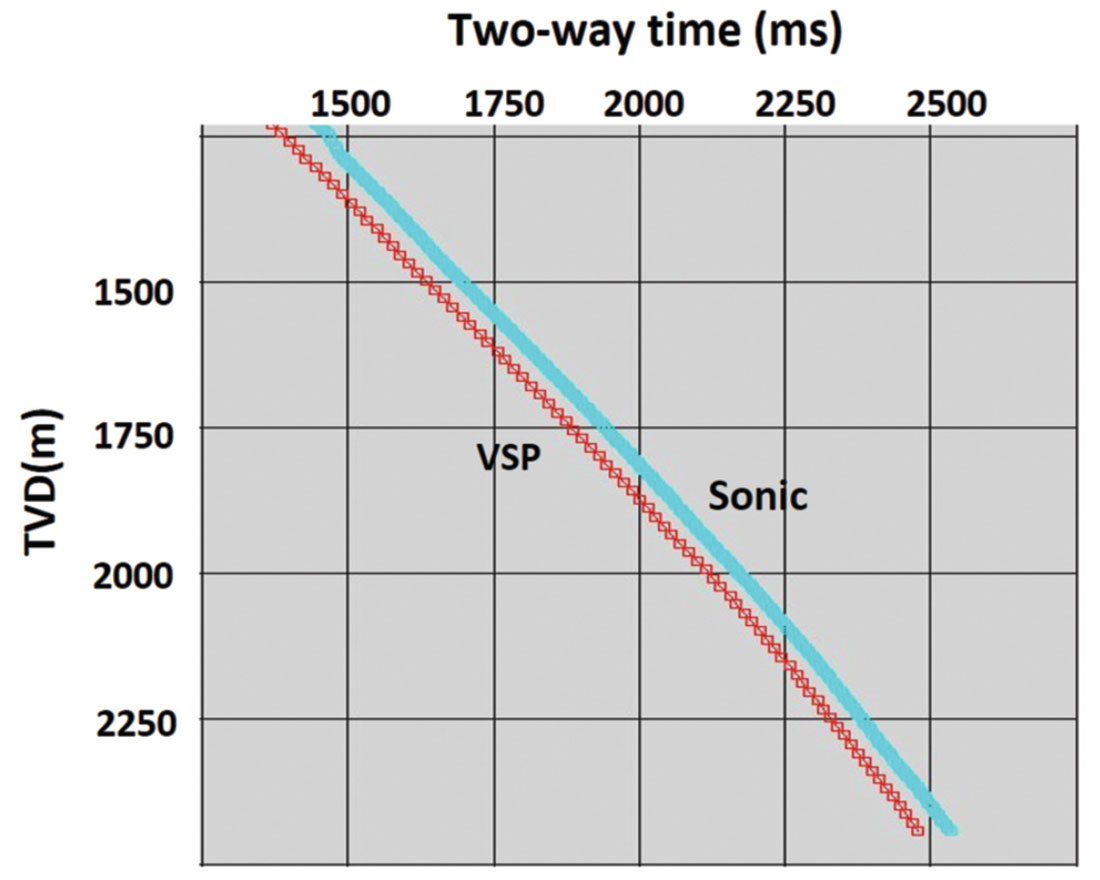
The VSP data was used to compare the well and sonic velocity for a compatibility check. The excellent correspondence of sonic velocity with VSP (Figure 3) signifies the degree of reliability in the linked study of seismic and sonic for rock-fluid properties of the oil reservoirs. The two sands in the upper and the lower zones are found saturated with normal grade oil of API 38°. The reservoir parameters and seismic properties of the oil sands are similar except for oil saturation and the velocities (Table 3a and 3b). Parameters for marginal oil and water sands are also included in the table.
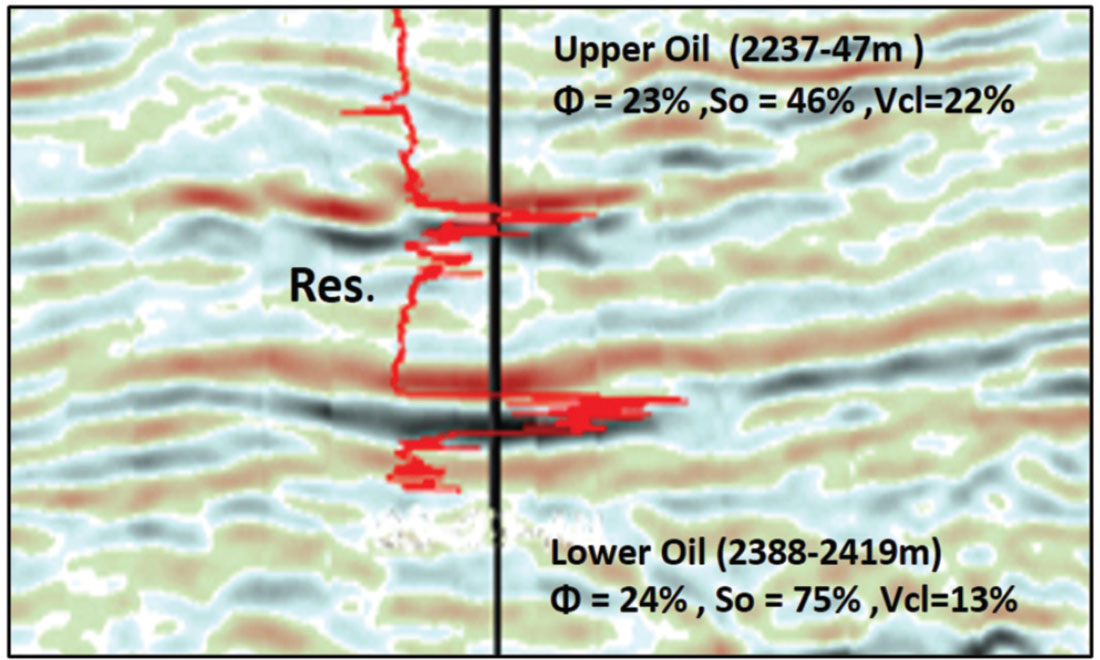
The seismic expressions of the two oil sands are much alike and are portrayed by high amplitude anomalies (Figure 4). Since the seismic amplitude at an interface depends on the impedance contrast between the rocks across it, changes in properties of one or both rocks will affect the reflection response. This is exemplified in the density, VP and P -impedance plot (Figures 5 a & b) for both the reservoirs. For the upper sand, while both the density and VP show lower values with respect to overlying shale, for the lower sand the density shows a decrease and the VP shows an increase. Nonetheless, impedances of both the oil sands are lower with respect to impedances of overlying shales. The impedance contrasts are seen as moderate (negative, 0.05 units) for the upper and insignificant (negative, 0.01 unit) for the lower sand. Consequently, fair and poor/no seismic reflections for the sands are expected at zero and near offsets and amplitude build ups with far offsets due to oil saturation. However, the similarity in the high amplitude anomalies for the two oil sands and their magnitude of amplitudes as seen on stack section (Figure 3) are not anticipated.
| Reservoir parameters |
Oil sand (Upper) |
Oil sand (Lower) |
Marginal sand (Upper) |
Marginal sand (Lower) |
|---|---|---|---|---|
| φ (%) | 23 | 24 | 17 | 21 |
| Vcl (%) | 22 | 13 | 24 | 16 |
| SW (%) | 54 | 25 | 70 | 100 |
| Table 3a: Reservoir parameters | ||||
| Reservoir parameters |
Oil sand (Upper) |
Oil sand (Lower) |
Marginal sand (Upper) |
Marginal sand (Lower) |
|---|---|---|---|---|
| φ (gm/cc) | 2.2 | 2.2 | 2.3 | 2.3 |
| VP (m/s) | 2360 | 2625 | 2685 | 2830 |
| VS (m/s) | 1335 | 1480 | 1365 | 1410 |
| VP/VS | 1.8 | 1.8 | 2.0 | 2.1 |
| Table 3b: Seismic properties | ||||
AVO analysis
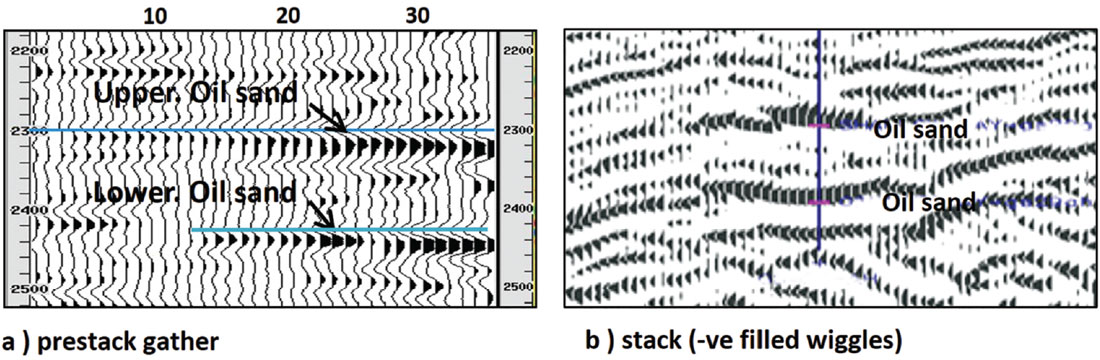
A flattened pre-stack gather at the well location is shown (Figure 6a) to illustrate the AVO analysis. The reflection amplitude from top of the upper sand in the near traces is feeble with a negative polarity (trough) which continues to increase with increasing offset. Considering a moderate impedance contrast, the reasons for a feeble reflection at near offsets is not quite clear. The thin reservoir consisting of several layers with varying impedances might have caused interference of reflections leading to a weak amplitude of the event. On the other hand, for the lower sand, there is no reflection seen at the near traces, though a weak trough appears half way, with its amplitude increasing with offset. Considering the marginal impedance contrast, the high amplitudes seen at the far offsets (Figure 6a) and that seen in the stacked section (Figure 4, and 6b) is a little surprising. Unlike the upper, the lower sand is thick (31 m) and impedance within it is relatively steady without many indents. However, a noticeable lowering in frequency and poor phase alignment of reflections of the sands, as seen in the prestack gather (Figure 6a) and the conventional stack (Figure 6b), provide an inkling of a possible interference of events. The phenomenon of interference from transitional reflectors can be complicated and only modeling can help comprehend the seismic effects due to changing impedances within a litho unit.
Both the seismic anomalies associated with the oil sands test positive in AVO analysis and are categorized under class-2. Though the anomalies appear bright on seismic section these are not “bright spots” which fall under class-3AVO. Classical “bright spots” are almost always associated with highly porous sands with gas saturation though a few cases are reported (Clarke, V.A, 1992; Whang and Lellis, 1988), where they are linked to saturation by light oil. The ‘bright spot’ phenomenon is commonly believed to be dominantly due to a decrease in VP, attributed mainly to lowering of bulk modulus of pore fluid, either free gas or light oil containing high quantity of dissolved gas. It may be contentious though, as why dissolved gas in oil increases compressibility of a rock when dissolved gas in water is known to create no such effect.
The present case, however, is unique in that the bright amplitudes are seen associated with sands with partial saturation of normal grade oil (API 38°). The VP/VS (~Poisson’s ratio) values for the oil sands vary between 1.7 - 1.9, a value higher than that expected for gas in similar sands. This is because liquids are relatively incompressible and pores saturated with liquid tend to increase VP and consequently the VP/VS value, an effect opposite to the case with gas where it is highly compressible and decreases the pore bulk modulus. ‘Bright spots’ are caused due to decrease in bulk modulus of highly porous sands, which is further aided by considerable reduction in bulk modulus of pore occupied by gas. Under certain conditions, highly porous sands partially saturated with oil may generate anomalies of class -2 AVO but are unlikely to create “bright spots” of class-3 type.
The reservoir parameters and the seismic properties are illustrated in Figure 7.

Conclusions
Rock-fluid Properties:
- Lithology and environment: VP/VS ratio is a good discriminant of shale and sand in the area. Variations in VP/VS ratio for a lithology in a limited small range of depth also helps predict changes in depositional environment and the unconformities.
- Porosity: P-velocities of highly porous sands are affected more by the shapes of pore than the porosity. S-velocity seems poorly sensitive to porosity.
- Texture: Grain size and sorting of the reservoir sands seems to influence largely the VP. Consequently, channel sands and fans, deposited in different environments show dissimilar Pvelocities even within a small limit of depth range.
- Saturation: Though the two sands are saturated differently with 75% and 46% oil, the VP/VS value remains the same (1.8) signifying that the Poison’s ratio is a poor indicator of oil saturation. On the other hand, higher value of VP and consequently the VP/VS (2.1) typify fully and near fully saturated water (brine) sands.
Seismic Responses:
- The two sands in spite of their large difference in oil saturation, exhibit very similar high amplitude anomalies which suggest poor seismic response to changes in oil saturation.
- Oil saturated sands are unlikely to produce “bright spots” of class_3AVO type since liquid in pores contribute little to increase over all rock compressibility, in contrast to the significant increase that is caused by free gas in pores.
- Highly porous young sands at shallow depths with partial oil saturation are expected to show class_2 AVO effects without association of high amplitude seismic anomalies.
- But the oil sands under study show high amplitude anomalies in stack section and class_2AVO behavior, which is conflicting. Considering the frail impedance contrast of the lower sand, the reasons for bright amplitudes in the stack section, are unclear. Interference of reflections is suspected but needs confirmation by modeling studies
- Diverse and rapid changes in rock-fluid properties of clastic deposits under varying environments are exemplified. Consequently, wide-ranging seismic properties can result in creating a mosaic of myriad anomalies which can hardly be categorized. Case wise analysis, backed by seismic modeling is the key to understand seismic rock physics.

Acknowledgements
We are thankful to Oil & Natural Gas Corporation Ltd., India, for the permission to publish the paper.


Join the Conversation
Interested in starting, or contributing to a conversation about an article or issue of the RECORDER? Join our CSEG LinkedIn Group.
Share This Article