Summary
Using seismic methods to image the very shallow subsurface is not yet common. The Applied Geophysics Group at the University of Calgary is involved in developing shallow seismic techniques and identifying their potential value in various disciplines, such as archaeology. To this end, we have conducted a number of seismic micro-survey field surveys including tests at the Maax Na Maya archaeological site in northwest Belize. In 2003, a 3C-3D seismic micro-survey (7m x 7m) was undertaken over a Maya plaza ruin at Maax Na. We recorded data up to about 300 Hz by using a hammer source and omni-geophones. 3D refraction velocities ranged from about 300 m/s to 1300 m/s. Further results from the 3D refraction analysis indicate shallow layers dipping to the southeast which may have archaeological significance in terms of water drainage. Reflection data were more difficult to process (largely because of source-generated noise), but showed structure consistent with the refraction results. Strata identified from a 1.2m deep test pit near the centre of the study are also consistent with the seismic data.
Introduction
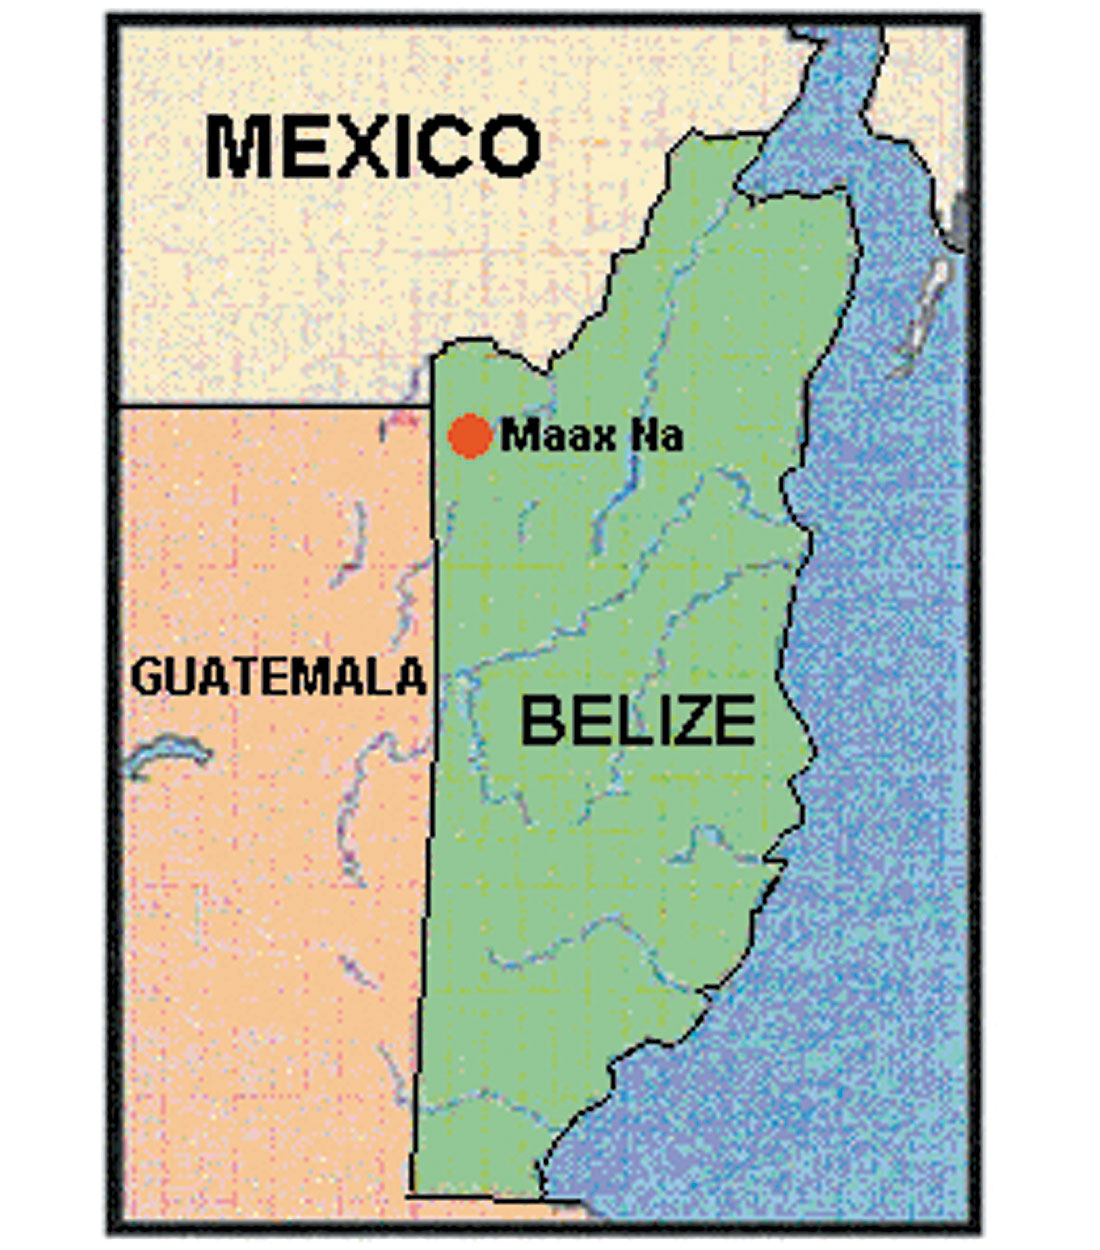
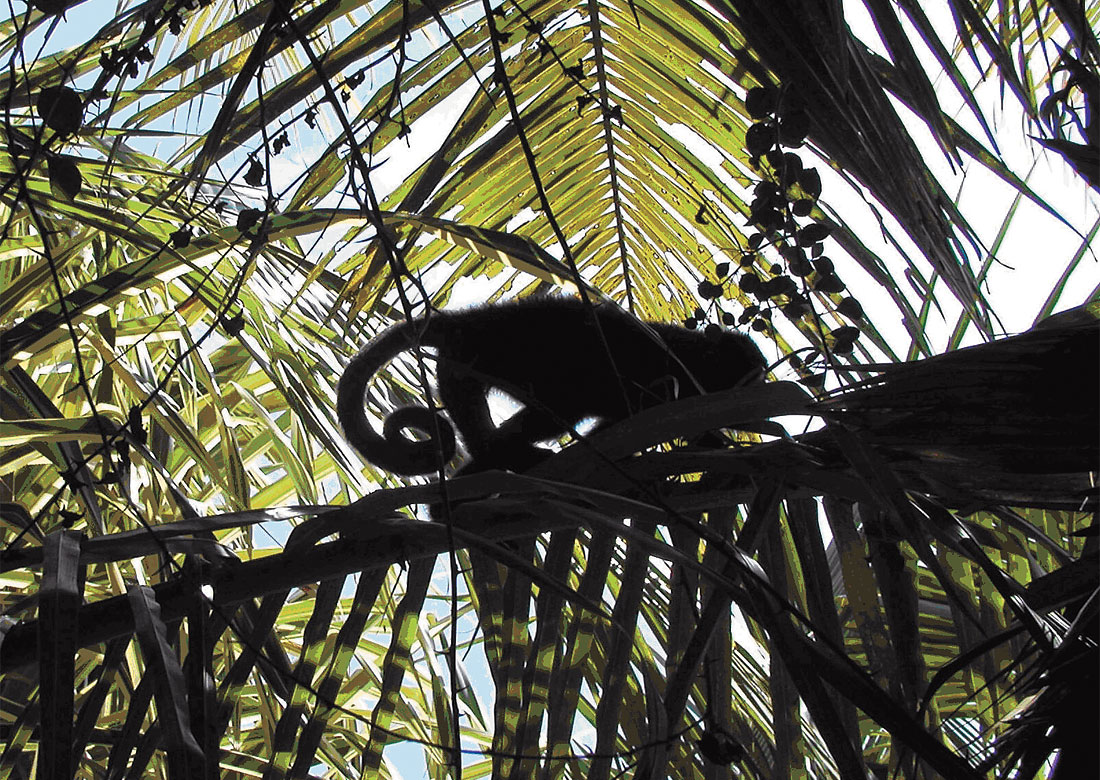
The Maax Na (monkey house in the Maya language) archaeological site is located in the Rio Bravo Conservation area in the northwest corner of Belize (Figure 1). Geologically, the area is characterized by a thick sequence of predominately marine carbonite deposits. A dense tropical rainforest covers the karstically eroded surface. Dirt logging roads have been cut through the jungle, but the final access to the Maax Na site is via a 1km trail. Prolific plant and wildlife populates the region, with the barking calls of howler monkeys (Figure 2) often echoing through the vine-laden canopy. Maax Na is a Mayan site possibly dating from the Late pre-Classic Maya period (250BC – 250AD) and covering about a square kilometre. The topography of the ruins is obscured by jungle growth, but a number of ancient structures tower above the overgrown plazas. Archaeologists are actively exploring and excavating the site. They have unearthed numerous artefacts in the area, from polychrome pottery to sacrificial surgical knives. While often rewarding, the archaeological work is painstaking, labor-intensive, slow, and may not uncover objects or structures. In addition, the very excavations themselves may destroy evidence. Thus, the archaeological community is quite interested in noninvasive, non-destructive reconnaissance and detailed imaging. Our goal in conducting this geophysical work is to support the archaeological efforts by attempting to find seismic anomalies or structures that may be interpreted with archaeological significance. We have undertaken a number of seismic (Henley, 2000) and ground-penetrating radar (Aitken and Stewart, 2004) tests at the site in previous years. This paper describes an experimental seismic micro-survey where we are attempting to adapt 3D seismic techniques to detect anomalies and structure in the very shallow (2m) subsurface.
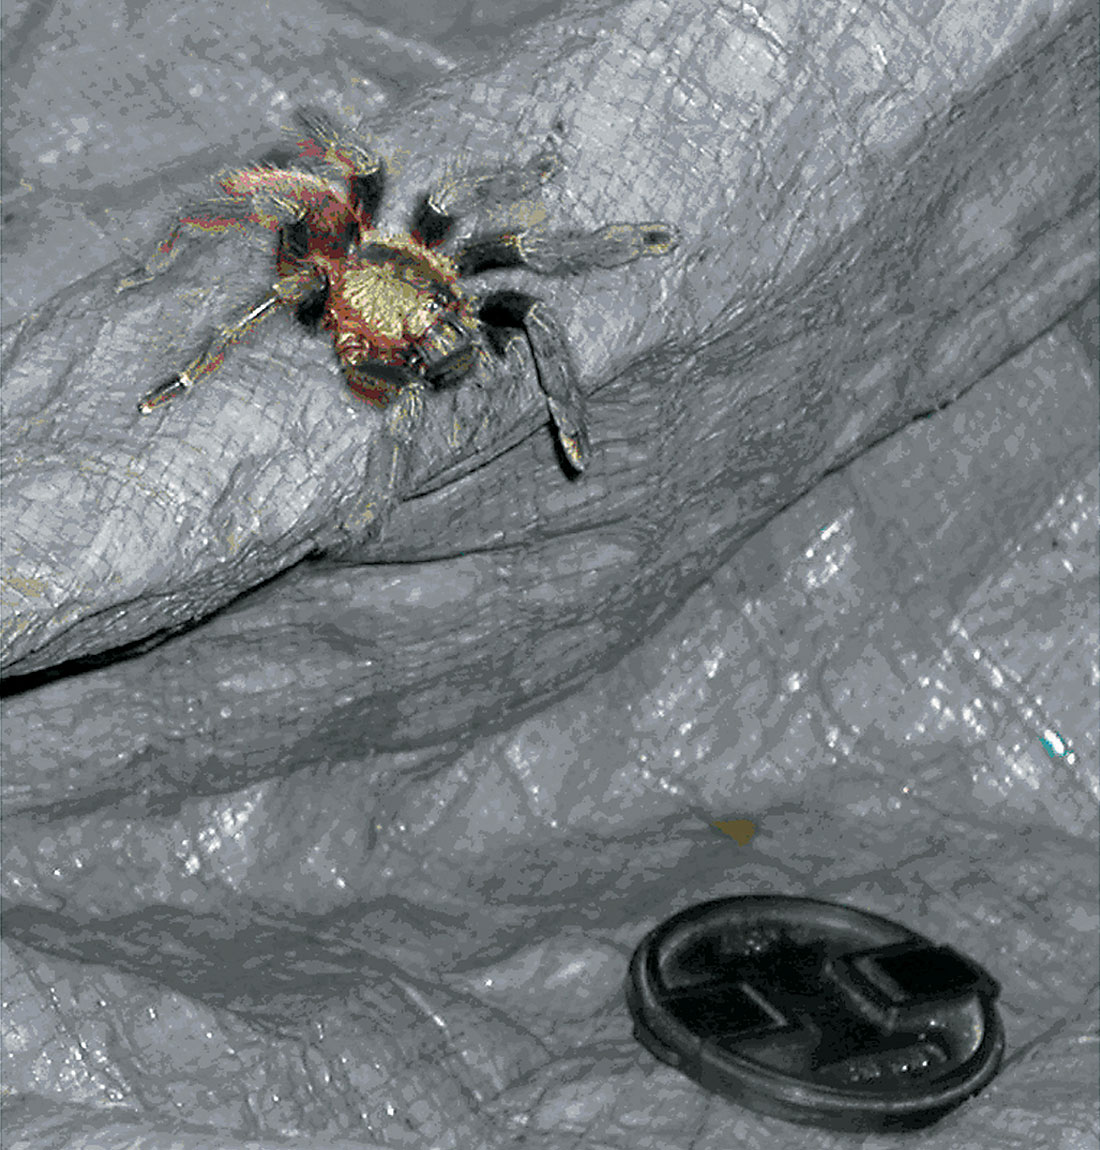
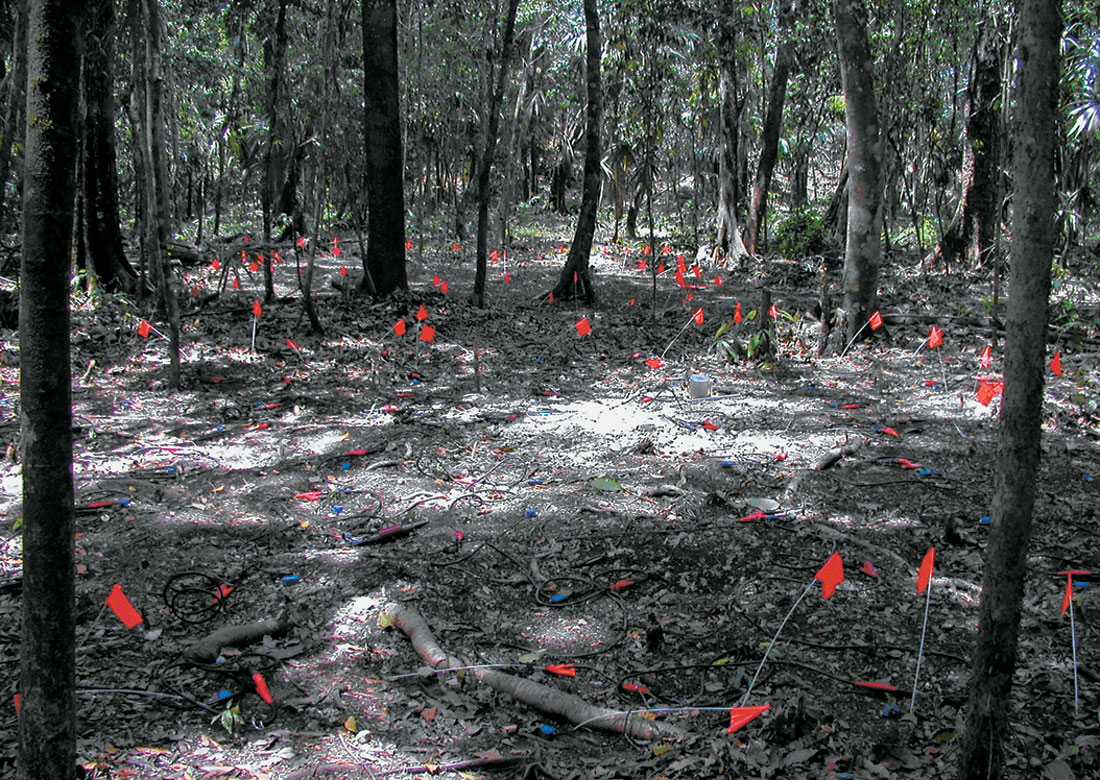
There are numerous operational hazards working in tropical regions such as Belize. Many of the creatures in Belize bite. Their numbers include scorpions, spiders (Figure 3), wasps, snakes (especially the feared and extremely poisonous fer-de-lance), vampire bats, and mosquitos – transmitting afflictions as malaria, dengue fever, and botfly eggs. We have encountered all of these, fortunately with benign results to date.
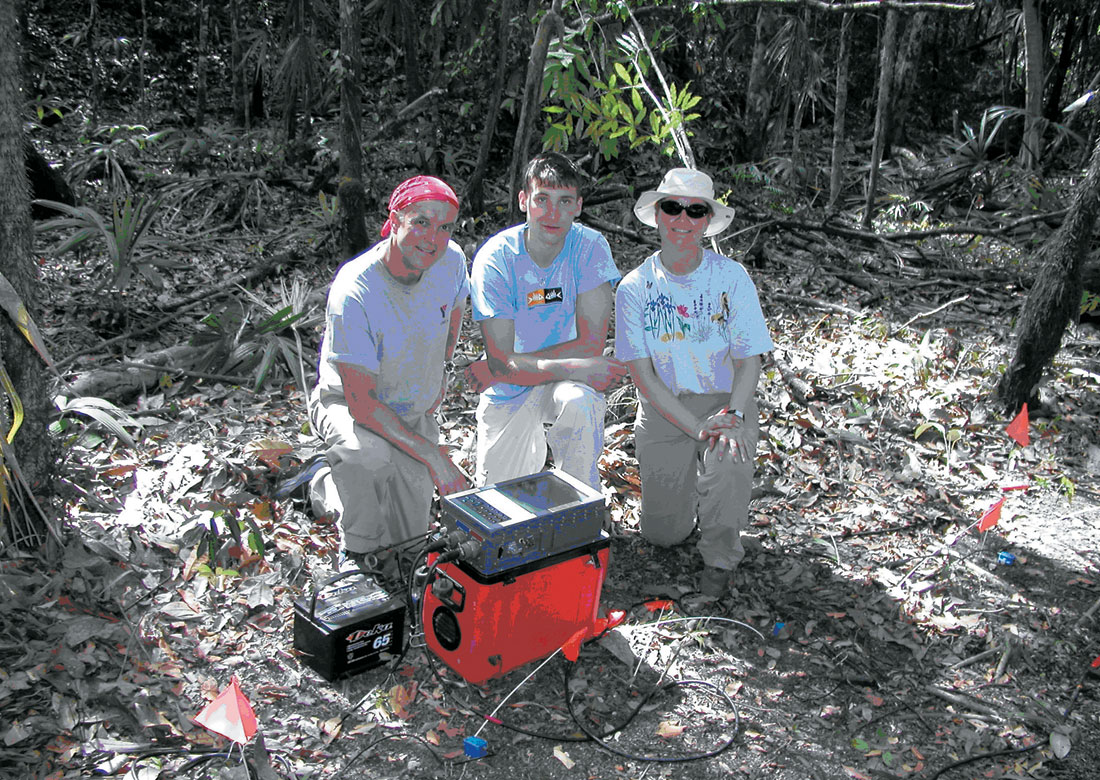
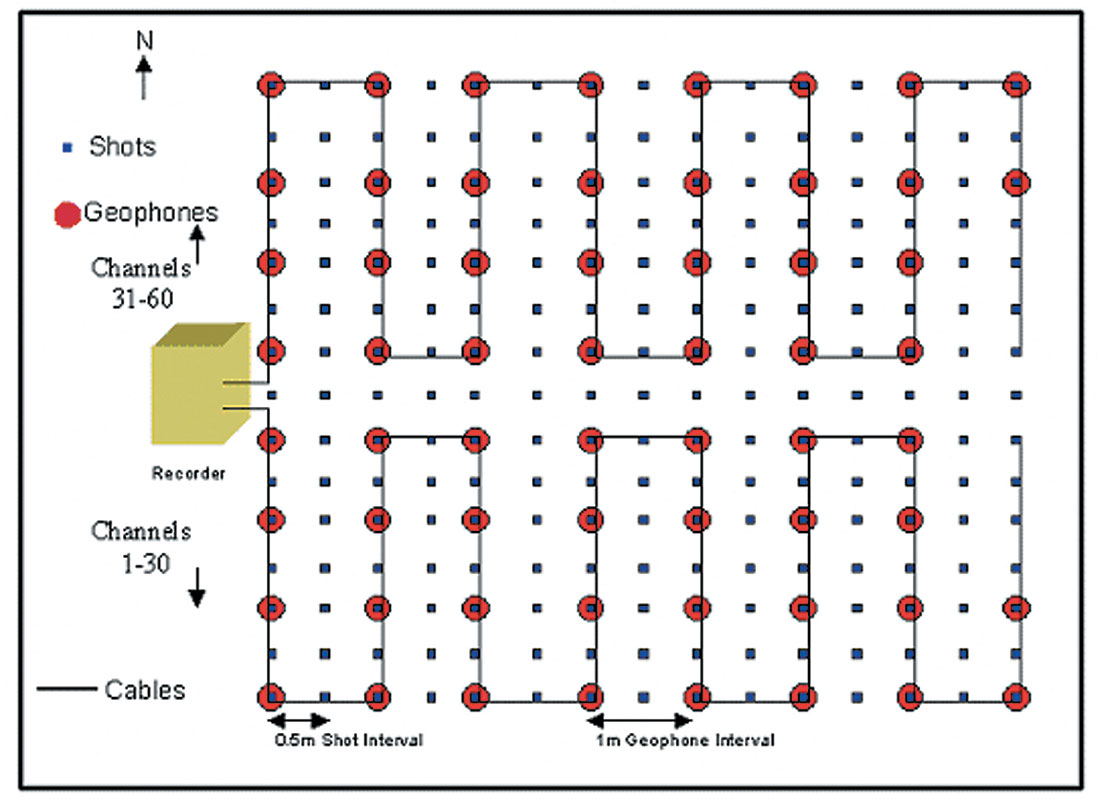
Much of the current archaeological work is focusing on one of the plaza areas and its adjacent “ball court” – the space used in a common Maya sport. We are looking for anomalies in the plaza that could be indicative of walls, pits, tombs, or broad structures such as bedrock dip which may be important for water drainage. To this end, a 7m x 7m survey area was chosen within the plaza area. Intrepid field personnel (Figure 4) used our trusty 60-channel Geometrics seismic recorder for the acquisition. The 3C-3D seismic survey used a receiver spacing of 1 m with a split spread of channels. Channels 1-30 covered the south part of the plaza and 31-60 covered the north part (Figure 5). The geophones employed were special single-component omni-phones with a removable spike that could be attached on one of two sides of the geophone, allowing vertical or horizontal orientations of the sensor. A 2.5kg hammer and an aluminum striking cylinder were used as a source. A trigger was attached to the handle of the hammer and the recorder was set to sample at a rate of 0.25ms. Shots were taken at 50cm spacing with a single blow by the hammer to the top of a cylindrical source. The receiver locations remained stationary (Figure 6) while the full shot spread was run three separate times, one for each orientation of the geophones (vertical, horizontal N-S, horizontal E-W). This resulted in 225 shot records and a total of 13,000 traces for the each component of the survey. Only the vertical component data will be discussed here.
Analysis
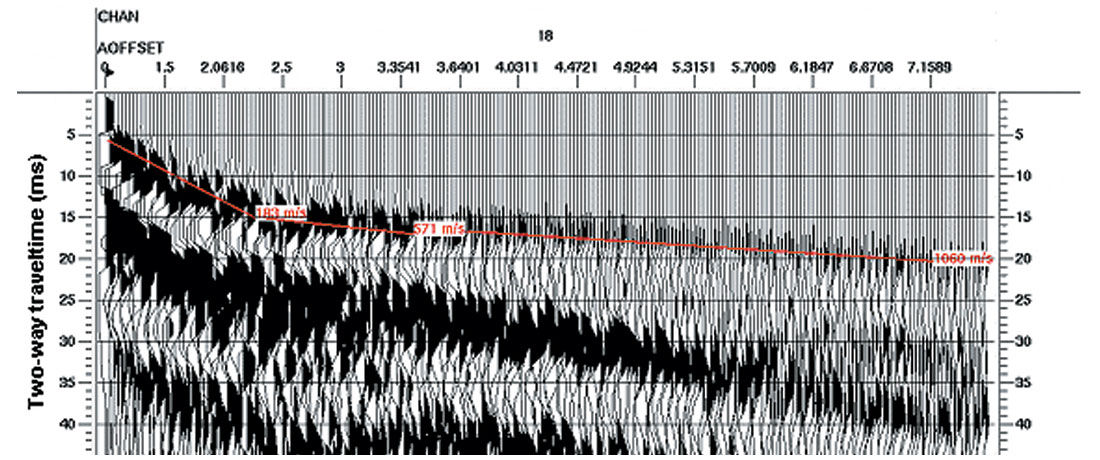
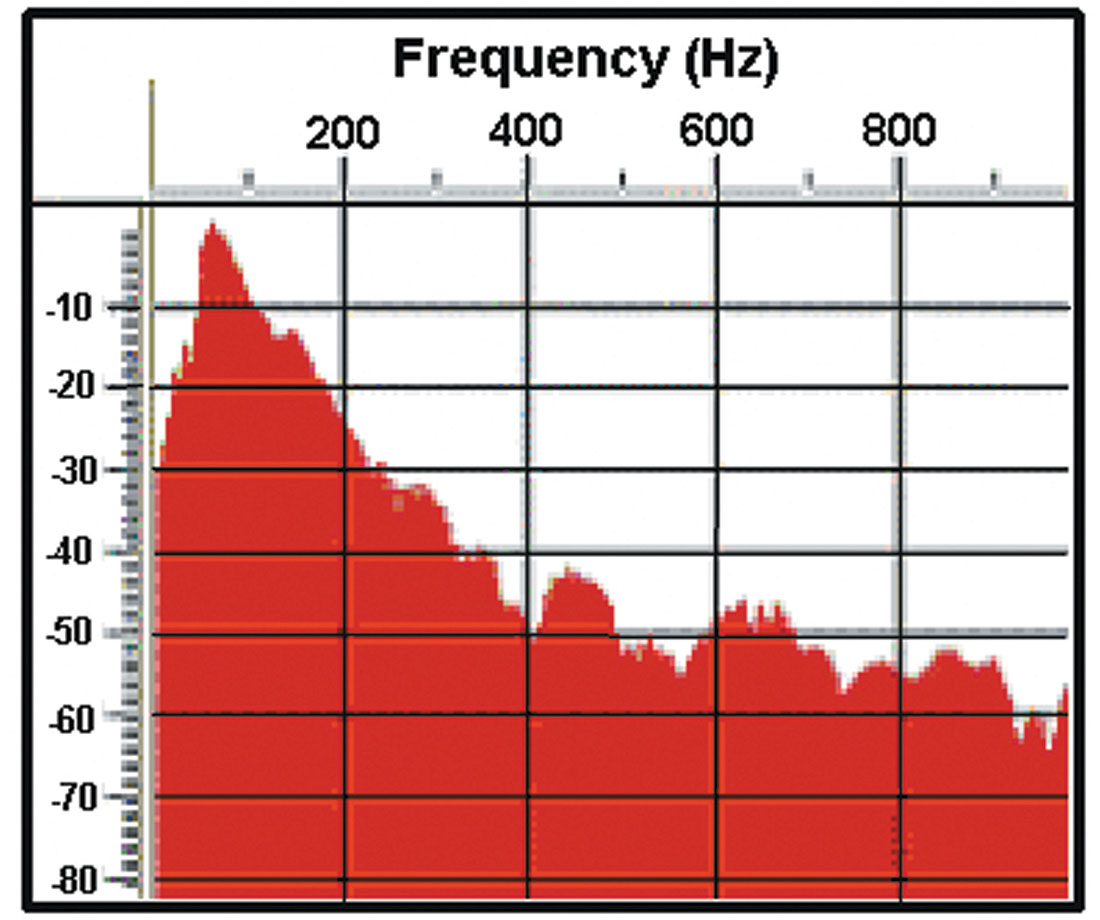
The majority of data processing was performed using the ProMAX software system. The processing approach was to follow a conventional 3D seismic processing flow adapted to the unique geometry of this survey. A raw data shot, sorted by offset, is plotted in Figure 7. The apparent velocities of the first breaks are annotated and range from 180 m/s to 1060 m/s. As shown in Figure 8, the data have a frequency bandwidth of about 10-300 Hz with a dominant frequency around 70 Hz. Based on the analysis of coherent events and noise evident on filter panels, a bandpass filter of 100-140-300-350 Hz was used. A bin size of 1 m by 1 m resulted in a maximum fold of 200 at the center of the survey and a minimum fold of 5 around the edges of the survey. The bulk of the noise contained in the records was most likely low-frequency surface waves.
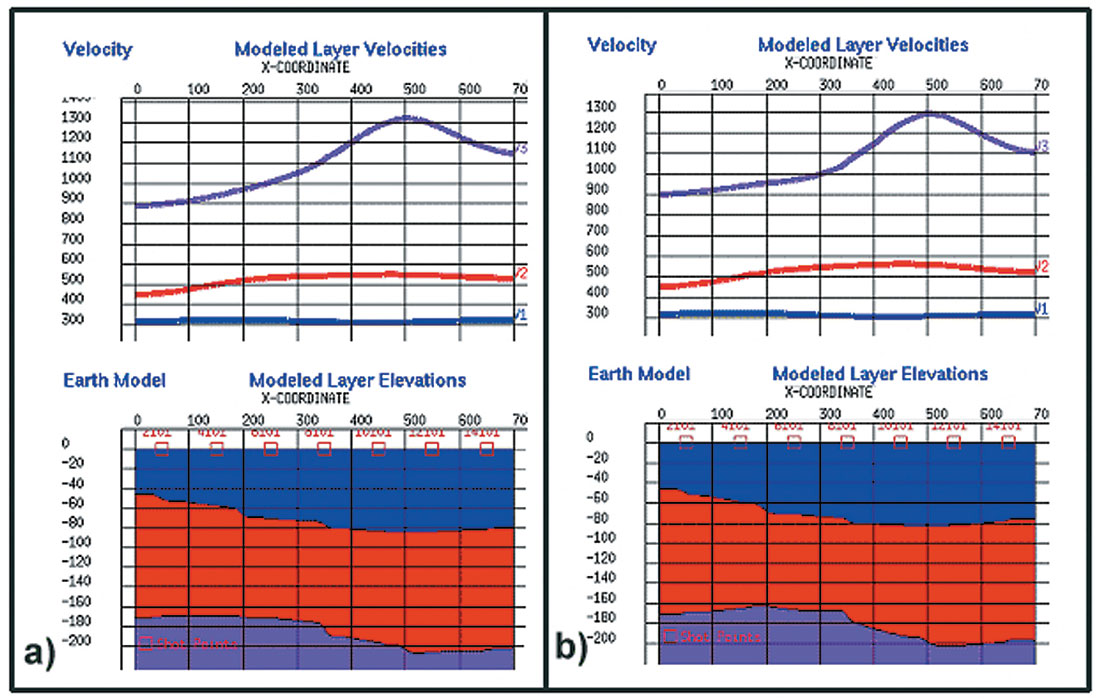
First-break picking was performed on raw shot gathers, and refraction analysis was conducted using Hampson-Russell’s GLI3D program. The refraction analysis provided 3D images of the velocity, thickness, and elevations of a two-layer model overlying a half-space. Further processing such as deconvolution, velocity analysis, normal moveout, velocity filtering, and stacking was performed in attempt to extract the reflection data from the records. The extracted reflection results were then compared to the refraction results.
Results
The refraction static analysis produced a reasonable structure and set of velocities. The 3D elevation plots (Figure 9) from the refraction analysis show a general dip to the southeast for both layers one and two. We see two possible anomalies in these sections as well (a thick in the north-central area and thin in the south central region – Figure 10).
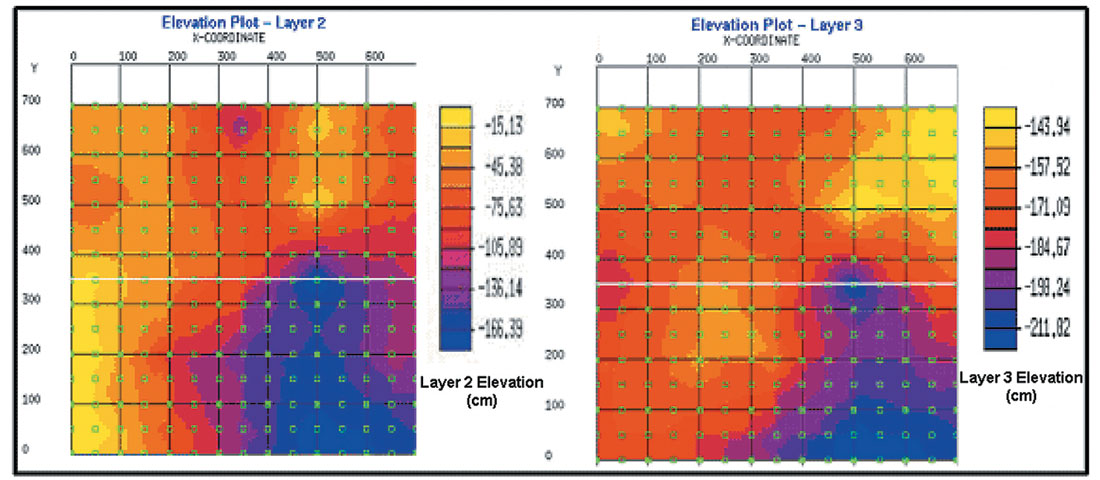
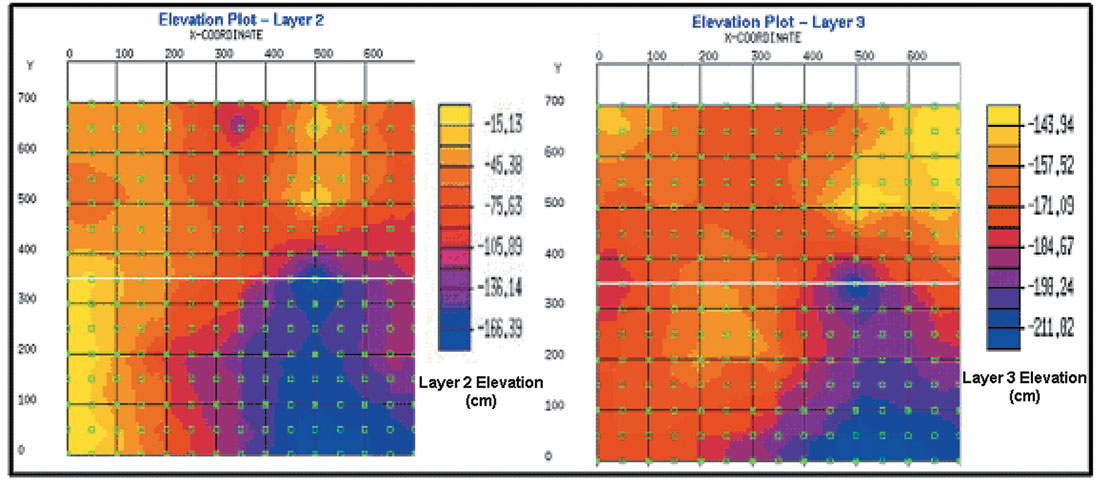
We take the crossline direction to be west-east and inline direction to be north-south across the survey area. Again, these sections (e.g., Figure 11) indicate that there is likely a dip to the east with some structure on the bottom of the second layer. Some of this “structure” may actually be the effect of a laterally variable velocity. The velocities range in value from 300m/s near the surface to 1300m/s at a depth of 1.5 – 2.0 meters. This general southeast dip could be significant archeologically as archaeologists suspect that the Maya may have built the plaza floor with a slope for drainage purposes.
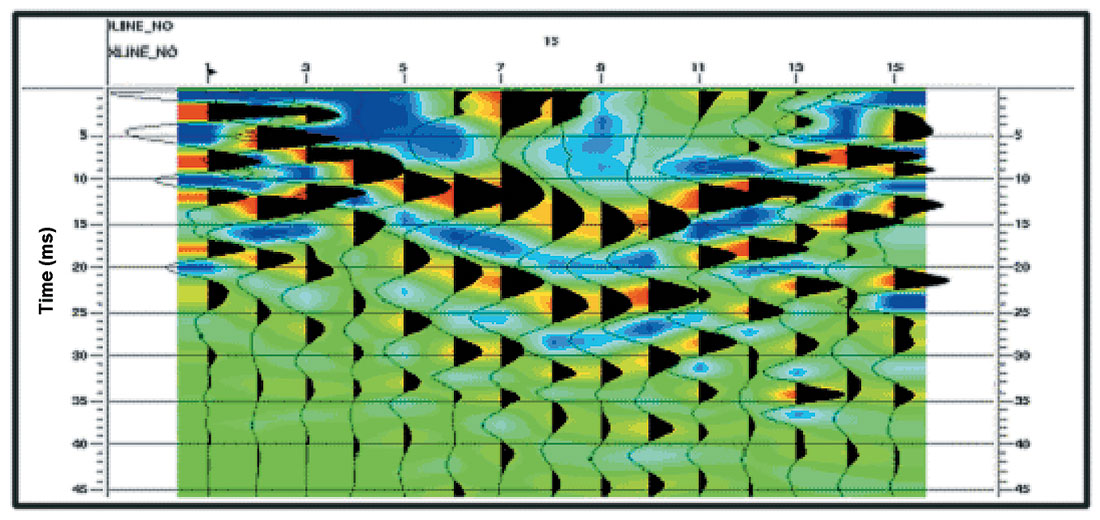
We also attempted to use the reflection data to image the shallow subsurface. This proved to be difficult for a number of reasons. Reflection events are masked by the much stronger direct arrivals and surface waves. Furthermore, with such large velocity contrasts in the near surface, we expect reflections from the top 2m only within a limited offset range of about 3 m. Filtering was unfortunately unable to remove all the low-frequency noise and other nonreflection events – although work continues on this problem. Nonetheless, some events in the sections (Figure 12) do appear to fit the model generated by the refraction analysis. Inline #15 (northsouth) shows coherent events across the section with synclinal shapes. The two-way times to the first horizon correspond to a depth of 0.7m at the edges and 1.4m in the middle. The location of this horizon on the section fits the refraction model reasonably well.
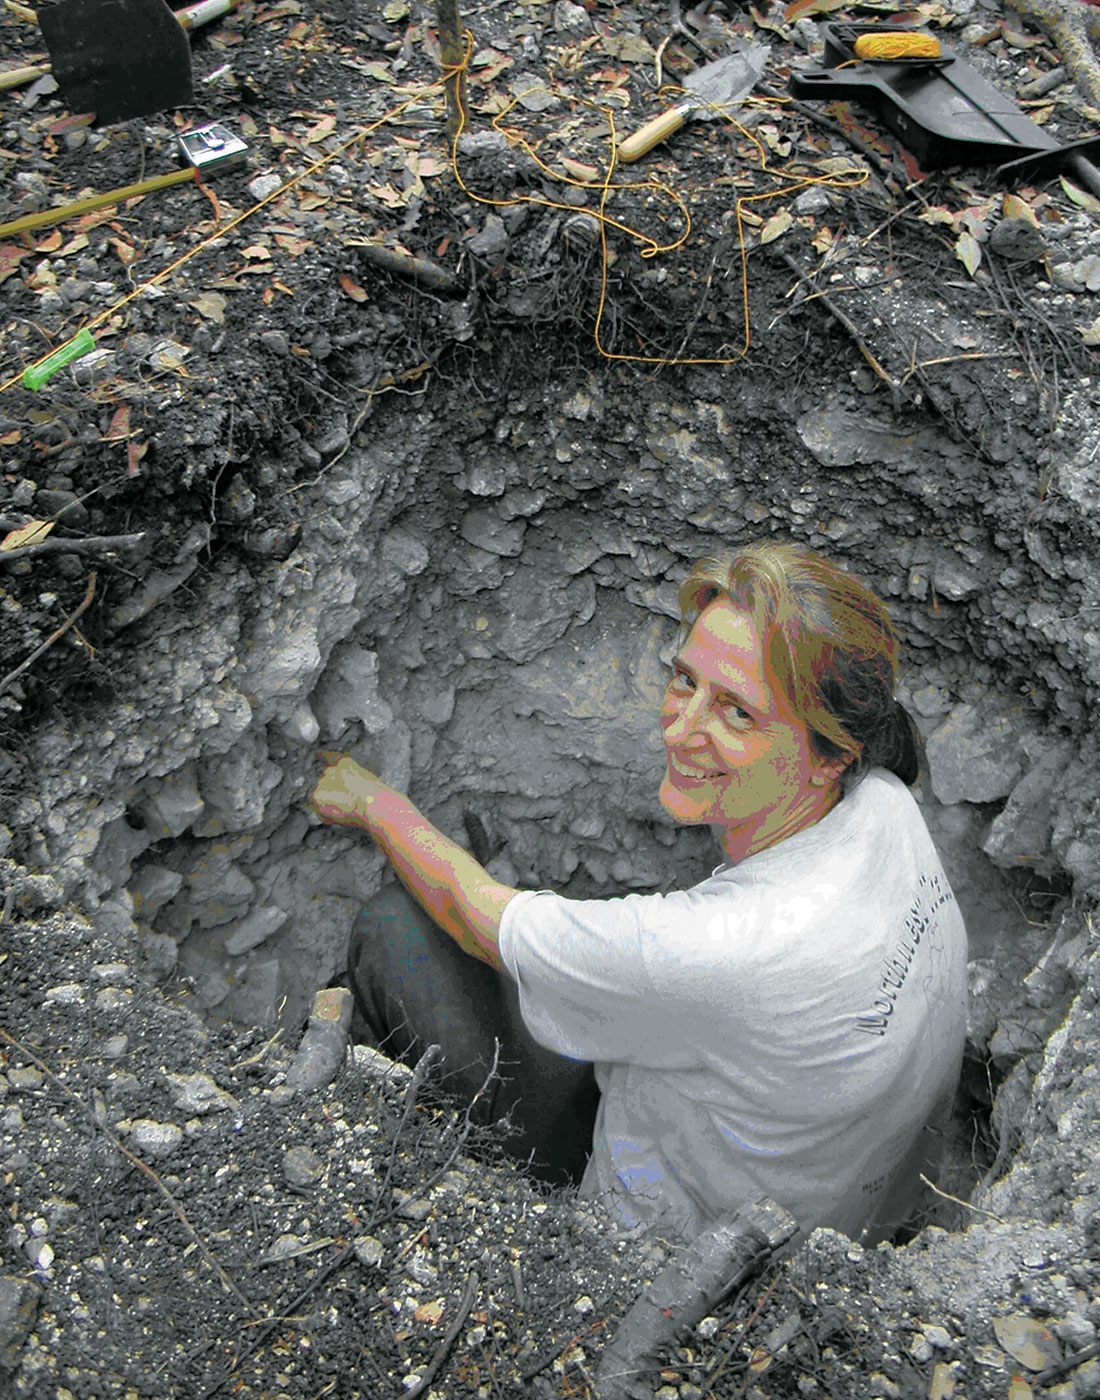
A test pit was excavated at the centre of the survey area by Dr. Eleanor King of Howard University (Figure 13). It revealed a sequence of layering beginning at around a 0.5 metre depth. Within the interval 0.5 – 1.2 metres depth there are at least 7 layers which may each represent the building of a new plaza floor by the Maya. The boundaries between these layers are likely responsible for the refracted and reflected seismic energy.
Conclusions
Based on the survey design and the geology of the subsurface in the survey area, much of the first-break energy is refracted. Refraction analysis provides a compelling method of imaging the shallow subsurface. Promising images are also derived from the reflection data. The test pit, excavated at the centre of the survey area, revealed a number of layers that could form refractive and reflective boundaries. Refraction analysis has provided the archaeologists with an indication of the southeast dip of subsurface layers which is consistent with water drainage provision. Several anomalies would bear further surveying and possible excavation.

Acknowledgements
We greatly appreciate the help of the staff at the CREWES and FRP Projects at the University of Calgary for their expertise in logistics and equipment support (Eric Gallant and Henry Bland) and data analysis (Kevin Hall, Dave Henley, Hanxing Lu, and Dr. Helen Isaac). Thank you to Dr. Larry Lines and Jon Greggs of the Department of Geology and Geophysics at the University of Calgary for their support of this project, especially as field work in other countries becomes more bureaucratically challenging. Drs. Claire Allum and Leslie Shaw of Bowdoin College, Maine, and Dr. Eleanor King of Howard University, Washington, D.C. coordinate the Maax Na Project and kindly assisted with the field logistics and acquisition in Belize. In addition, we thank Dr. Fred Valdez, Jr. of the University of Texas at Austin, the Maax Na archaeology permit holder, and the Belizean Department of Archaeology for their permission to perform this work. The authors also thank the Natural Sciences and Engineering Research Council of Canada (NSERC) for their support of this work via a Discovery Research Grant and Undergraduate Scholarship.


Join the Conversation
Interested in starting, or contributing to a conversation about an article or issue of the RECORDER? Join our CSEG LinkedIn Group.
Share This Article