Summary
Prior to the halt of oil and gas exploration on Anticosti Island in 2017, the Geological Survey of Canada had initiated five research activities related to unconventional resource exploration and development on the island. One such activity aimed to improve the seismic imaging of the Macasty Formation. This thin-layered shale reservoir is located beneath a highly attenuating limestone-dominated Silurian-Ordovician succession that leads to a loss of high frequency energy desired for high-resolution imaging at the depth of the reservoir. To recover high frequency energy and thus improve the imaging of the Macasty Formation, Q-phase compensation, zero-phase deconvolution and a 90°-phase rotation followed by the application of a Butterworth filter are applied. Results yield an amplitude spectrum that is flatter and broader compared to the original data. New imaging resolves internal high amplitude reflections within the reservoir that are correlative to higher TOC values.
Introduction
Unconventional reservoir exploration and development have led to a substantial paradigm shift within the geoscience community as shale layers in this context act as both source and reservoir rocks. This paradigm shift has reverberated within exploration seismology given that survey design and processing routines have to be adapted to the new purposes of data use such as the imaging of finer scale heterogeneities and layering, and the derivation of geomechanical parameters to better assess and access the resource. Therefore, the quest for high-resolution subsurface imaging has attained new levels since the beginning of the boom in unconventional production in 2008.
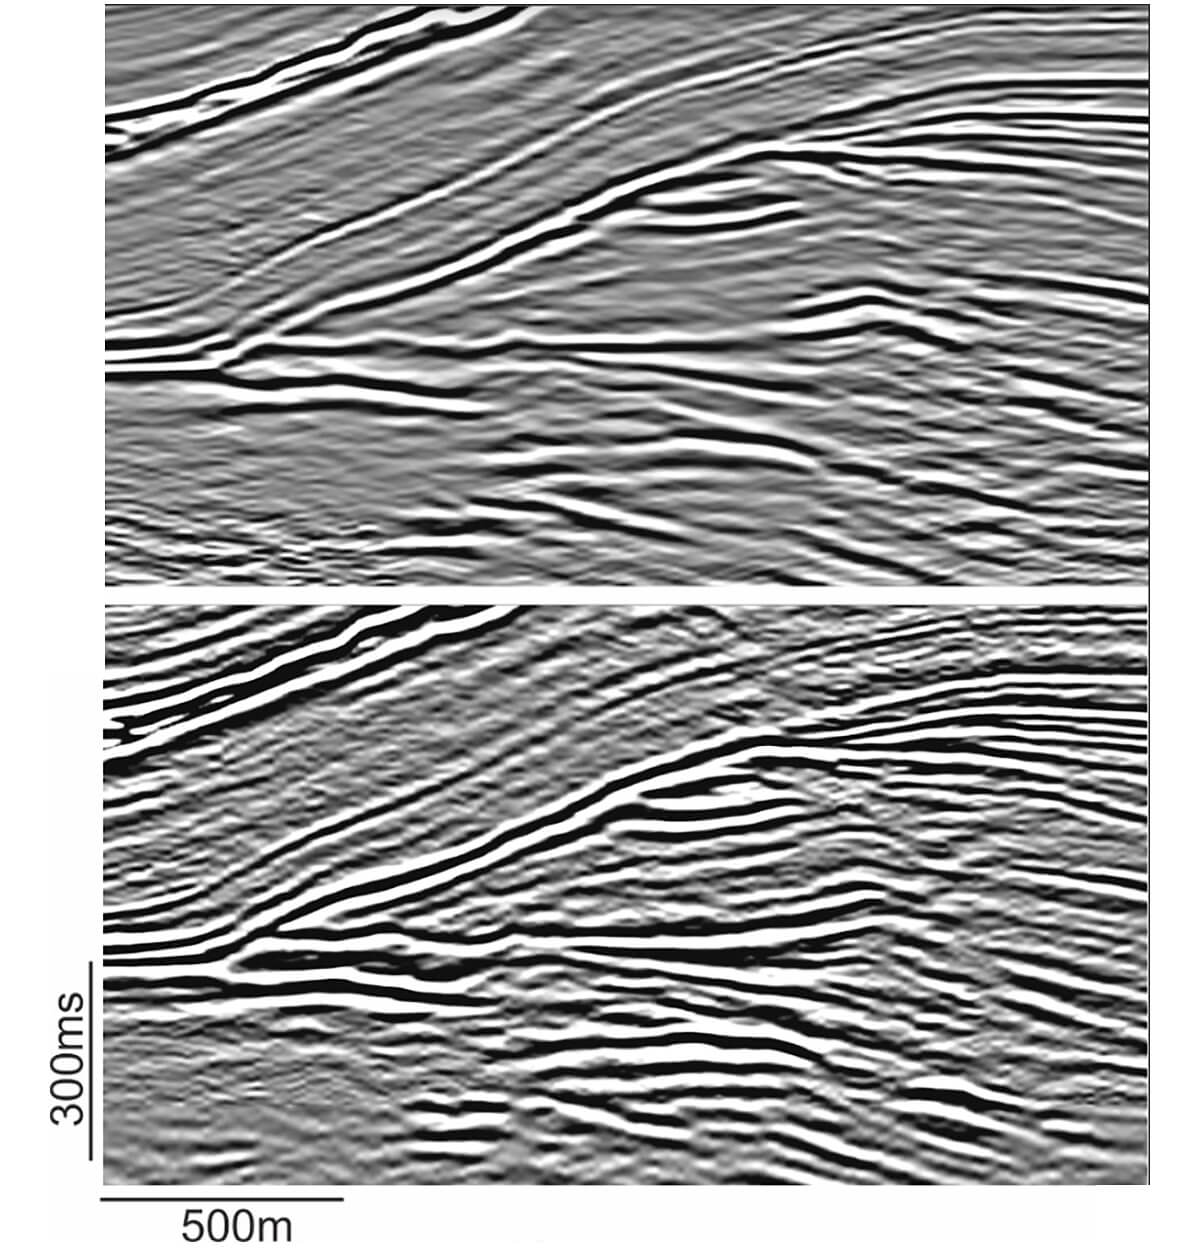
Seismic imaging provides the basis for both conventional and unconventional reservoir exploration and development. Recent hardware developments led to impressive broadband technology achievements that nearly attain the theoretical vertical detection threshold. Denis et al. (2013) discuss how high-density seismic acquisition can overcome source-generated low-velocity wave noise issues and facilitate high-resolution processing. Recently, Wei and Pan (2015) showed that the resolution of seismic images is improved by modifying the mechanical and hydraulic systems of Vibroseis sources to produce more ground force over a wide frequency band. However, as mentioned in Dean et al. (2016) hardware improvement and high-density seismic acquisition both come at considerable cost. Sometimes revisiting existing datasets with modern processing methods can provide results that meet the objective without the investment in a new seismic acquisition program. Figure 1 presents such an example, as data collected and processed originally in 2006 were reprocessed in 2016 to enhance the imaging of the internal structure of a gas reservoir. The reprocessed data show an improved coherency and increased signal-to-noise ratio that allow reservoir structures to be picked more easily.
Seismic imaging of thin-layered media: limitations imposed by the Earth
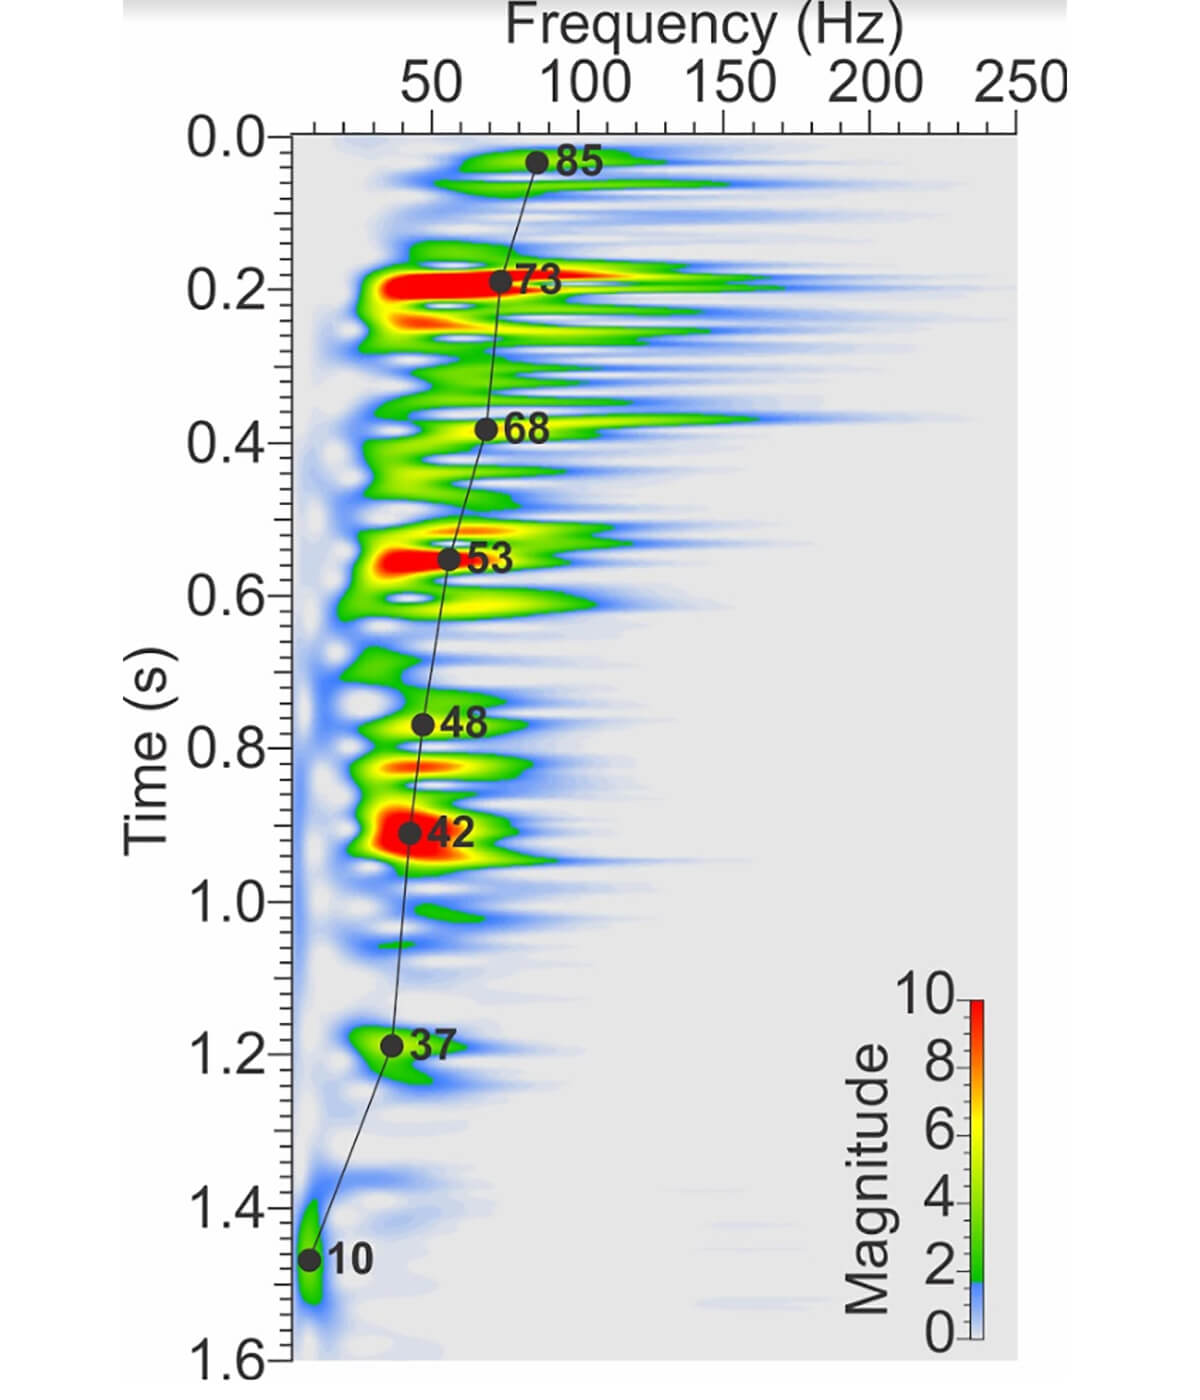
The vertical resolution of seismic data is determined by two variables: phase velocity and the dominant frequency of the seismic wave used to explore the subsurface. The theoretical vertical resolution of Ricker wavelets allowing two reflectors to be resolved is often approximated by the Rayleigh Criterion which is equivalent to ¼ of the dominant frequency or ¼ of the wavelength (Kalweit and Wood, 1982). As waves propagate into the Earth, the dominant frequency decreases with distance. Figure 2 illustrates the decrease of the dominant frequency caused by the Earth’s filtering effect over the Silurian/Ordovician carbonate-dominated interval of the Anticosti Basin (Eastern Canada). The time-frequency analysis conducted on a seismic trace extracted at a well location reveals that, over the first 1.6 s, the dominant frequency passes from 85 to 10 Hz.
As it travels into the Earth, the seismic wavelet is modified: amplitude suffers from an exponential decrease with distance from the source, from the partitioning of energy at reflecting interfaces, and also from time-variant phase distortions induced by spreading, absorption and dispersion. At short distances from the source, amplitude losses resulting from spherical divergence are generally more important. Over longer distances, amplitude losses and phase distortion caused by absorption and dispersion increase and these become the driving attenuation mechanisms. At depth, they are the main cause for seismic wavelet stretch and therefore the loss of high frequencies (Chen and Wang, 2018). Attenuation is generally determined by the quality factor (Q) of a rock that is a measure of the loss of seismic energy over one cycle. Usually, increases in Q are a function of increases in density and velocity. Geological media having Q values ranging from 10 to 1000 typically form the Earth.
In order to achieve accurate geological interpretations and reservoir characterizations, higher frequencies are required. This is even truer with the increasing exploration for unconventional shale and tight oil reservoirs, since these resources are generally hosted in thin-layered media. For successful thin-bed imaging (<25 m), specific steps targeting the restoration of lost high frequencies caused by the Earth’s filtering effect need to be included in the processing scheme. This is frequently accomplished by the use of inverse filters such as deconvolution and Q-filters applied on prestack or post-stack data (Bancroft et al., 2012; Wang, 2008). However, deconvolution often relies on a stationary operator that does not cope efficiently with the time-variant phase distortions of the wavelet induced by its propagation through the subsurface. Since the time-shift of the original source wavelet increases with time and the deconvolution operator remains stationary during the process, it frequently produces blurred prestack gathers and stack sections. Inverse-Q filtering can also be used to compensate for the loss of high-frequency due to phase distortions (Wang, 2008). However, the success of its application for restoring lost high-frequencies mainly comes with the ability to measure or estimate Q-values properly. Q-values are commonly measured in laboratories or estimated in situ from vertical seismic profiles (VSPs). However Q-values are frequency dependent. Hence, measurements made in laboratories use high-frequency emitters that cannot be directly correlated to seismic frequencies. In situ estimates of Q-values derived from VSPs are the most reliable approximations at exploration frequencies. Q-values are also estimated from surface seismic data using attenuation and compensation functions when VSP data are not available (Wang, 2004).
This paper presents a four-step seismic processing technique to recover high frequencies required to image the thin-bedded unconventional shale reservoir of the Macasty Formation (Anticosti Island, Canada), that are severely attenuated by a >2 km thick overlying limestone-dominated Silurian-Ordovician succession. The technique reported in this paper addresses dispersion and attenuation effects in a 2-D post-stack land seismic dataset using Q values approximated from the surface seismic data.
Geological background and reservoir description
Anticosti Island is part of the Anticosti Basin located in the northwestern portion of the Gulf of St. Lawrence (Figure 3). The island consists of a gently dipping (~3°) sedimentary succession thickening towards the southwest. The Anticosti Basin succession overlies the metamorphic rocks of the Precambrian Grenville domain. The base of the succession is formed by the 400-800 m thick assemblage of limestone and dolostone of the Lower Ordovician Romaine Formation (Figure 3; Desrochers et al., 2012). This formation is unconformably overlain by the 400-600 m thick carbonate dominated Middle to Upper Ordovician Mingan Formation which is succeeded by the Upper Ordovician Macasty Formation (Desrochers, 1988). The thickness of this shale-dominated and organic-rich interval varies from 12 to 125 m. The Macasty Formation is covered by the 900-1200 m thick Upper Ordovician Vauréal Formation. The Vauréal is subdivided into two units; the Lower Vauréal consisting of a mudstone dominated rock interval and the Upper Vauréal, an interbedded limestone and limey-shale. The Upper Vauréal is overlain by the ~60 m thick carbonates of the Upper Ordovician Ellis Bay Formation and the 400 m thick carbonate-dominated, Lower Silurian Anticosti Group which includes the Becscie, Merrimack, Gun River, Jupiter and Chicotte Formations (Achab et al., 2011; Desrochers, 2006; Desrochers et al., 2010; Sami and Desrochers, 1992). The sedimentary succession that outcrops on Anticosti Island is weakly deformed and affected by minor faults and fracture networks (Bordet et al., 2010). These structural features are the witnesses of far field foreland strain related to the Appalachian orogenesis and younger events (Pinet et al., 2015). Previous seismic interpretation also revealed that several high-angle faults cut the base of the sedimentary succession up to the base of the Vauréal Formation, with the greatest throws being associated with the Jupiter Fault (Figure 3; Lynch, 2001; Castonguay et al., 2005; Bordet et al., 2010). Finally, the sedimentary succession thickens in the hanging wall of the Jupiter Fault as depth-to-basement passes from ~2150 m to ~3830 m, 1.5 km north and 21 km south of the fault (Figure 3).
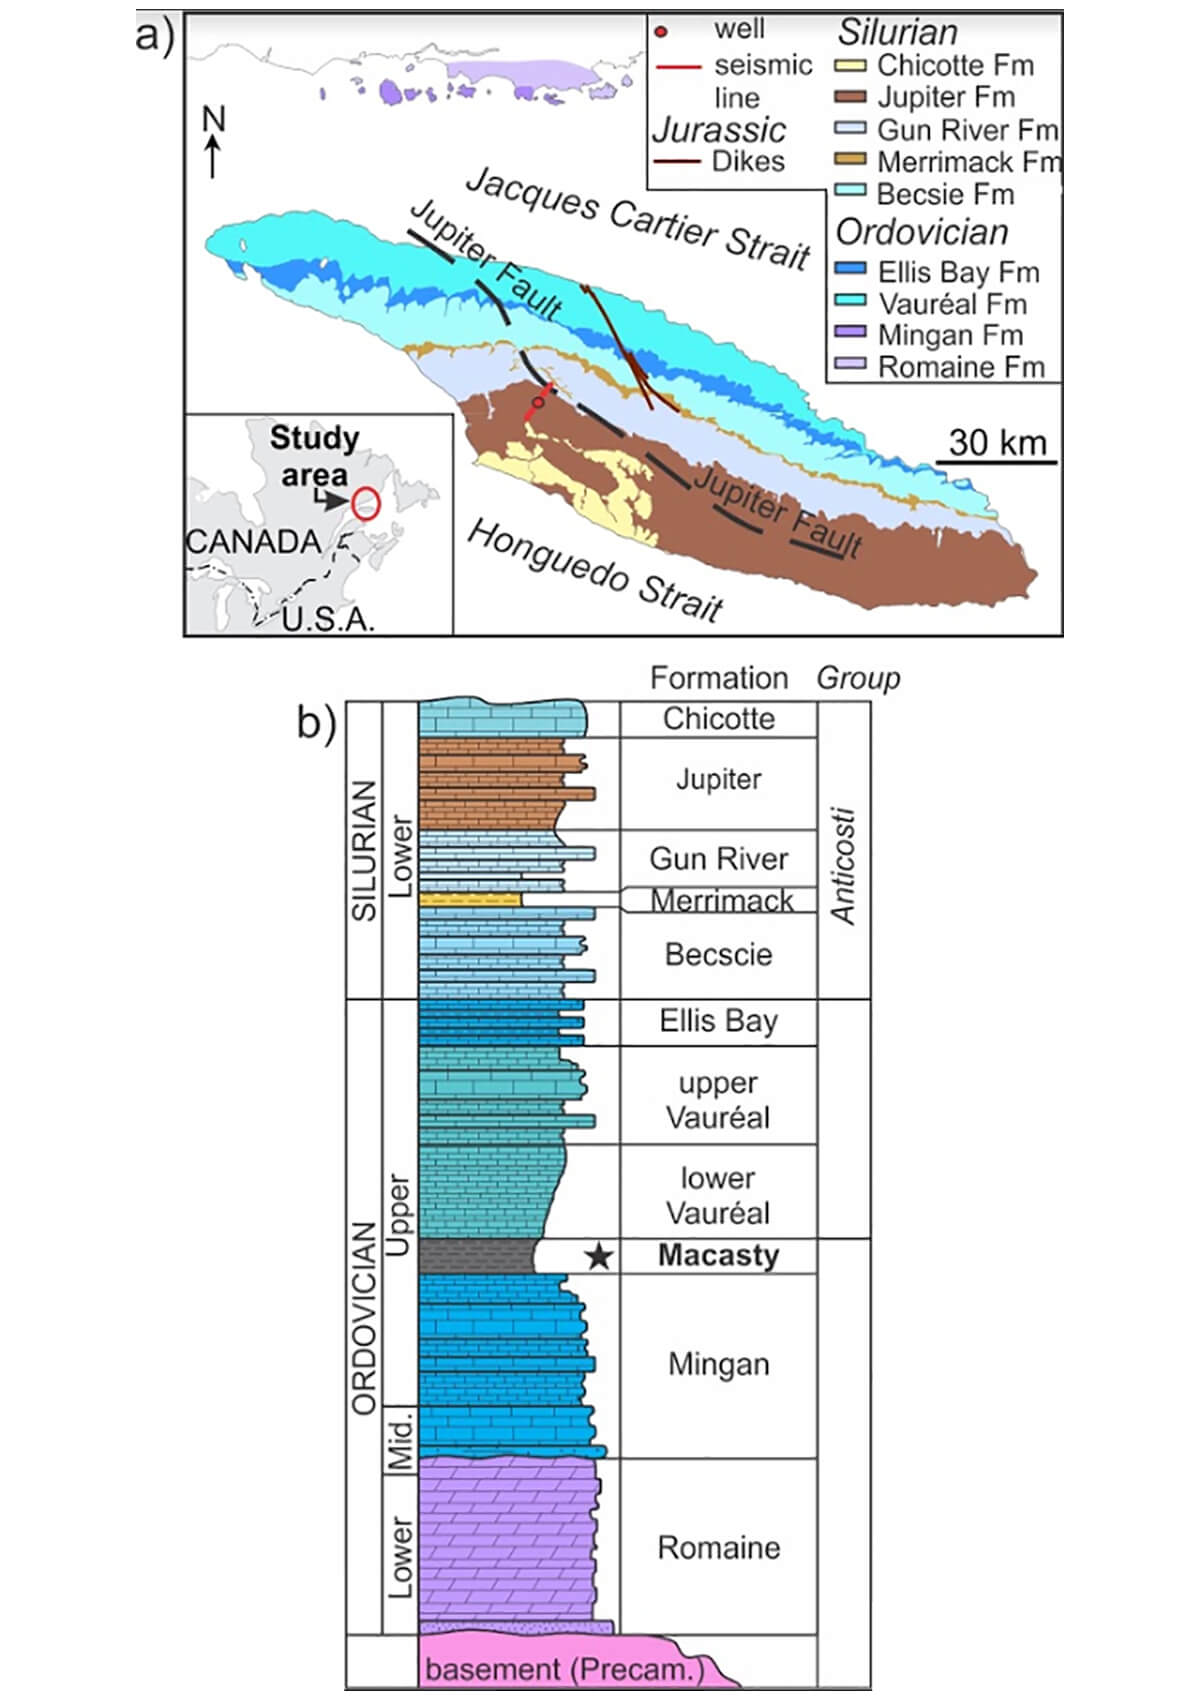
Figure 3.
a) Geological map locating the study area (modified from Lavoie et al. (2009), geology extracted from the Sigeom database (Ministère des Ressources Naturelles du Québec), August 2014 and the position of the Jupiter Fault (black broken line) is from Bédard et al. (2014)).
b) The stratigraphic column of the Silurian-Ordovician Anticosti basin (modified from Bédard et al. (2014).
Although the Macasty Formation is not exposed onshore, it has been encountered in all exploration wells drilled on the island with the exception of one well located on its eastern tip. This formation has been recognized as an excellent source rock since the early 1960s (Bertrand, 1987). Since 2010, the Macasty Formation has been considered as an unconventional reservoir. The top of the Macasty Formation is observed between 350 and 2300 m below the surface. For the example discussed in this study, the reservoir is located at ~1640 m and has a thickness of ~50 m (Chen et al., 2016). Finally, Total Organic Carbon (TOC) of the Macasty shales is between 1.9 and 5.5 wt% for an average of 3.8 wt%.
Dataset
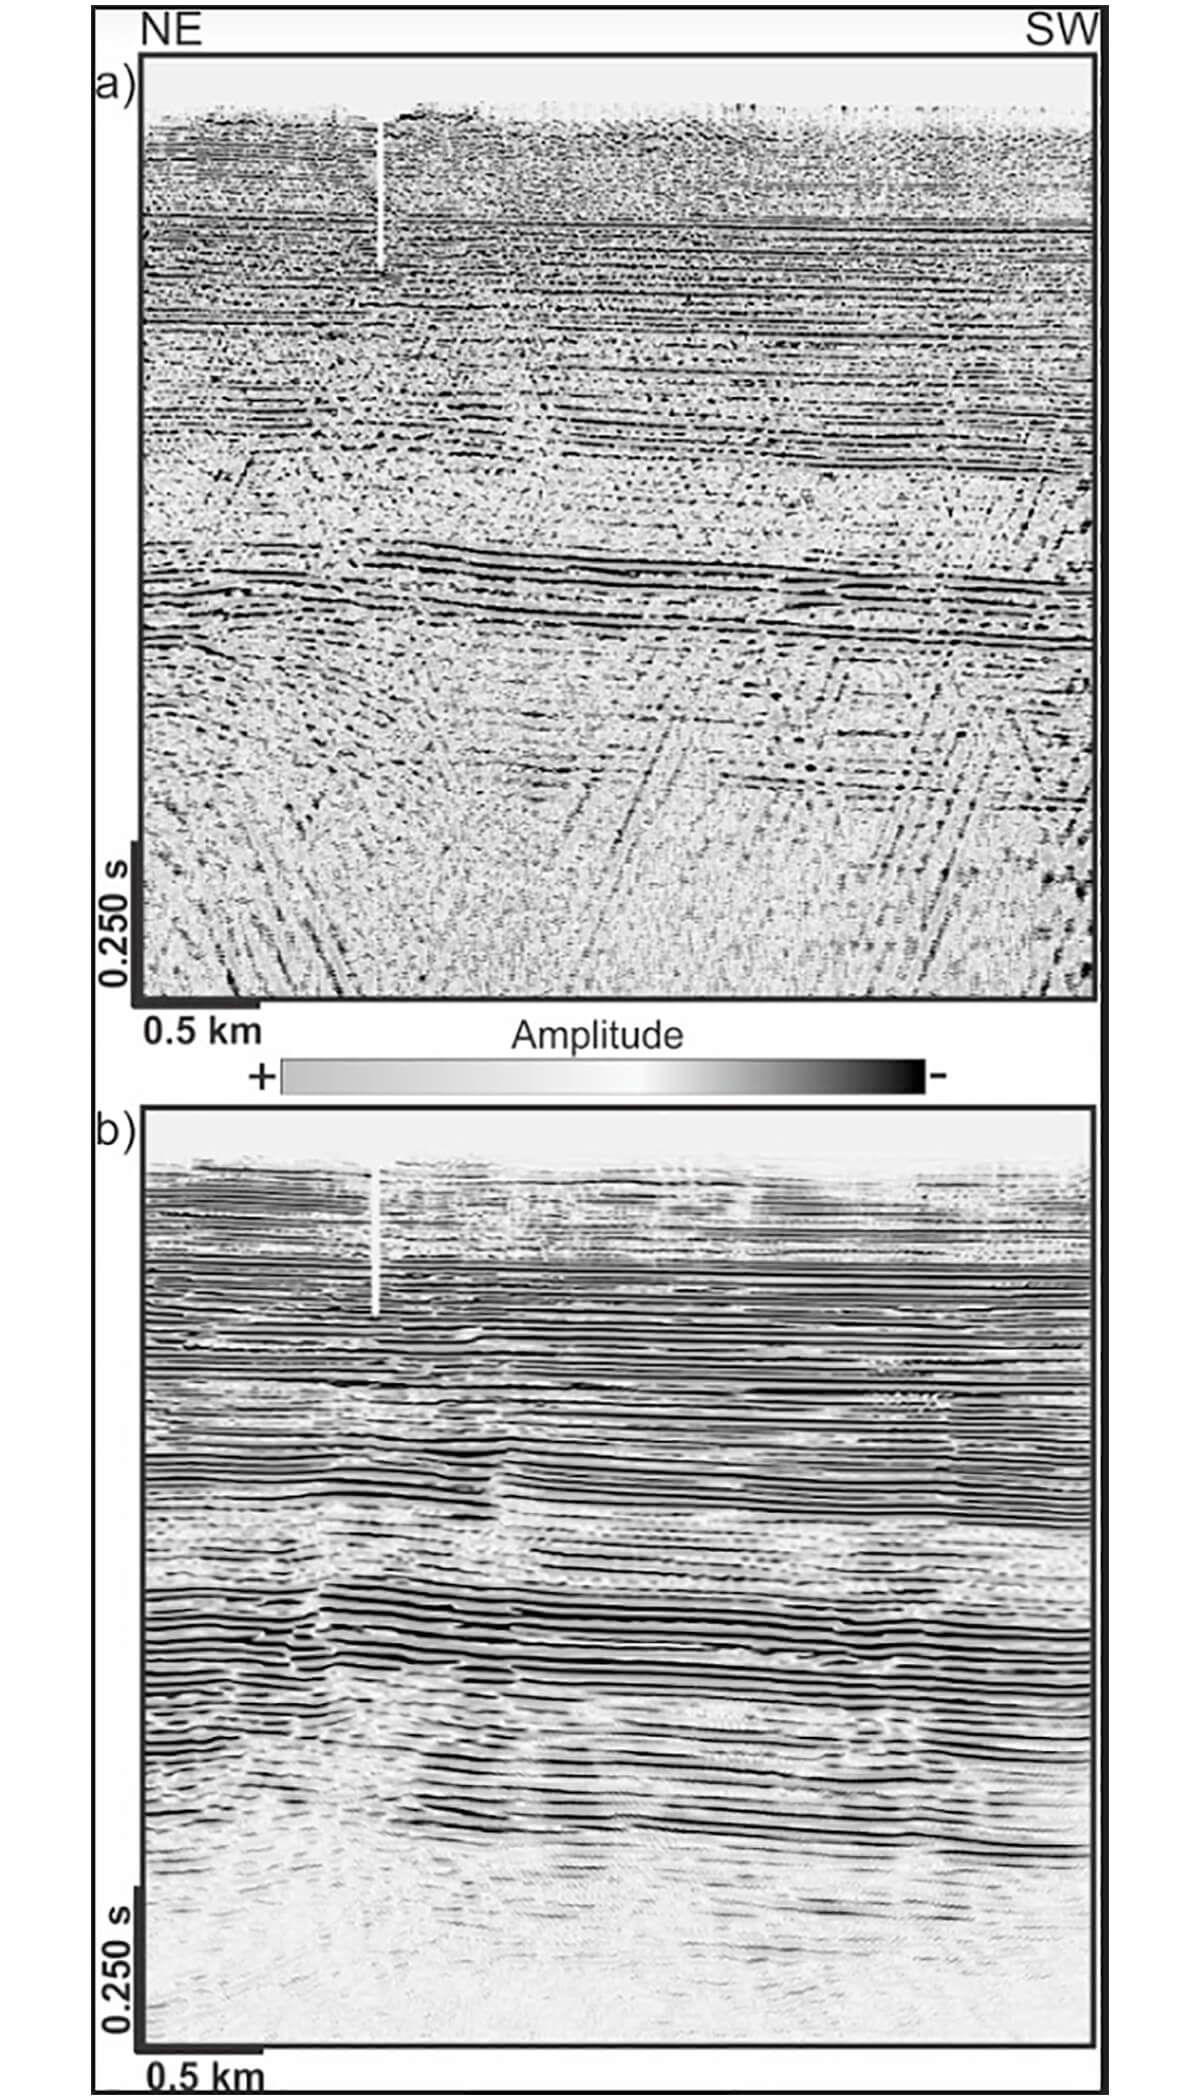
2-D seismic data acquisition was conducted in 1997 using 1 kg dynamite charges with a shot point spacing of 60 m. Reflections were recorded with 144 live receivers deployed at a 20 m interval along a 2880 m spread for an acquisition fold of 2400%. Pre-stack processing included surface consistent deconvolution, elevation and refraction static corrections, velocity analysis followed by normal moveout corrections, surface consistent residual statics, common-midpoint (CMP) cross-correlation statics and weighted cross-correlation CMP stacking (Duchesne et al., 2016). Post-stack reprocessing targeted residual coherent and incoherent noise that plagued the stacked data (Figure 4). Coherent noise corresponded to residual dynamite shot noise. This type of noise was removed in the time-distance domain (T-X) where noise wavelets were constructed along the dips of the dynamite shot noise by including all frequencies contained in the bandwidth of this noise. Modelled wavelets were matched for statics and amplitude with their corresponding trace on the 2-D section so that wavelets were not smeared by static jumps or noise curvature. Dips were calculated using linear moveout (LMO) velocities and each dip was processed separately. Finally, modelled noise wavetrains were adaptively subtracted from the original stacked data. Random noise was isolated by Principal Component Decomposition (i.e. Karhunen-Loève transform; Jones and Levy, 1987) before being subtracted from the data. Next, data were migrated using the phase-shift plus interpolation (PSPI) method of Gazdag and Sguazzero (1984). The PSPI method was chosen due to its ability to handle lateral velocity variations. True amplitude was preserved during the entire processing flow. Finally, four types of well log (i.e. sonic, density, gamma-ray and calliper) were also used to accurately vertically position the Macasty Formation on the seismic data. The sonic log was also employed to develop the processing strategy presented below.
Strategy to recover high-frequency
The high-frequency recovery strategy includes four steps: 1) Q-phase compensation, 2) zero-phase deconvolution, 3) 90°-phase rotation and 4) the application of a Butterworth filter (Duchesne et al., 2016). Steps 1) and 2) follow the procedure proposed in van der Baan (2012) to enhance the bandwidth of the data. This method aims to correct data for dispersion and attenuation phenomena. It was chosen to Q-compensate only the phase of the seismic traces to prevent boosting noise energy. Figure 5 shows the Q-phase compensation procedure that is originally described in Duchesne (2013). This method employs an amplitude decay curve derived from a seismic trace extracted at a well location to approximate changes in absorption coefficient with time, and a time-frequency representation of the same trace to retrieve variations in frequency content as a function of time. First, phase velocity (V) is estimated from the instantaneous velocity (Vinst ) derived from a sonic log. V is larger than Vinst by the secant of the angle between the direction of wave propagation and the direction from which the apparent velocity is measured according to:
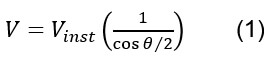
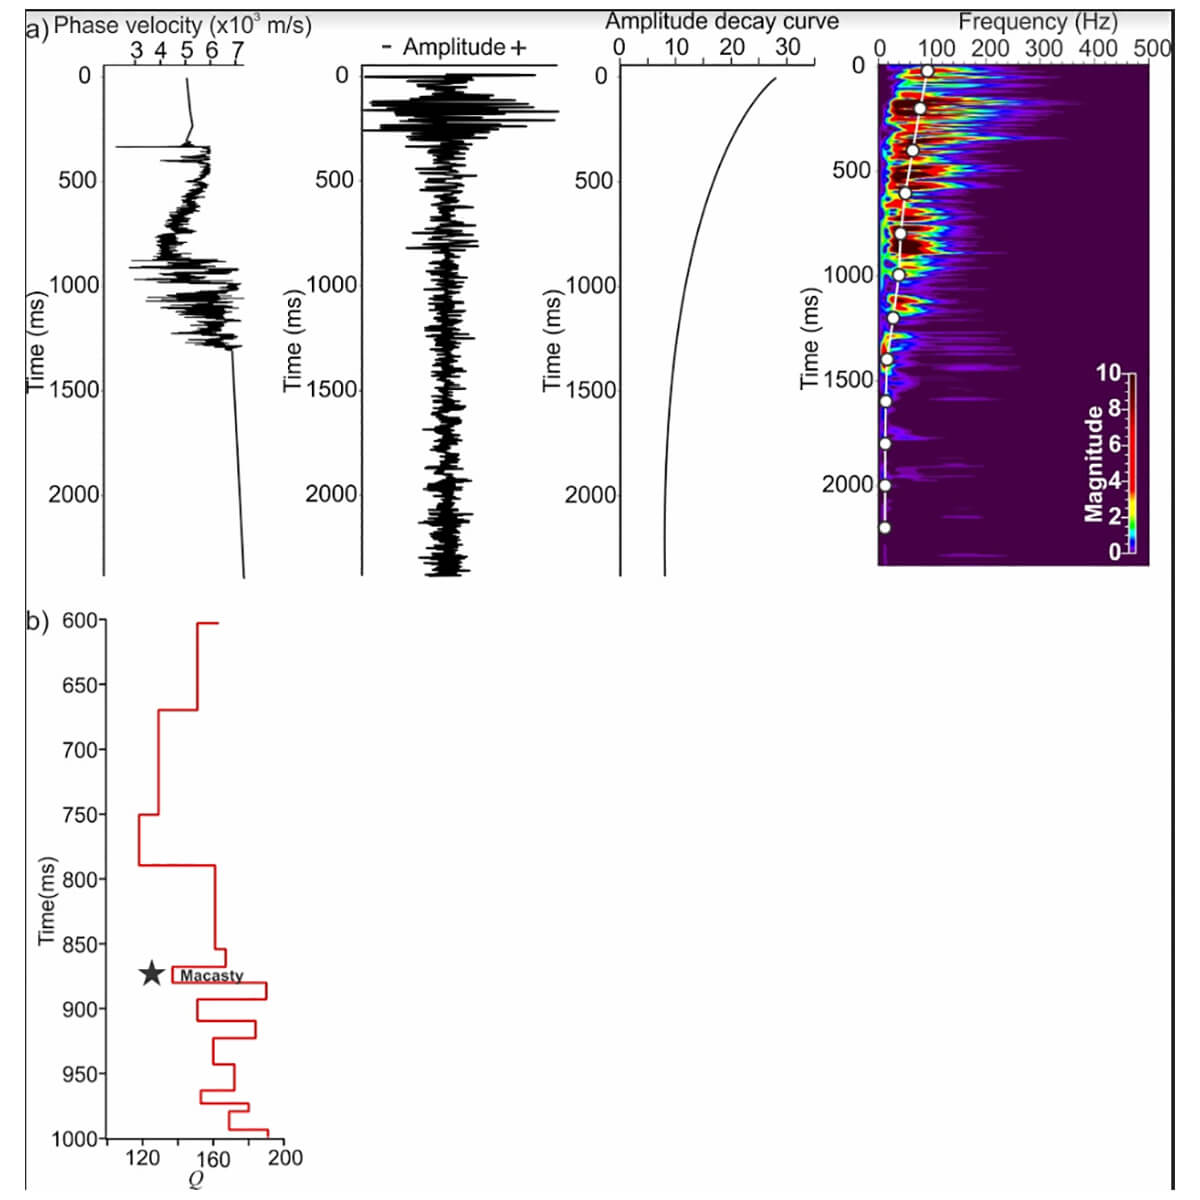
Figure 5. a) Various variables used to build the Q-model. From left to right: Phase velocity derived from a sonic log, the nearest seismic trace recorded from the well location, the computed amplitude decay curve and the time-frequency analysis used to calculate Q values. b) The resulting Q-model computed from well and surface seismic data.
Then, the spreading loss (SL) is estimated from the stacked seismic trace at the well site following:
where A and A0 are respectively the amplitude value time=t0+n and time=t0. Once SL is estimated and subtracted from the seismic trace, the absorption coefficient (η) is approximated from:
in which z is the depth where A0 is measured. In parallel, a time-frequency analysis is performed on the seismic trace extracted at the well site from which SL is subtracted - in other words, before it is compensated for geometrical spreading. Here, the Difference of Gaussian wavelet transform is used to map the seismic trace in the time-frequency domain. This transform is chosen because of its good compromise between time and frequency resolution (Muraki, 1995). Then, for each wavelet transformed in the time-frequency domain the maximum frequency magnitude is automatically picked. Finally, a time-variant Q curve is constructed from variables estimated from (1) to (3) using
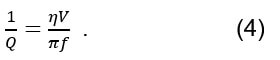
Figure 5b presents the Q-model obtained from this method. The top of the shale reservoir is found at 0.875 s and its Q estimation is 137. The reservoir is included between two layers for which Q-values are approximated between 167 and 190 from top to bottom respectively. Figure 6 presents a seismic trace, its phase and its amplitude spectra before and after time-variant inverse Q-phase compensation achieved in cascade following the method of Hargreaves and Calvert (1991) using the Q-model showed in Figure 5. This step compensates for phase shifts induced by dispersion. One can see that although the seismic trace and the phase spectrum change before and after the compensation, the amplitude spectrum remains mostly unchanged.
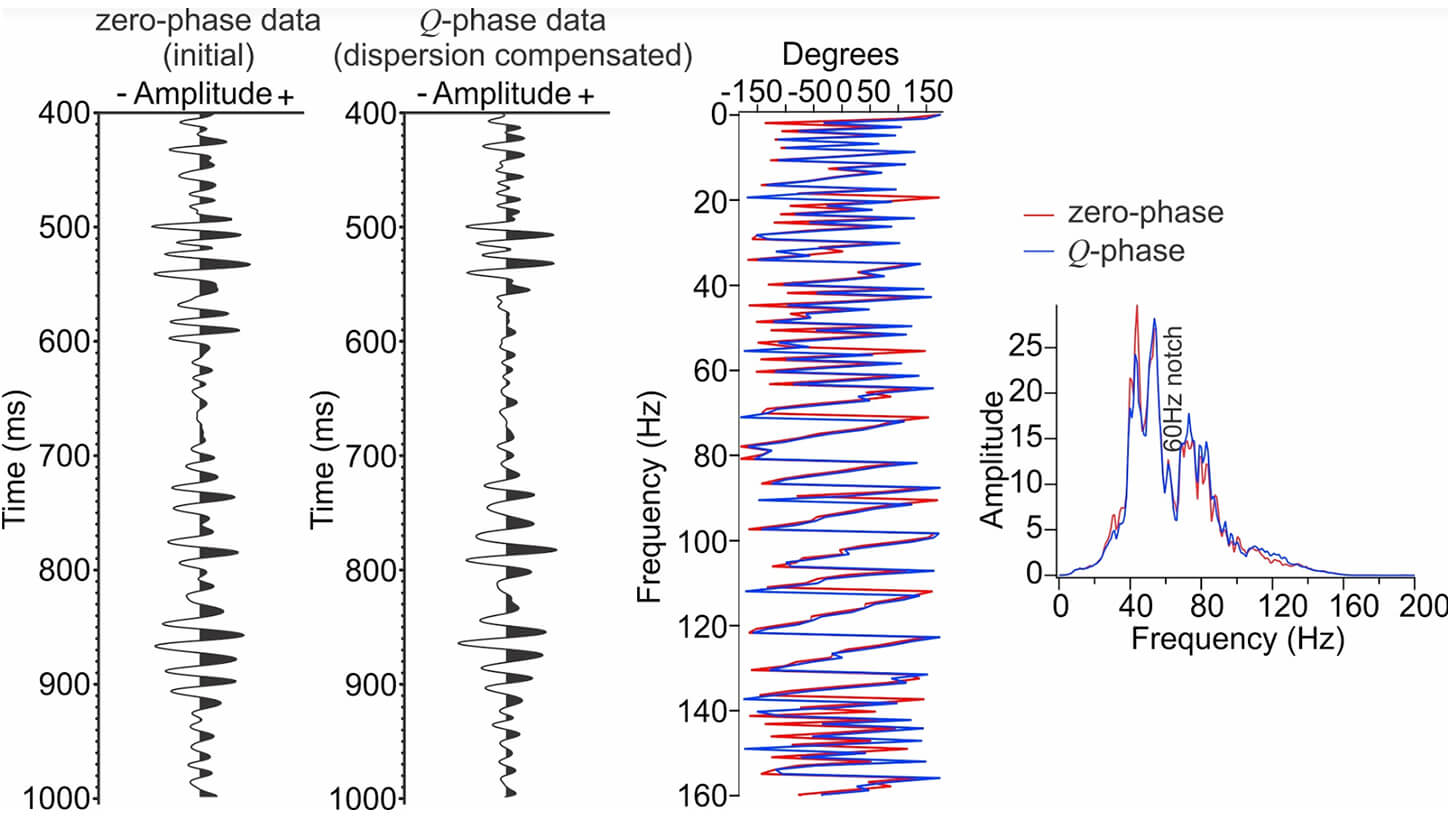
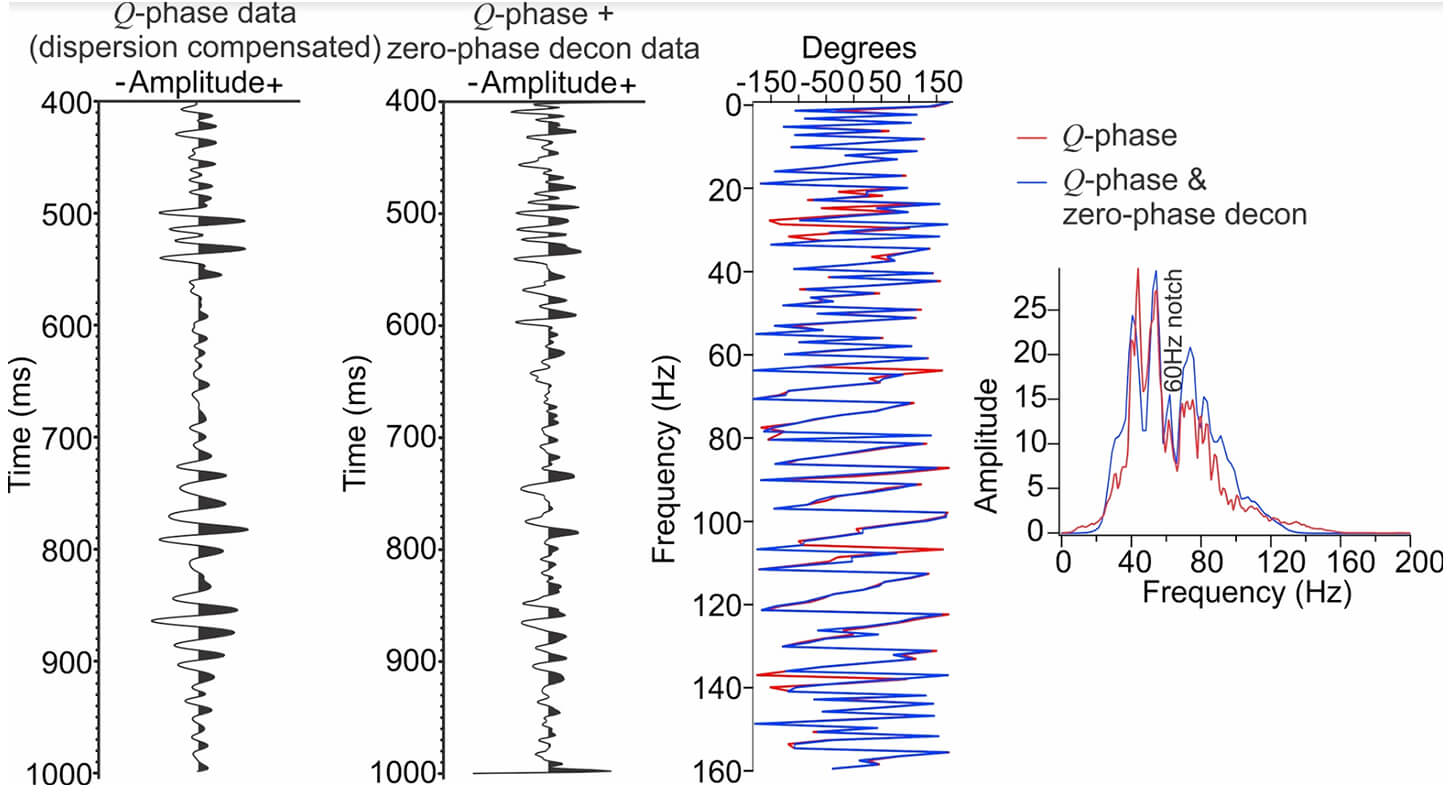
The second step is the application of a zero-phase deconvolution on phase-compensated traces. Zero-phase deconvolution is chosen because phase-only Q-compensation renders wavelets more symmetric, thus closer to zero-phase wavelets. Figure 7 illustrates the application of a zero-phase deconvolution stationary operator that is 22 ms long, has a taper of 6 ms with prewhitening set to 1 % on the Q-compensated seismic trace present on Figure 6. The phase-spectrum has been mostly untouched while the energy over the higher frequency components of the data is now increased.
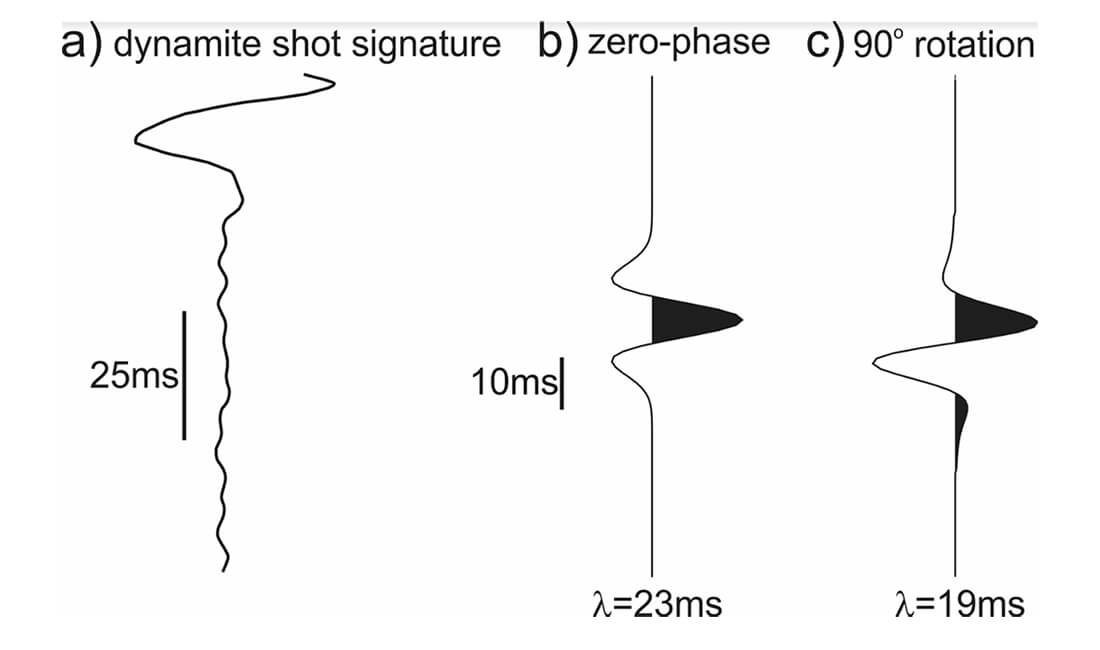
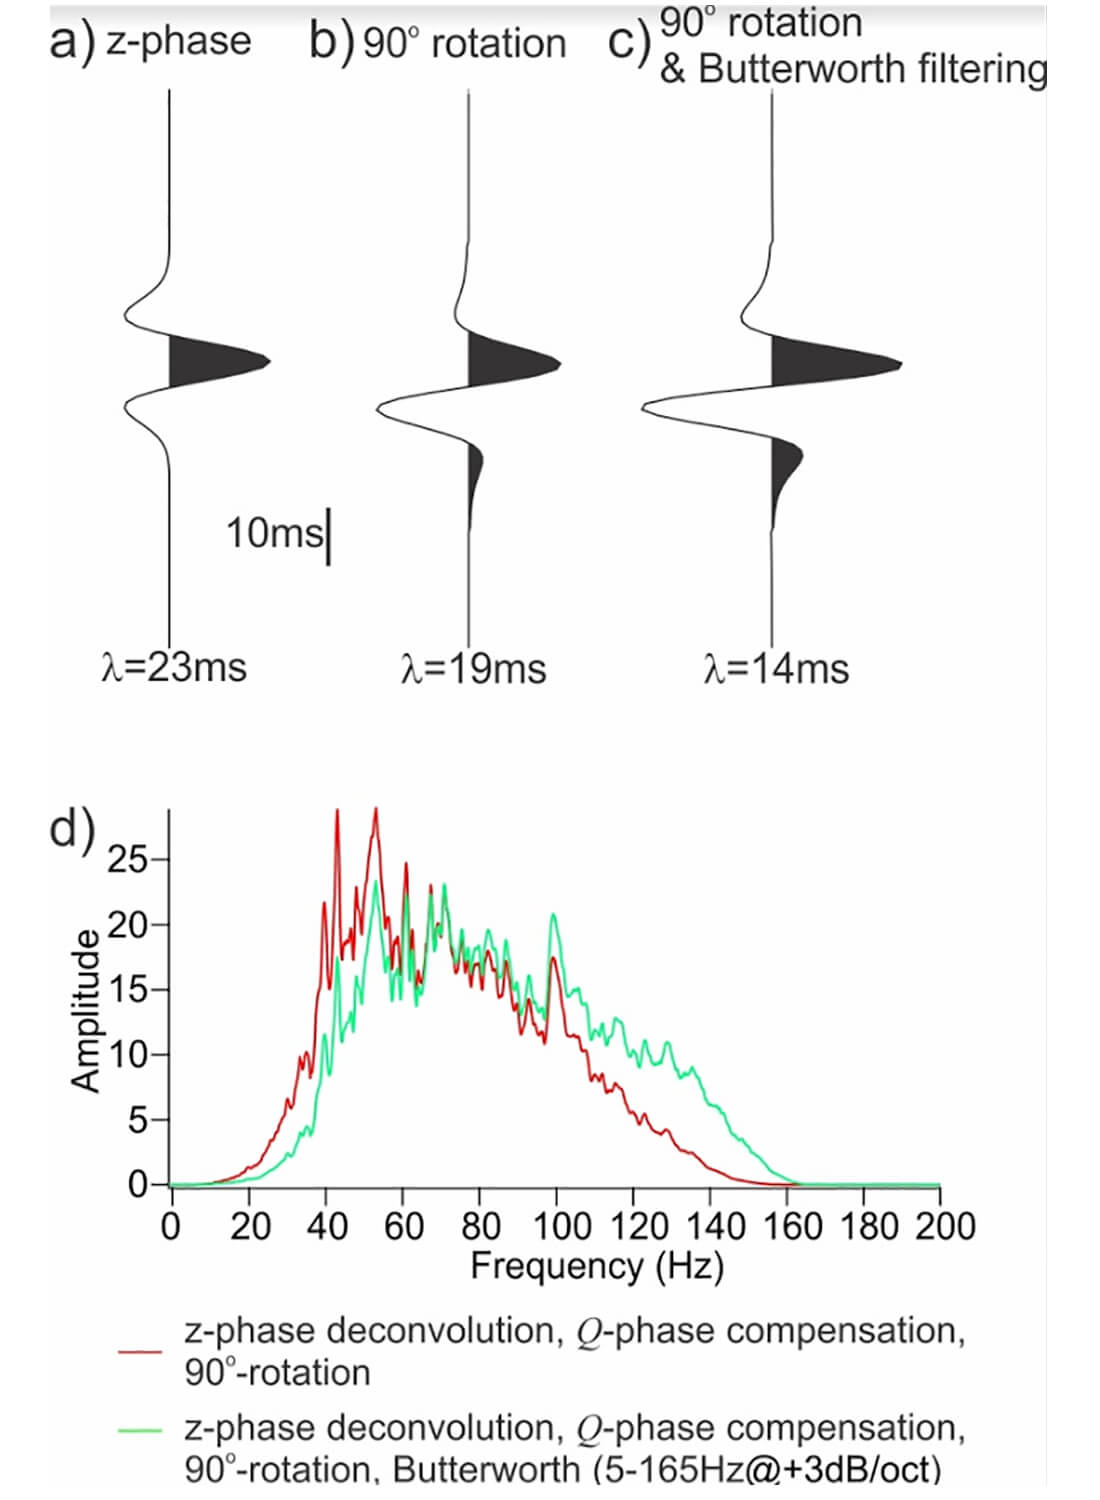
The third step is the 90°-phase rotation. The data were rotated in the frequency domain by adding a constant phase angle to every frequency sample after a Forward Fourier Transform. Typically, zero-phase wavelets are considered to portray the highest resolution since they are symmetric (Shoenberger, 1974; Krollpfeifer et al., 1988). Nevertheless, Colton and Nautiyal (1996) and Zeng and Backus (2005) demonstrated that 90o-phase wavelets are clearly better than zero-phase wavelets for thin-bed seismic interpretation. Since the problem we are trying to solve is related to thin-beds, the choice of 90°-phase wavelets becomes obvious. Another reason for choosing 90°-phase wavelets is the use of dynamite charges as a source. For impulsive seismic sources such as dynamite, the maximum energy is measured at the front of the signal and is thus minimum-phase (Ziolkowski and Bokhorst, 1993). Retrieving the true minimum-phase of the source wavelet embedded in the data is practically unattainable because of the complex and significant distortions and polarity reversals the wavelet experienced during its convolution with the subsurface reflectivity series. However, 90°-phase wavelets are closer to minimum-phase wavelets compared to zero-phase wavelets. Figure 8 shows a dynamite shot signature (a), a zero-phase wavelet (b), and the zero-phase wavelet shown in b) after a 90°-phase rotation (c). One can see that wavelength (λ) is reduced after rotation, alluding to an increase in temporal resolution. Figure 9 presents the time-interval corresponding to the Macasty Formation before and after the 90o-phase rotation. After the wavelet rotation, the center of the top Macasty marker lines up with a maximised peak amplitude. The λ is not expected to change with a rotation if the phase of the wavelet is frequency-independent. However, when the wavelet phase spectrum varies with frequency this assumption is violated (Yongcai et al., 2012). Moreover, because of thin-bed tuning, the estimation of the “true” phase before rotation is difficult to achieve (Edgar and Selvage, 2011). This is the case in the example discussed here (see Figures 6 and 7 – phase versus frequency plots).
The fourth and final step consists of the application of a bandpass time-domain recursive Butterworth filter. The poles of the filter are determined so they match as closely as possible the frequency and amplitude characteristics of the input data. For the example discussed in this paper, the filter parameters are: 5/165-Hz@+3dB/Oct. Amplitude-wise, Butterworth filters are designed to produce a flat frequency response in the passband. For the filter to be effective in its current application, the signal-to-noise ratio (S/N) of the data must be relatively high; if not, the noise energy located in the high-frequency band is increased. Since dynamite generally produces a broad spectrum having a high S/N, it makes this source a good candidate for Butterworth filtering (Driml et al., 2004). Figure 10 shows the gradual decrease in λ for a wavelet extracted at the top of the Macasty Formation marker following zero-phase deconvolution, 90° rotation and Butterworth filtering. Figure 10d shows the amplitude response at the top of the Macasty Formation pick over the entire dataset before and after the application of the low cut time-domain recursive Butterworth filter presented above. The application of the filter allowed an increase of the signal-to-noise ratio of the high-frequency content of the data. Here, in order to avoid or keep the filter ringiness to a minimum, a gentle filter slope of +3dB/Oct was used.
Implications on the seismic imaging of the Macasty Formation
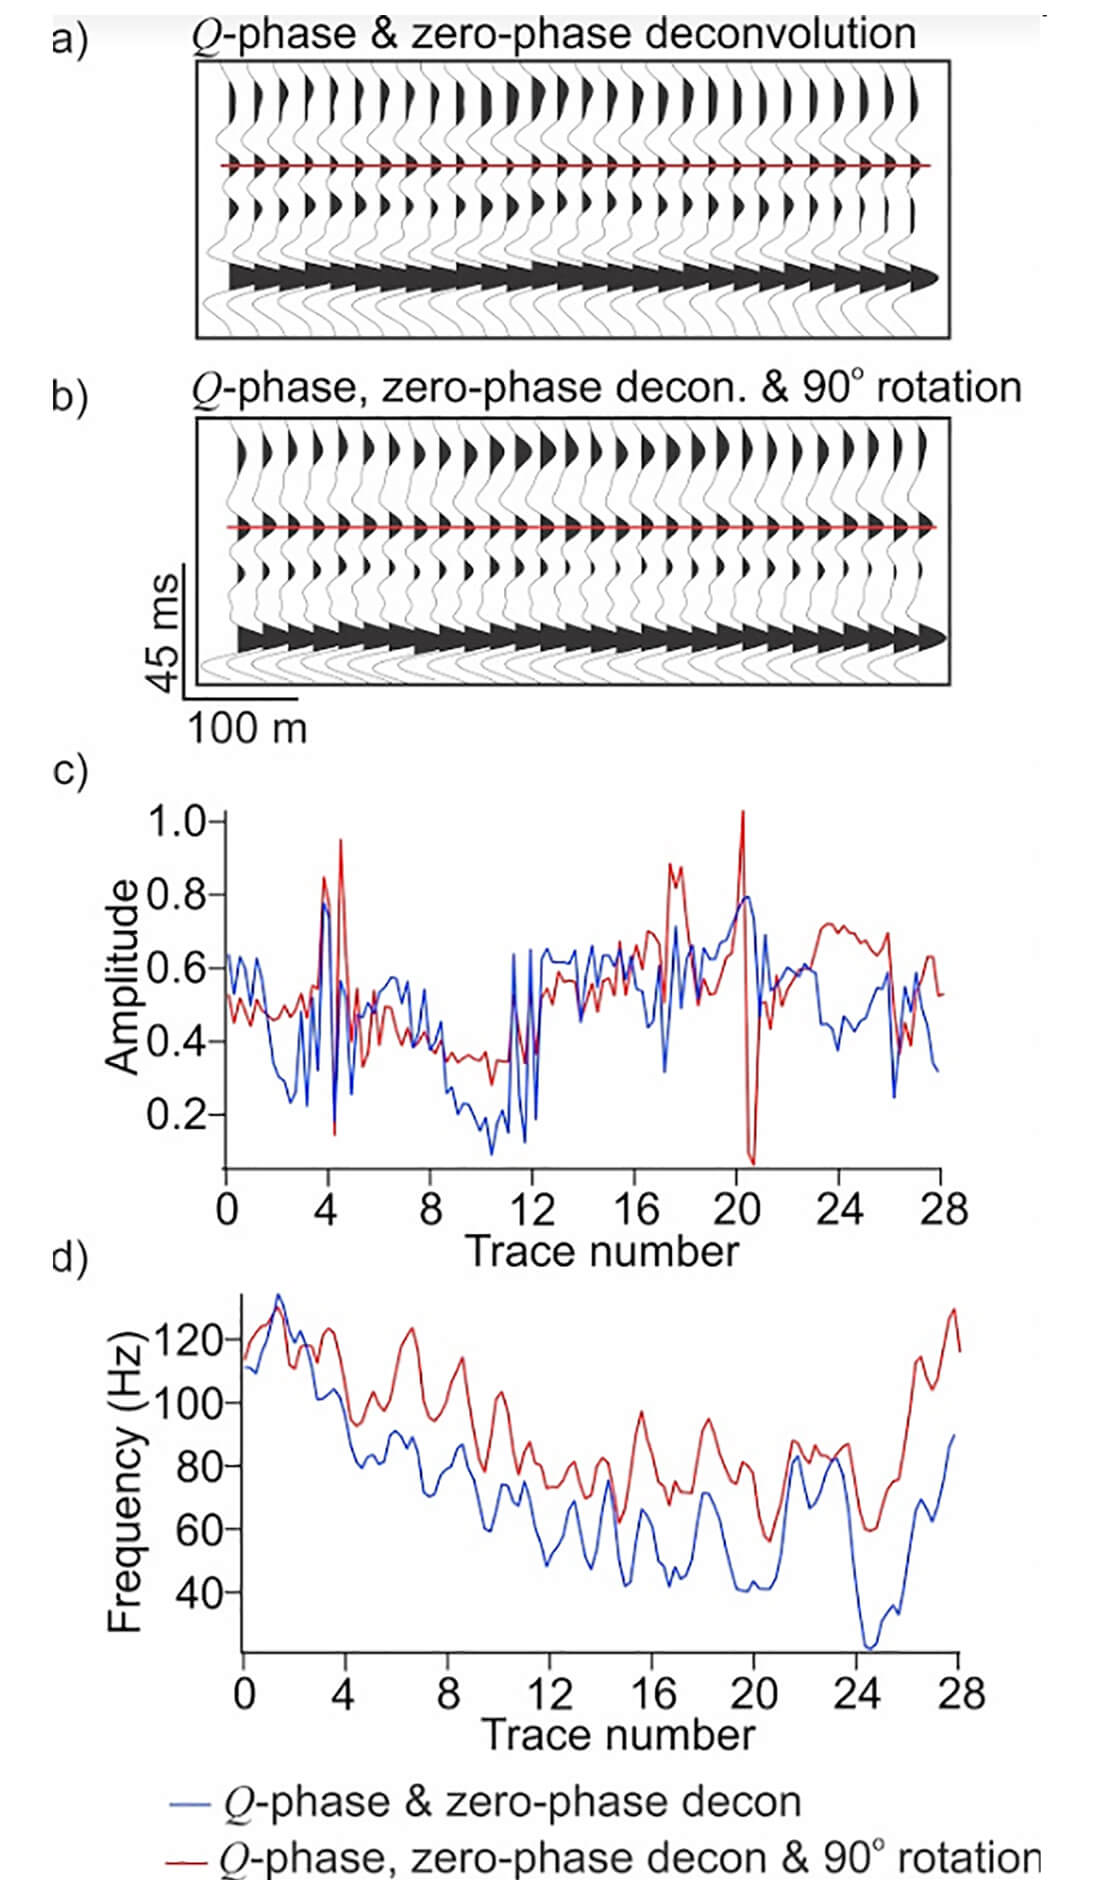
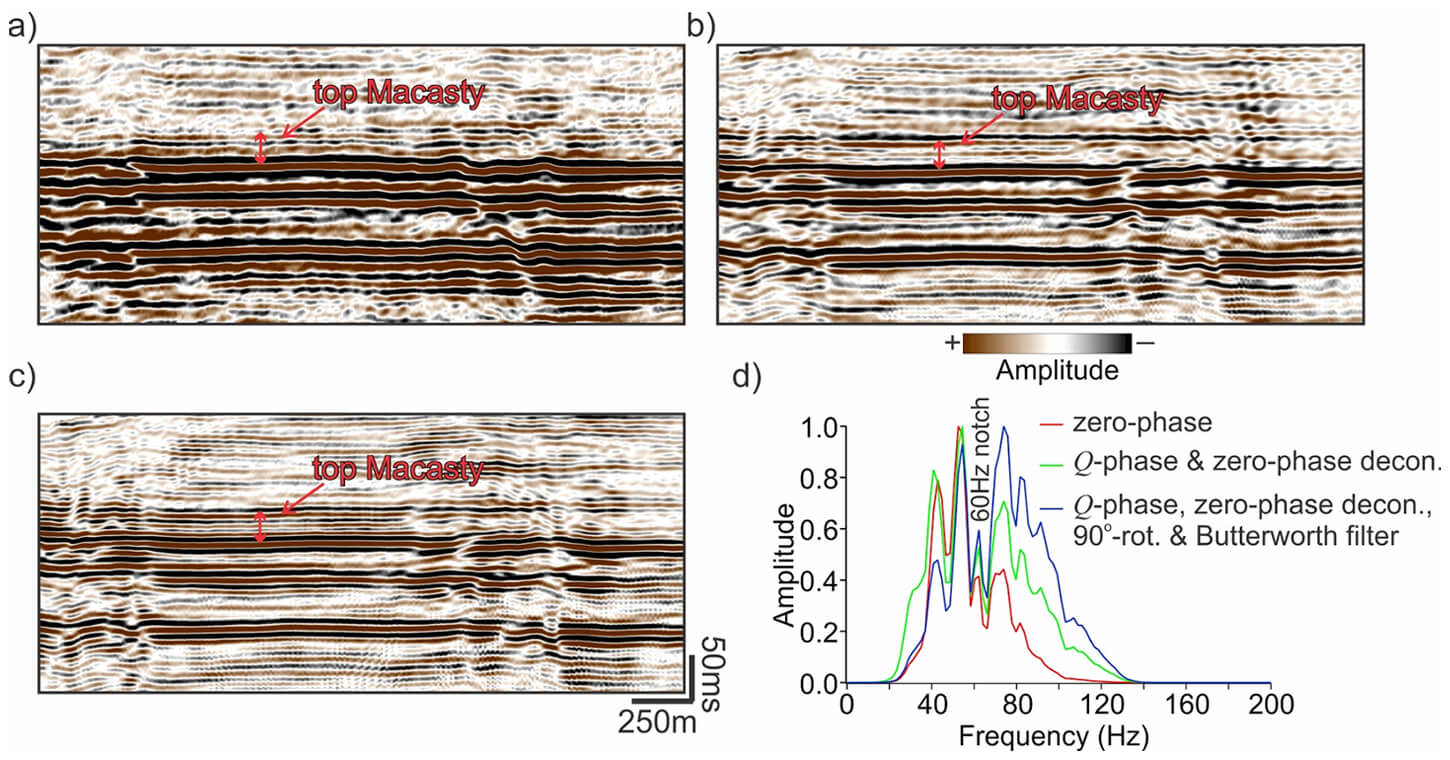
Figure 11 shows that before the application of the high-frequency recovery process, the top of the Macasty Formation was poorly imaged. Q-phase compensation followed by zero-phase deconvolution shed light on a weakly-defined internal layering, whereas the 90°-phase rotation and later application of the Butterworth filter enhanced the coherence required to adequately resolve the layering. The fully processed data possess an amplitude spectrum enriched in high frequencies that are necessary to accomplish thin-bed imaging for more confident interpretations (Figure 11).
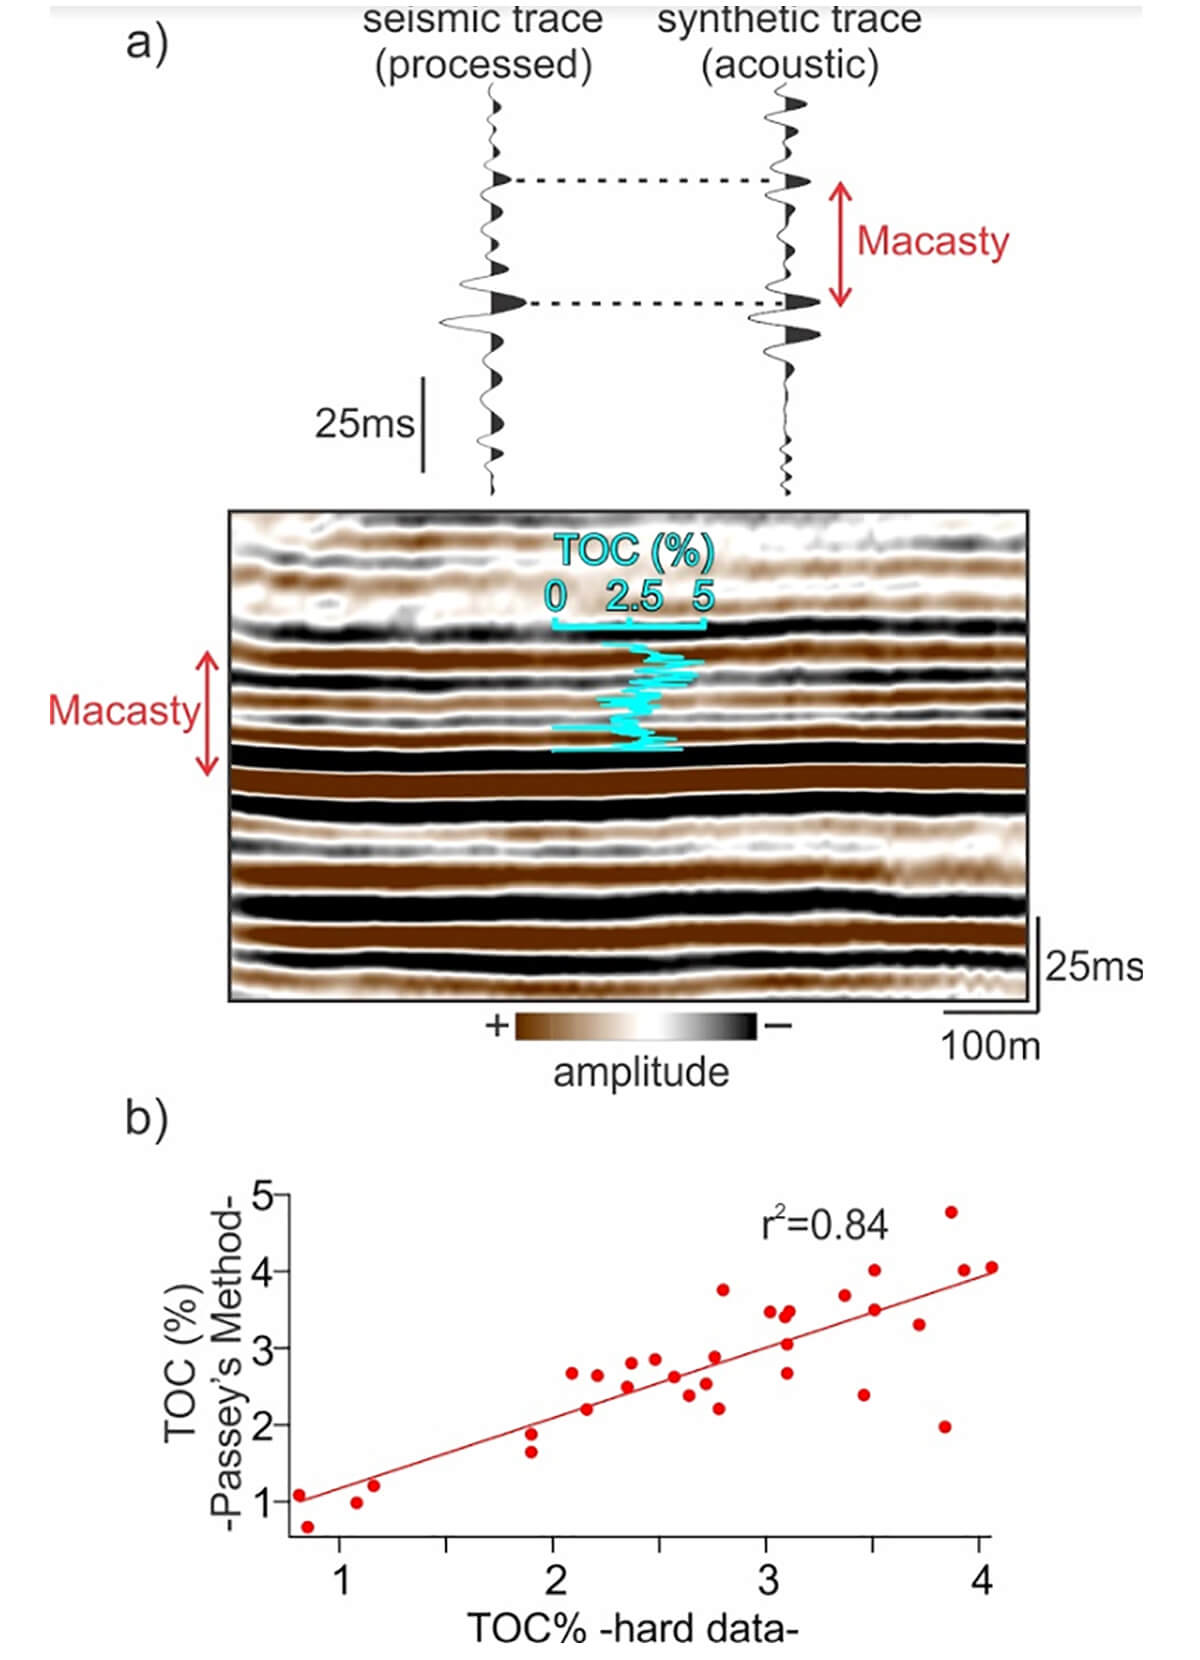
The high-resolution seismic image is tied to a well drilled 260 m away from the center of the section using a synthetic seismogram (Figure 12). Figure 12 shows that near the well location, internal reflections of the Macasty Formation are correlative to changes in seismic velocity derived from a sonic log. The seismic data are then tied to a total organic content (TOC) curve computed using the revised method of Passey et al. (1990). This method, along with resistivity and sonic logs, uses gamma-ray and density measurements to improve TOC predictions made from well logs (Wang et al., 2016). Figure 12b presents the TOC predictions made from well logs calibrated with TOC values obtained in the laboratory from Rock-Eval analysis. LØseth et al. (2011) report that higher organic content is correlative to lower acoustic impedance values. Therefore, variations in the organic richness of a shale reservoir can be tied to reflections if layers are thick enough to be seismically detected. This relationship helps to define the prospectivity of unconventional reservoirs over a greater lateral extent. Specifically for the Macasty Formation, two intervals of higher TOC values are correlative to two high amplitude reflections: one near the base of the unconventional reservoir and one at its top (Figure 12a).
Conclusions
A post-stack processing scheme has been successfully applied on 2-D seismic data to resolve a thin-layered unconventional shale reservoir hosted in the Macasty Formation, observed beneath a thick and highly attenuating limestone-dominated Silurian-Ordovician succession on Anticosti Island, Eastern Canada. The four-step method follows the procedure described in van der Baan (2012) for steps one and two, i.e. Q-phase compensation and zero-phase deconvolution. As opposed to the method of van der Baan (2012), zero-phase deconvolution is performed using a stationary operator. This is most likely valid considering the small size of the time-distance window presented in this paper. However, non-stationary operators are more suitable if the method needs to be applied on entire seismic sections, since nonstationarity significantly increases over long time windows. The 90°-phase rotation (i.e. third step) is justified by the need for thin-bed interpretation for which 90°-wavelets are well suited. 90°-wavelet rotation is reinforced by the use of a dynamite source to collect the data for which the maximum energy is located at the forefront of the impulse. The fourth and final step is the application of a low cut time-domain recursive Butterworth filter. This step permitted the increase in both the coherency and amplitude of high-frequency reflections, improving the imaging of the shale layer interfaces. The method is validated using synthetic seismograms and well logs. Finally, the improved temporal resolution opens the door to a relationship between internal reflections of the unconventional reservoir and changes in total organic content.

Acknowledgements
Oliver Kuhn (Quantec Geoscience Ltd.) is acknowledged for his thoughtful suggestions that helped to improve the manuscript. Anticosti Hydrocarbons L.P. is thanked for data access. We are grateful to Paul Durling (Corridor Resources) for sharing his knowledge of the dataset that was essential for its reprocessing. Martin Bêche (Petrolia) is also acknowledged for his insight concerning the seismic characterization of the Macasty Formation. This is GSC contribution 20190493.
Related Reading


Join the Conversation
Interested in starting, or contributing to a conversation about an article or issue of the RECORDER? Join our CSEG LinkedIn Group.
Share This Article