Abstract
Three ground-penetrating radar (GPR) surveys were conducted across frozen lakes to investigate the practicality of the method for determining the depths of lakes for Environment Canada. Traverses acquired at Lake Louise with 25 MHz, 100 MHz and 200 MHz antennae imaged the bottom of the lake very well to about 12-15 m, 8 m and 7 m, respectively. A survey at the site of the Severn Dam was less successful due to the surface conditions. The results show that GPR can be used to image lake bottoms through ice but success appears to depend on the water depth, the state of the ice and weather conditions.
Introduction
Ground-penetrating radar (GPR) is a non-invasive, environmentally safe technique for high-resolution geophysical mapping of the near-surface. It has many applications, including groundwater and mineral exploration, archaeological and forensic investigations and depth soundings through ice or water. The equipment is light and portable, consisting of transmitter and receiver antennae linked to a laptop computer by fibre-optic cables. The separation of the antennae, recording station interval, recording sample rate and length of recording time depend on the depth of the target, horizontal resolution required and the input pulse frequency.
The source for GPR data is a high-frequency (10-1000 MHz) electromagnetic pulse which is transmitted into the ground at regular intervals along a survey line. This pulse is reflected back to the surface at subsurface boundaries where electrical properties change. The total traveltime for reflected from such a boundary depends on the velocity of the electromagnetic waves in the medium, while the strength of the reflected signal depends on the contrast in dielectric constants across the reflecting boundary. Common causes of strong GPR reflections are material interfaces such as overburden/bedrock, sand/clay and the water table, all which have a large contrast in dielectric constant. Electrical properties of materials are controlled primarily by their composition and are very sensitive to water content. Table 1 (after Davis and Annan, 1989) lists the typical dielectric constant (k), electrical conductivity (s), velocity (v) and attenuation (a) found in common near-surface materials.
| Material | k | s (mS/m) | V (m/ns) | a (dB/m) |
|---|---|---|---|---|
| Table 1 Typical electrical properties of near-surface materials. | ||||
| Air | 1 | 0 | 0.33 | 0 |
| Fresh water | 80 | 0.5 | 0.033 | 0.1 |
| Salt water | 80 | 3x10⁴ | 0.01 | 103 |
| Ice | 3-4 | 0.01 | 0.16 | 0.01 |
| Dry sand | 3-5 | 0.01 | 0.15 | 0.01 |
| Saturated sand | 20-30 | 0.1-1.0 | 0.06 | 0.03-0.3 |
| Silts | 5-30 | 1-100 | 0.07 | 1-100 |
| Clays | 5-40 | 2-1000 | 0.06 | 1-300 |
| Limestone | 4-8 | 0.5-2 | 0.12 | 0.4-1 |
The depth of penetration of the radar energy depends on the conductivity of the medium and the input frequency. In low conductivity materials such as sands, gravels and bedrock, GPR can sound to depths of 50 m. This may decrease to only a few meters in highly conductive, attenuative materials such as clays, silts and soils with saline water. In general, GPR works well to a depth of about 25 m. Under the same conditions, a lower frequency pulse will have greater depth penetration than a higher frequency pulse but at the expense of vertical resolution. Good examples of frequency comparisons can be found in Jol, 1995.
Davis and Annan (1990) show an example of bedrock mapping beneath an ice-covered lake. They used an input frequency of 12.5 MHz and a station interval of 2 m and achieved resolution to about 20 m. Moorman and Michel (1997) imaged through ice-covered Arctic lakes with water depths up to 19 m with a 100 MHz antenna and Moorman has delineated lake bottoms as deep as 25 m with a 25 MHz antenna (Moorman, pers. comm.). Although fresh water has relatively low attenuation, the presence of suspended sediments in the water will increase attenuation, causing a reduction in depth penetration.
The recorded GPR data are processed using seismic data processing techniques and are presented as records with arrival time in nanoseconds (ns) plotted vertically against surface position. GPR data can be converted to depth if velocities are known. Signal-enhancement techniques may be used on the data, which a re highly susceptible to noise from surface reflectors such as trees and man-made objects, particularly metallic ones. The first arrival at the receiver is the direct airwave, on which the data are flattened. The GPR records are interpreted by analysis of the continuity of reflected events and vertical and lateral changes in reflectivity.
GPR Surveys at Lake Louise
Two surveys were conducted at Lake Louise, three years apart, by personnel from the Department of Geology and Geophysics at the University of Calgary and from Environment Canada, using equipment belonging to the Geology and Geophysics and Geography departments. The objective was to test the practical applicability of the GPR method for measuring lake depths. Environment Canada was looking for an alternative way to their usual method of hauling boats up hiking trails then measuring lake depths by dropping lead-weighted soundings over the side of a boat bobbing about on the water.
| Survey | Distance from Shore | Station Spacing | Surface Conditions |
|---|---|---|---|
| Table 2 Acquisition details for the first experimental lines at Lake Louise. | |||
| A | 0 – 22 m | 0.5 m | Loose snow, average 0.5 m depth |
| B | 13.8 – 25.1 m | 0.1 m | Packed snow |
| C | 21 – 67 m | 1 m | Loose snow, average 0.3 m depth |
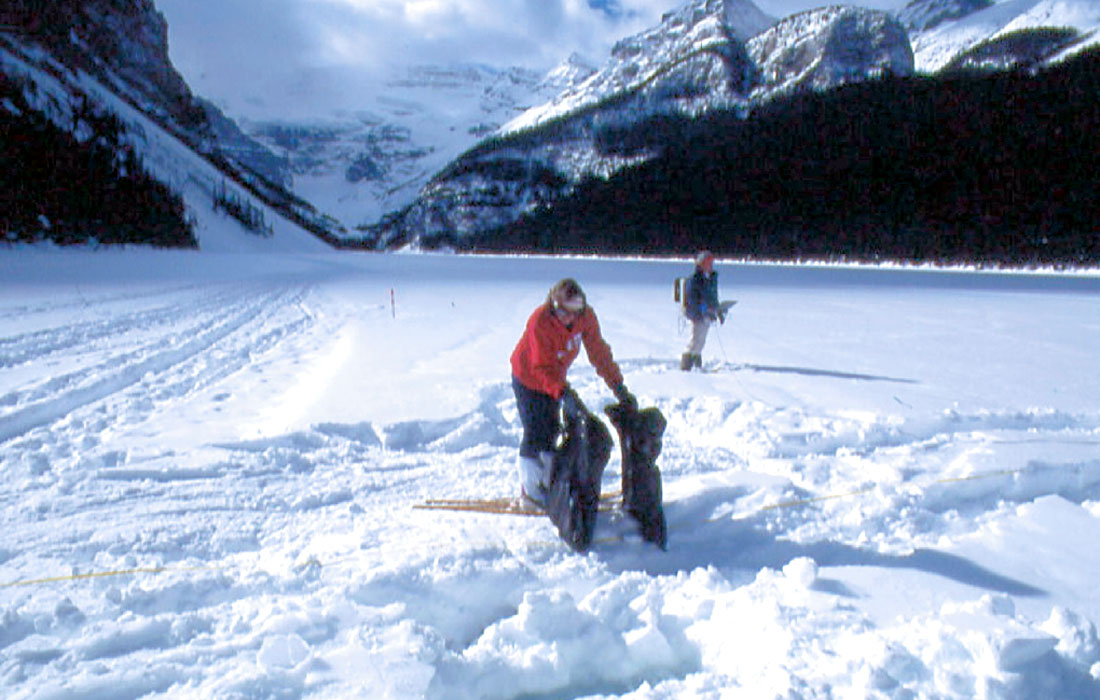
In the first experimental survey, three lines of data were recorded in different surface conditions across snow-covered ice close to the eastern shore of Lake Louise (the Chateau end). The acquisition parameters for the three lines, A, B and C, are summarised in Table 2. For each line the source frequency was 200 MHz, generated by a 400 V transmitter, and the antenna separation was 0.5 m. There was snow up to 0.6 m deep over most of the survey area but line B was recorded over a small area of very well packed snow. The GPR equipment was protected from the snow by placing it in large black garbage bags and the field personnel had to wear snowshoes to get through the snow (Figure 1).
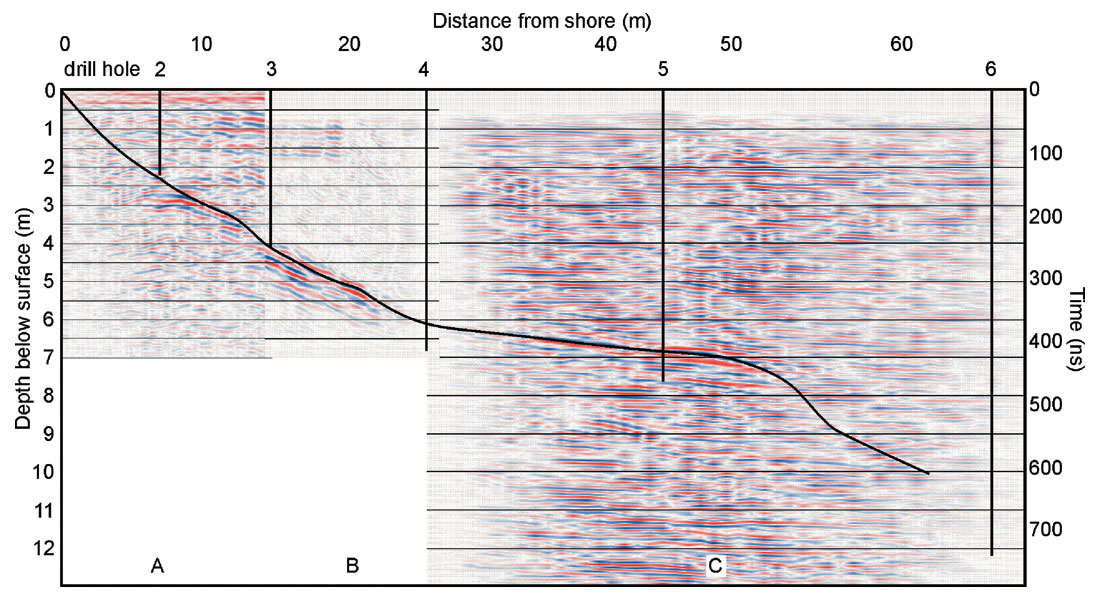
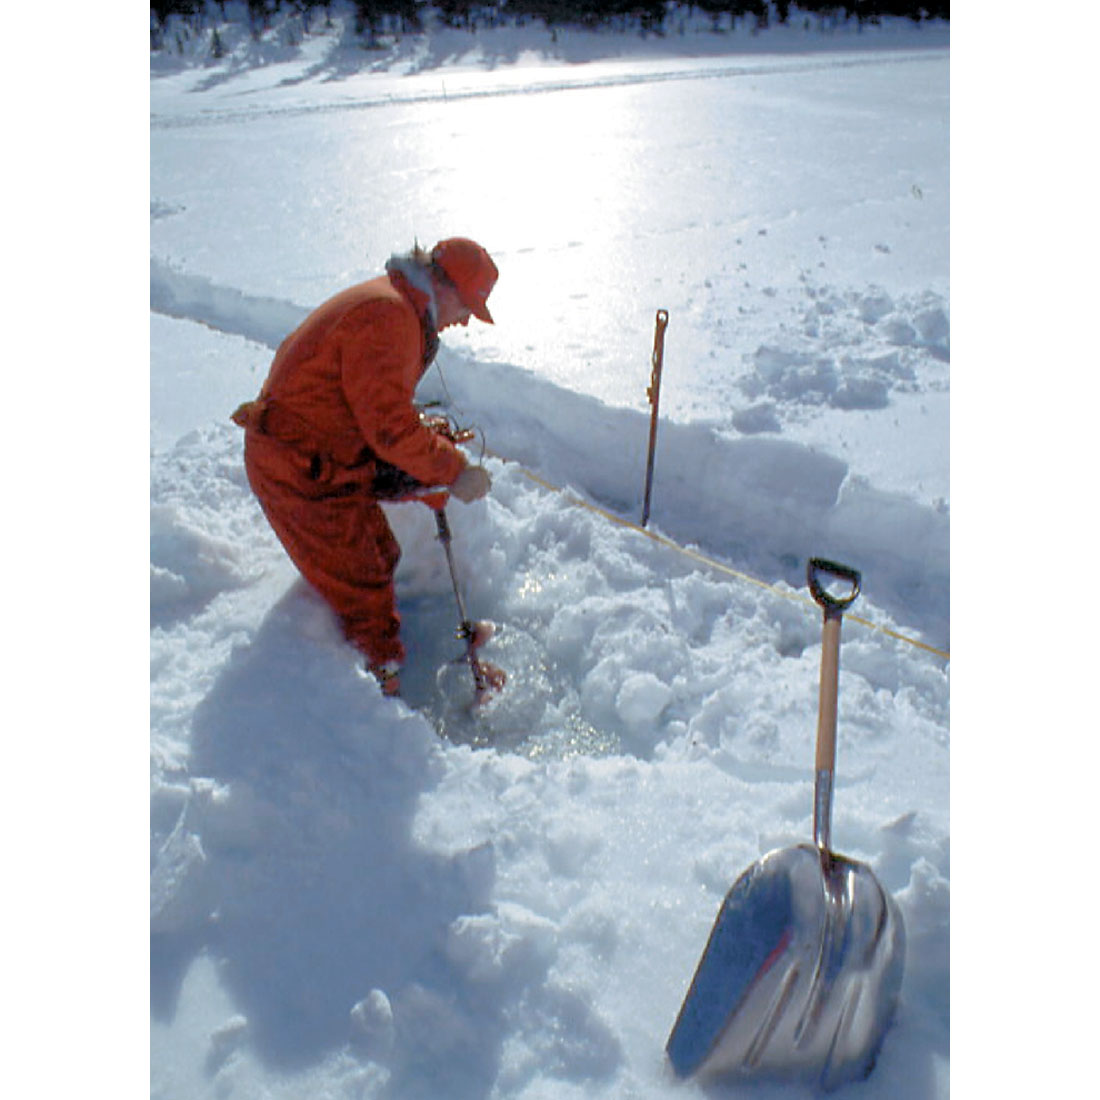
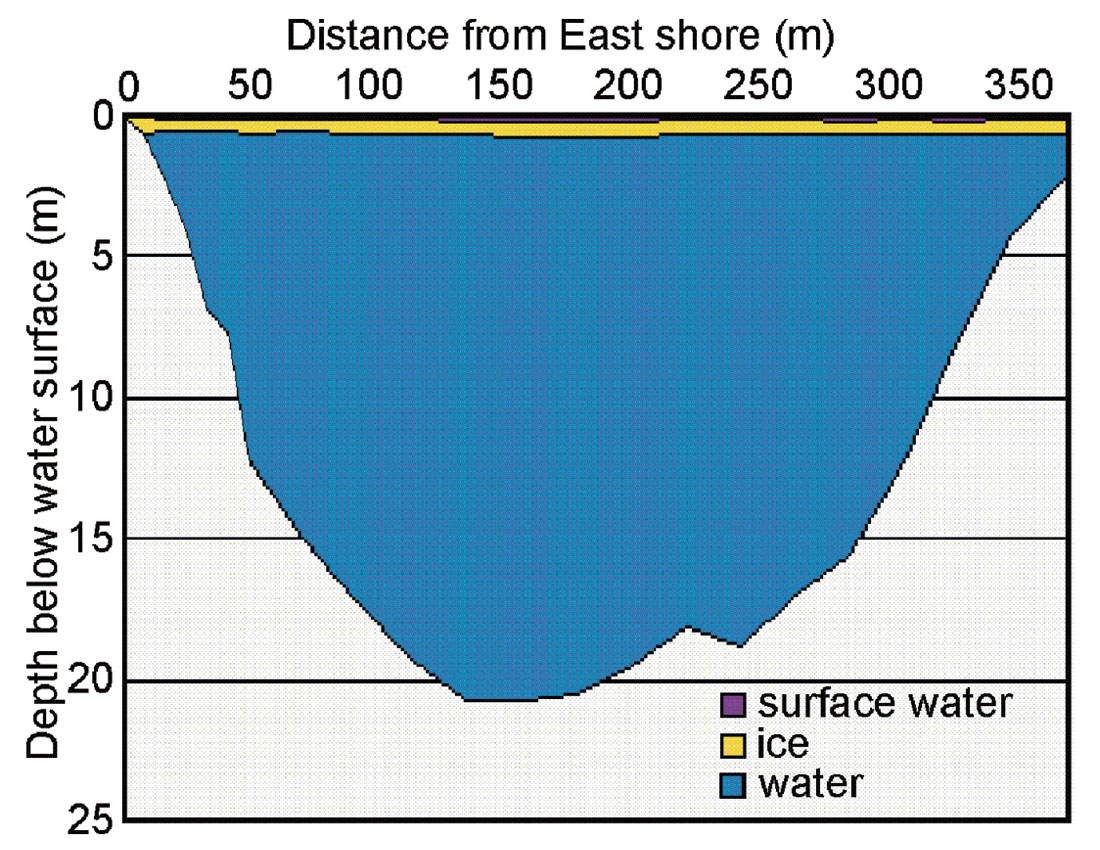
The three lines were processed using seismic data processing techniques under the assumption that the data represented zero-offset traces. The lines were processed to flatten the airwave, mute early arrivals and enhance dipping reflections. They were then migrated and converted to depth using a velocity of 0.033 m/ns. The bottom of the lake was imaged well to a depth of about 7 m. Figure 2 shows a composite of the three processed lines with the interpreted lake bottom and the calibration drill holes, which Environment Canada personnel drilled through the ice (Figure 3) to determine the depth of the snow cover above the surface water, depth of surface water, ice thickness and lake depth. The measured ice thickness was fairly consistent (near 0.5 m) while the lake was as deep as 20.73 m (Figure 4). The imaged lake depths on lines A and B correspond well with the measured depths while line C appears to image the lake bottom a little shallower than measured by the drill holes. The reflections interpreted as lake bottom on the GPR might represent a layer of sediments at the bottom of the lake which the lead weight penetrates to reach bedrock.
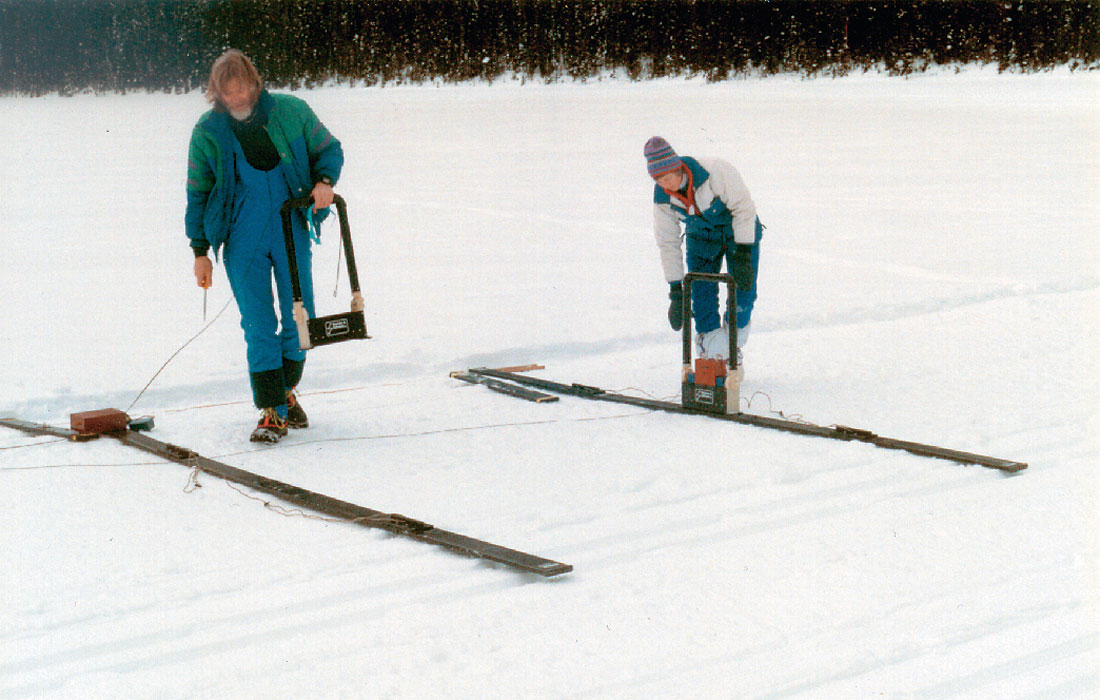
Prompted by the encouraging results of the first surveys and the continued interest shown by Environment Canada in the potential applicability of GPR to depth sounding of relatively inaccessible lakes, a further survey was undertaken three years later. Since the 200 MHz survey in 1995 did not produce adequate depth penetration, two lower frequency antennae, 100 MHz and 25 MHz, and a 1000 V transmitter were employed for this survey. High frequency antennae are more portable and result in increased resolution of thin beds but at the expense of depth penetration. Lower frequency antennae give better depth penetration but provide lower resolution and are harder to manipulate. The length of the 100 MHz antenna is about 1 m and that of the 25 MHz antenna about 4 m. Figure 5 shows the 25 MHz antennae being assembled.
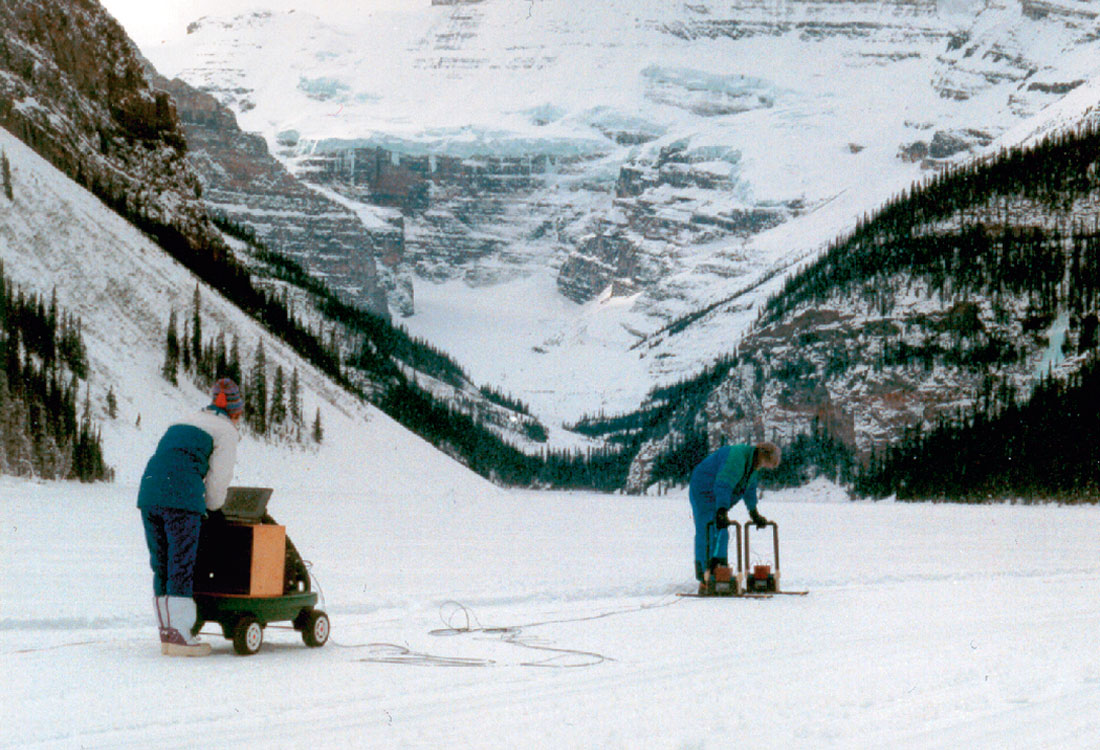
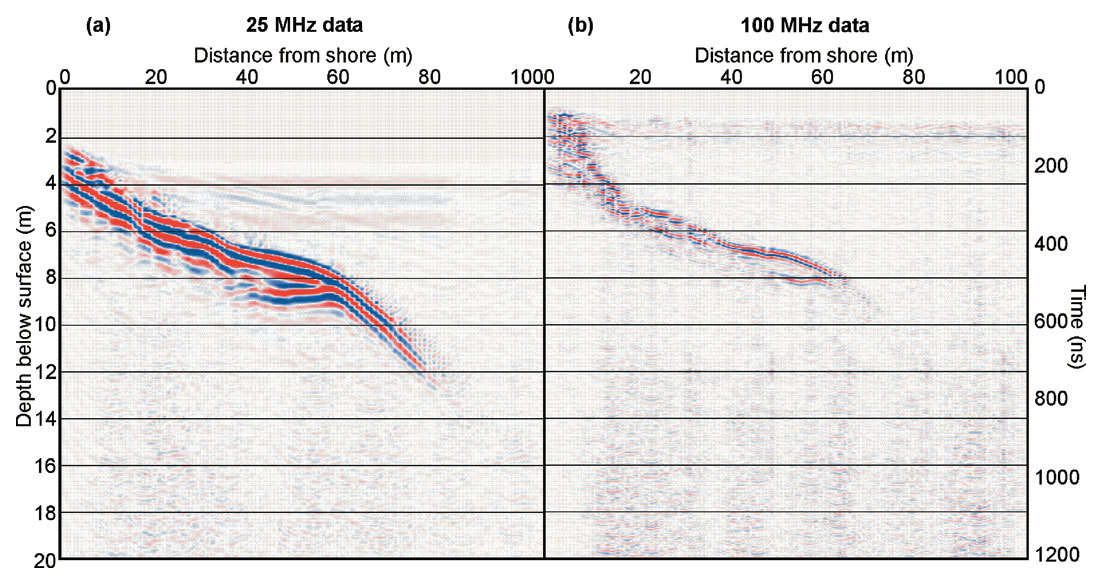
This second survey was conducted over a part of the lake where the snow had been packed down for cross-country skiing, leaving a large area for moving the somewhat unwieldy 25 MHz antennae and allowing the recording equipment to be placed on a plastic trolley for wheeling across the lake (Figure 6). The station spacing in both cases was 1 m while the antenna separation was 1 m for the 100 MHz data and 3 m for the 25 MHz data, which were recorded over the same 200 m long traverse. Data were recorded to 1500 ns but no water bottom reflections were seen later than about 800 ns. The lines were processed to position the traces in their correct location along the traverse, to flatten the airwave to time zero and to mute out the high amplitude ringing. They were time migrated and converted to depth using a constant velocity of 0.033 m/ns. On the 25 MHz data (Figure 7a), there is high amplitude reflected energy down to a time of 700 ns and much weaker energy to 950 ns, showing an effective depth penetration of 12 m. The 100 MHz data (Figure 7b) have good reflections to 500 ns and weaker reflections to 600 ns for an effective depth penetration of 8 m.
These records demonstrate that a full survey across the deepest part Lake Louise would not image the bottom (about 70 or 80 m deep), as it is far below the depth penetration of the GPR, even with the lowest frequency transmitter. However, GPR surveys of lakes 3-15 m deep should provide good profiles of the lake bottom. The quality of the data from this second survey at Lake Louise is superior to that of the first survey. The larger voltage transmitter sent a stronger signal through the water and the packed snow made conditions better for contact between the antennae and the snow. It was also much easier to move the equipment over the packed snow than through snow up to 0.6 m deep.
Survey at Severn Dam
A further GPR survey was undertaken at the Severn Dam site, near Rockyford, Alberta. Test holes drilled through the ice the previous week indicated an ice thickness of about 0.5 m over the lake and water depth varying from about 3 m to almost 6 m. Conditions on the day of the survey were not pleasant. Thick mud on the trail down to the lake adhered to the wheels of the trolley and to the boots of the field personnel. The surface of the lake was covered with about 10 cm of unevenly trodden wet s now, which hampered pulling the trolley and provided poor contact for the antennae. There were also many holes drilled through the ice by fishermen.
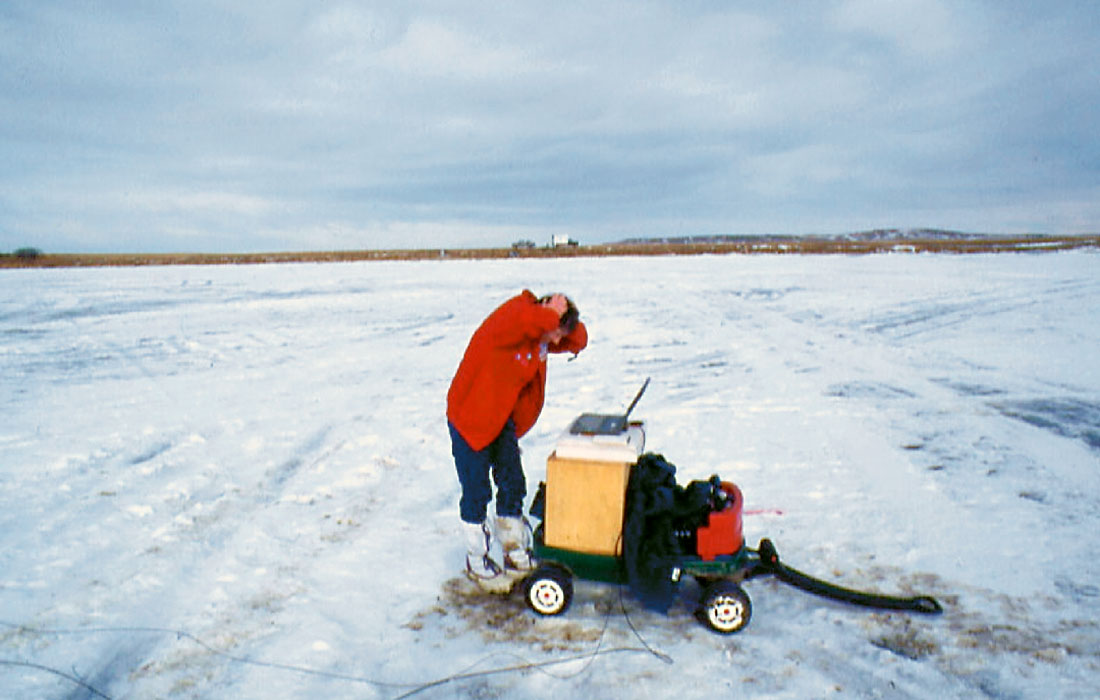
One line was acquired before equipment problems terminated the survey. This line was surveyed by Environment Canada personnel with GPS equipment. Loose connections in the fibre - optic cables caused abandonment of the other planned lines (Figure 8). The source was a 100 MHz antenna with a 1000 V transmitter. Station spacing was 1 m over a traverse 200 m long and antenna separation was 0.5 m. The raw data were extremely noisy, with no obvious water bottom, as had been the case even on the raw data at Lake Louise. Sources of noise and dispersion could be a metallic conduit observed at the side of the lake, about 20 m away, and the many holes drilled through the ice by fishermen. Data processing included bandpass filtering, flattening the airwave at time zero, a gain function to enhance later arrivals, muting the early arrivals, predictive deconvolution, a 2-D spatial filter to reduce the noise, migration and depth conversion. A drill hole at 50 m measured the 0.47 m of ice and a water depth of 5.57 m. To correlate better an event interpreted to be the water bottom, the data were depth converted using a velocity of 0.05 m/ns, which is much higher than that of fresh water but not unrealistic for a heavily sediment-laden lake. Figure 9 shows the processed line with the interpreted lake bottom annotated in white and the location of the drill hole. Without the drill hole data to calibrate the depth, the section would have been depth converted with an incorrect velocity.
Discussion
The results of the surveys at Lake Louise were encouraging while those at the Severn Dam were less so. The many holes drilled through the ice by fishermen might have caused dispersion of the signal and created sources of interference. The method can be expected to work well for lakes of depths 3 m to 12 m, although the 25 MHz antennae, which provide deeper imaging, are very large and rather hard to manoeuvre. If snow lies over the top of the ice it is advisable to pack it down first with snowshoes to make the logistics easier and to provide a firm, even base for the antennae. Weather conditions will affect the operation of the computer batteries, which tend to fail after a time exposed to the cold, as do the field personnel, whose level of cooperation and attention to detail are directly proportional to the temperature.

Acknowledgements
The authors would like to thank Environment Canada for support of this project and for the logistical arrangements. Thanks also to their personnel, who drilled holes through the ice at Lake Louise and Severn Dam. Malcolm Bertram of the Department of Geology and Geophysics provided field support for all of the surveys. Darryl Parry operated the equipment for the first survey at Lake Louise and Alasdair Fergusson took the photographs. Thanks also to Drs. Don Lawton and Derald Smith for the loan of University of Calgary equipment.


Join the Conversation
Interested in starting, or contributing to a conversation about an article or issue of the RECORDER? Join our CSEG LinkedIn Group.
Share This Article