Introduction
Demand for energy is growing rapidly, causing worldwide concerns over security of supply. Petroleum systems modeling in 4 dimensions (space + time) predicts the generation, migration, and quality/quantity of accumulated hydrocarbons, incorporating temperature and pressure calculations through the entire evolution of the basin. A Petroleum Systems Model thus provides the only means to combine all essential elements (source, reservoir, seal and overburden) and processes (relative timing of trap formation, charge, critical moment, preservation time) to analyze the petroleum system and to reduce the exploration risk.
Many of these geological processes can be described with surprisingly simple equations and can even be calculated manually for one cell, but not for the millions of cells that form an entire basin including the mutual effects of neighboring cells throughout time. Therefore the numerical basin modeling approach is needed, which provides a reasonably fast and inexpensive resource assessment and is nowadays a sophisticated method to analyze how a petroleum system works, not only in areas of exploration but also in frontier basins to reconstruct detailed filling histories for a single oil field and combine the results with reservoir modeling or to make a prediction of where to drill.
Basin Modeling
The present studies show a general workflow, starting with an analysis of the rift processes and their impact on the heat flow history, going onwards to the petroleum system, and ending with a short migration and accumulation analysis. Two study areas are introduced, first the Jeanne d’Arc (JdA) basin located 300 km offshore Newfoundland on the Grand Banks and then the Carson basin adjacent to the Jeanne d’Arc basin to the South-East. In this particular study we used the PetroFlow 3D® license of the commercial basin analysis software PetroMod®10, developed by IES-Schlumberger in Aachen, Germany. The software enables the user to perform fourdimensional (4D), semi-automatic rift and heat flow analysis with a fully PVT-controlled, n-component, 3-phase, hybrid petroleum migration method (Darcy and Flowpath at the same time) (Hantschel and Kauerauf, 2009). The time framework which controls the calculation steps is given by the deposition and erosion ages of the strata represented in the input model via structural depth maps. These ages are the basis for a past-to-present deterministic forward-modeling technique, which is applied to simulate step-by-step from the oldest event up to present-day geometry (Welte et al., 1997). All petrophysical or geochemical properties, which must be assigned to the layers (space between maps) according to their lithology (thickness between horizons, which determine discrete time steps) can be taken from PetroMod® internal data bases, which also provide kinetic data such as PhaseKinetics (di Primio and Horsfield, 2006) and fluid properties. After calibration the simulation results can finally be used to predict the following.
Geology (JdA)
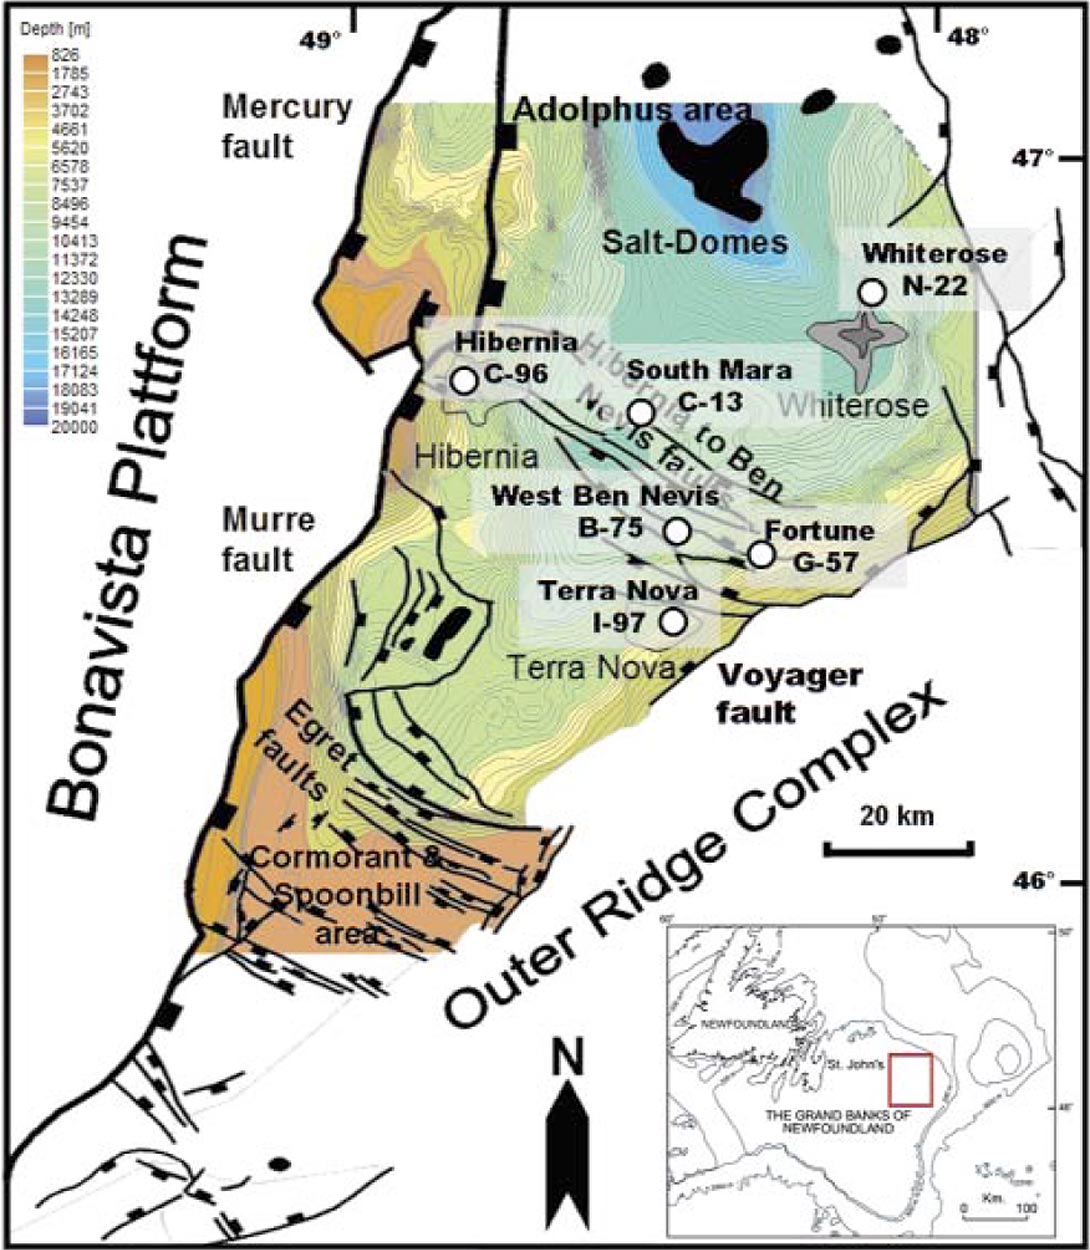
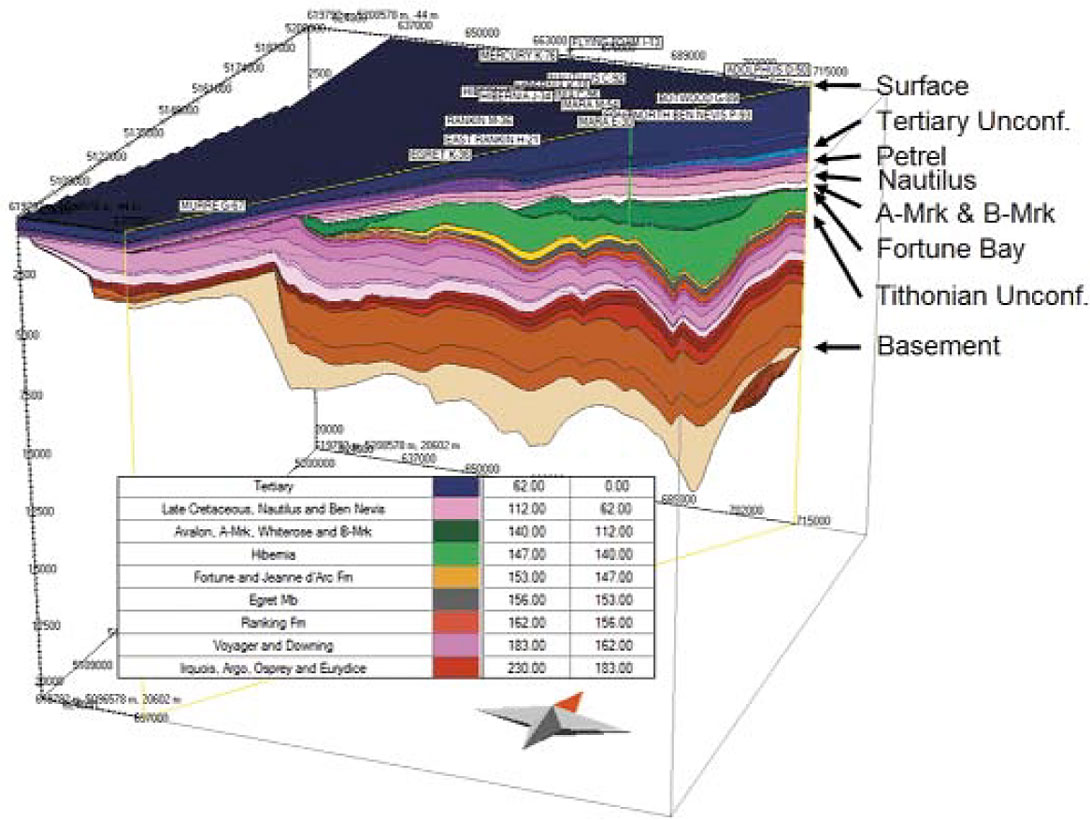
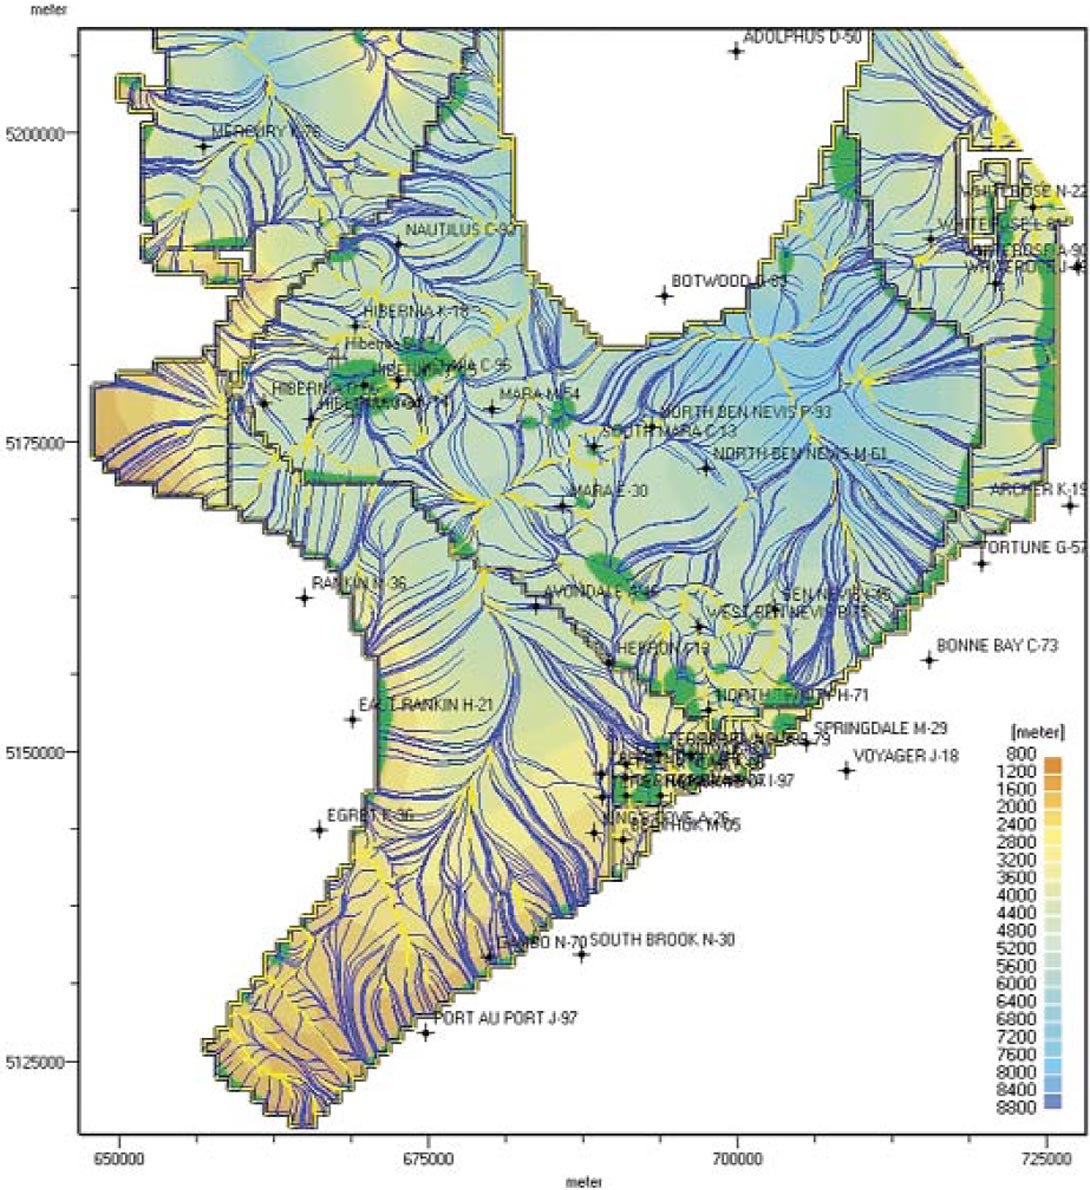
The numerical model of the Jeanne d’Arc basin covers an area of around 9000 km2 and extends from the Adolphus well area in the north to the Cormorant and Murre well area in the south and from the eastern limiting Outer Ridge Complex to the westerly located Bonavista Platform (Figure 1). Endogenic geodynamic processes formed a deep v-shaped basin that opens and plunges to the north and is filled with sediments to a depth of over 22 km. The initial grid size of the model is 250x250 m but was simulated with a 4x4 sampling (thus grid size = 1000x1000m) with respect to simulation time. The model is built based on 9 initial maps namely the Seabed, Base Tertiary, Petrel Member, Nautilus (base of Upper Cretaceous), A-Marker, B-Marker, Top of Fortune Bay (base of Lower Cretaceous), Tithonian Unconformity and Top of Basement (Figure 2). The resulting 9 initial layers are further subdivided into subunits to adjust the model to the known stratigraphy and to be able to take into account the lateral facies variations. Additionally some extra features are implemented into the model, e.g. salt movement between 140 and 90 Ma in the form of a piercing salt lithology, which replaces the corresponding volumes of rock. Intrusions are integrated to consider the basaltic parts in the Argo Formation, intruded around 196 Ma. Finally, paleo-geometries are assigned to avoid a distorted paleoshape of the layers close to the Egret fault system between 130 and 170 Ma.
Geodynamic (JdA)
Thermal boundary conditions have to be elaborated based on known geological processes and have to be assigned through geological time for the numerical model’s top and base. The corresponding parameters are the heat flow (HF) at the base of the model and the temperature at the top of the sediment succession, whether they are covered by water or uplifted above the sea level. The latter parameter is called the “sediment water interface temperature” (SWIT) and is determined by considering the global temperature distribution through geological time in combination with the corresponding latitude of the North American plate for each time step. The obtained surface temperature through time is then corrected for the paleo-water-depth or paleo-rise above sea level based on a standard temperature depth profile (Wygrala, 1989). The paleo-water-depth can be derived from the facies descriptions taken from well core descriptions.
More complex is the reconstruction of the heat flow history through time, because it depends on the geodynamic situation, on the development of the crust thickness, thus on rifting and cooling processes. To address the crustal development of the basin the 4D numerical basin model has to reach all the way down to the crystalline basement. Additionally one needs deep reflection or refraction seismic to quantify the total present-day crustal thickness and some extra parameters about the crust and the asthenosphere as well as the age of the rift event. These data are summarized in Table 1. The simulation technique applied to the Jeanne d’Arc basin uses a discontinuous depth dependent stretching model with two different stretching factors, one for the crust (beta) and one for the lithospheric mantle (gamma).
| Table 1: Rift-ages and physical properties for crust and lithosphere |
|
|---|---|
| Rifting from [Ma] | 230 |
| Rifting to [Ma] | 220 |
| Subsidence from [Ma] | 220 |
| Subsidence to [Ma] | 0 |
| Expansion coefficient [K-1] | 3.3e-5 crust; 5e-5 mantle |
| Conductivity [W/m/K] | 3.1 |
| Diffusivity [m2/s] | 0.804e-6 crust; 6e-6 mantle |
| Base Lithosphere Temperature [degree Centigrade] |
1333°C |
| Density for Water [kg/m3] | 1040 |
| Density for Crust [kg/m3] | 2800 |
| Density for Lithospheric Mantle [kg/m3] | 3300 |
| Initial Thickness Crust [km] | ~ 42 |
| Present Day Thickness Crust [km] | ~ 35.5 |
| Thickness Lithospheric Mantle [km] | 95 |
| Radioactive Heat Production* [μW/m3] | 2.5 |
| Half Depth Value* [m] | 7000 |
| * = value used for the 3D model only. Radioactive heat production for 1D models are integrated via the lithology. | |
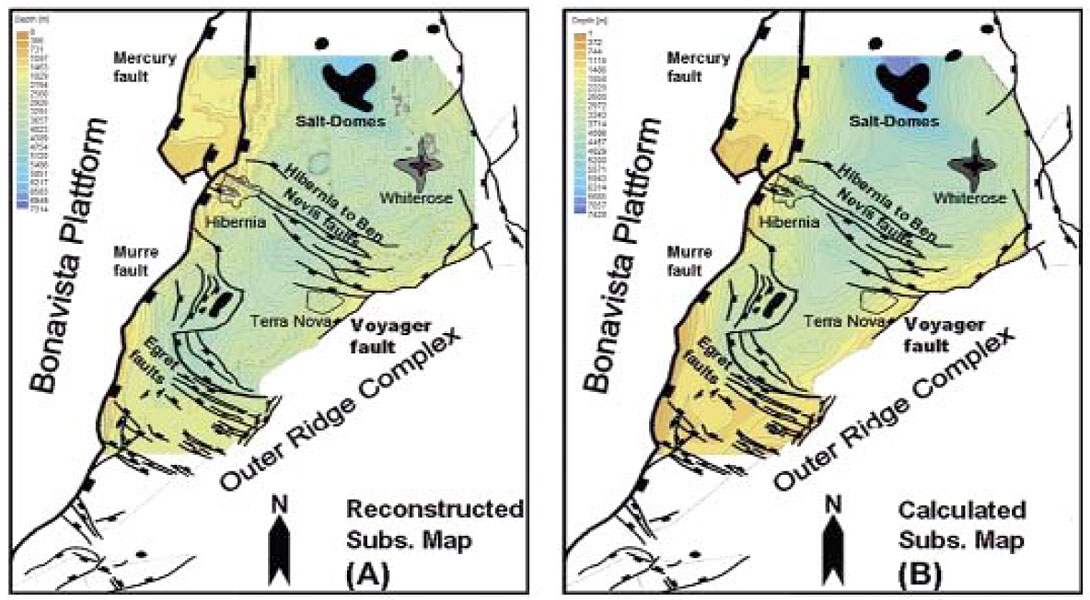
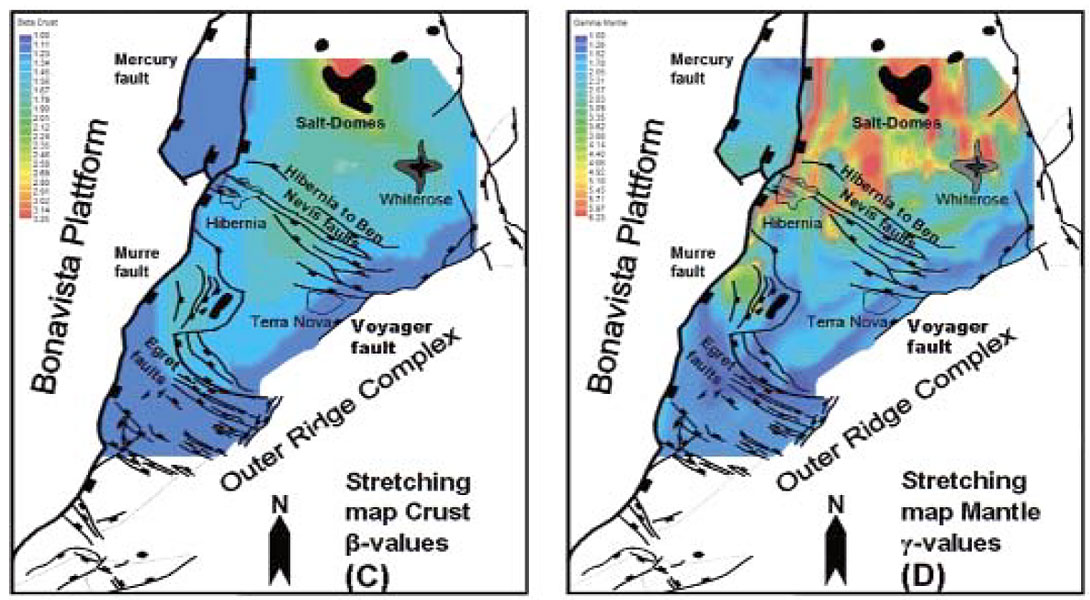
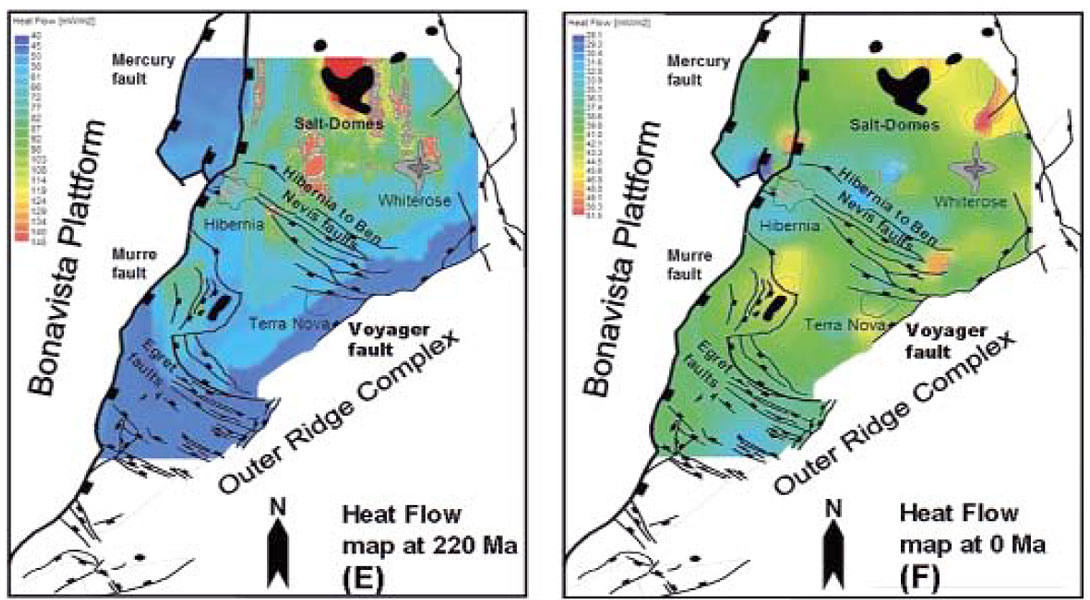
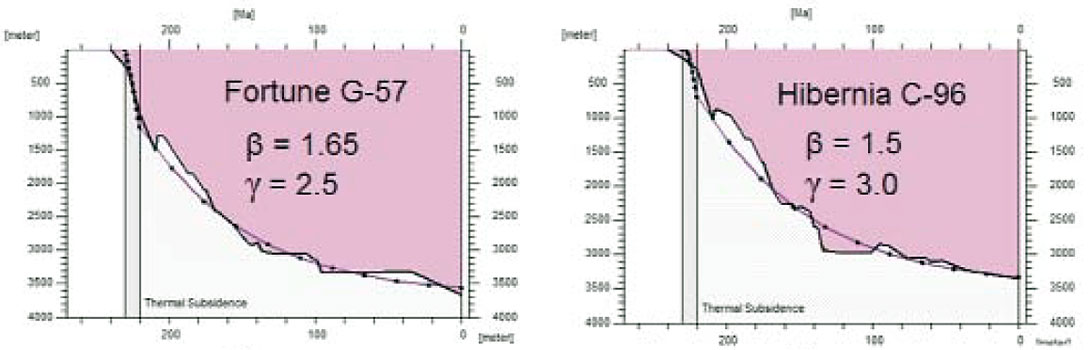
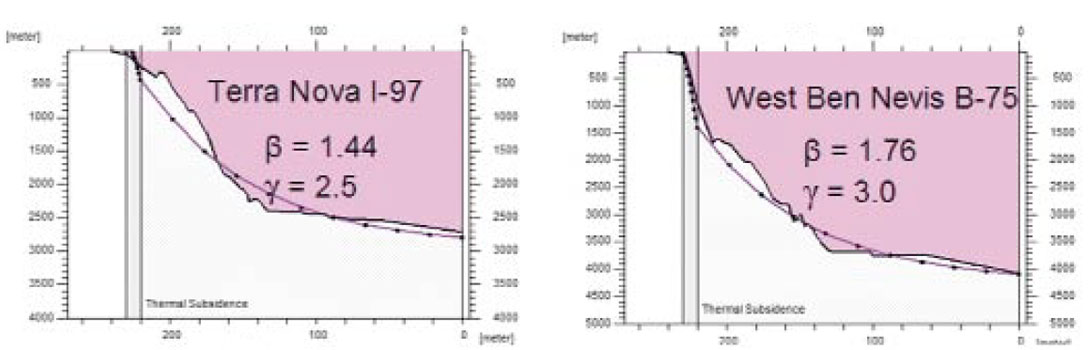
Now an inverse McKenzie modeling approach is applied, which means that based on the known burial history (compiled from thickness maps and their deposition ages) the subsidence is reconstructed for each location in the basin by backstripping and decompacting the sediments. This is the so called “reconstructed subsidence” (Figure 3A). In a second step, different stretching factors for each position are tested to determine the “calculated subsidence” (Figure 3B). This calculated subsidence has to match the reconstructed subsidence of the basin model for each location. The adjustment of the calculated to the reconstructed subsidence curve is optimized by a least-squares fitting method. In a last step the individual stretching factors for each location are put together in two maps, one map for the crust (beta-factor; Figure 3C) and a second map for the lithospheric mantle (gamma-factor; Figure 3D). Finally, the heat flow history can be elaborated by using the stretching factor maps for a traditional, non-volcanic McKenzie approach to calculate heat flow maps for each time step with maximal heat flow values during rifting periods (Figure 3E) with an exponential decay of heat flow values during subsidence reaching the lowest value at present day (Figure 3F; compare heat flow history through time in Figure 4) (Baur et al., 2009 a; Hantschel and Kauerauf, 2009; Jarvis and McKenzie 1980; McKenzie 1978).
Results Geodynamic (JdA)
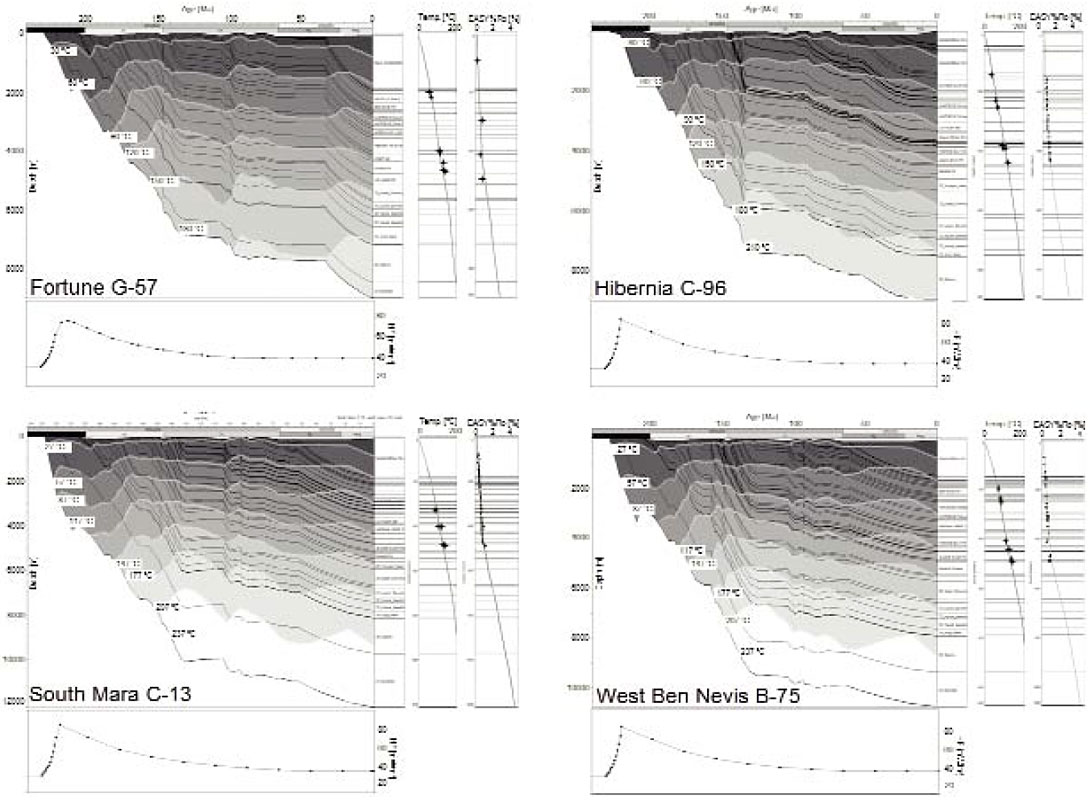
Based on the heat flow modeling it was reconstructed and calibrated that one single active rifting event is sufficient to cause enough tectonic and thermal subsidence and to match the reconstructed subsidence with the calculated one for all locations in the Jeanne d’Arc basin (Figure 4) and to calibrate the thermal regime evaluated based on vitrinite reflectance data, apatite fission track data and Horner-corrected present day bottom hole temperatures (Baur et al., 2009 a) (Figure 5). Therefore it can be concluded that the Jeanne d’Arc basin, formed as a failed rift basin, as part of the two-stage opening scenario of the Atlantic was affected by one active Late Triassic rift event and a second but probably ultra slow stretching period during the Late Jurassic – Early Cretaceous. This second event did not have a thermal impact on the tectonic or thermal subsidence or on the paleo-temperatures and maturities (Baur et al., 2009 a).
The reconstructed and calibrated heat flow history can now be used in combination with measured source rock reaction kinetics and the numerical 4D model to analyze how much hydrocarbons were generated and how much were expelled, lost and trapped. To do this we need more information about the source rock geochemistry, carrier bed and reservoir permeability and porosity, seal effectiveness and timing of trap formation to reconstruct a filling history for an already known oil field or to predict new plays in undrilled prospects.
Petroleum System – Source Rock (JdA)
The only mature source rock in the Jeanne d’Arc basin is the Kimmeridgian Egret Member, predominantly consisting of laminated, brown marls and calcareous shale as well as lime- and mudstone with high organic carbon content from marine planktonic organisms and terrigenous detritus. The total organic carbon (TOC) content ranges predominantly between 4 and 6 wt% for the low-maturity samples with a hydrogen index (HI) ranging from 100 to 610 mg HC/g TOC (Baur et al., 2009 b). In order to set the source rock conditions to its initial situation to use the data as input parameters in the numerical model one has to recalculate them. One approach is to calculate the original HI values based on measured maceral composition for the source rock, applying equation 1 (modified after Jarvie et al., 2007), where a pure liptinite has an assumed original HI value of 750 mgHC/gTOC, a pure vitrinite sample 125 mgHC/gTOC and a dead inertinit 50 mgHC/gTOC.
HI maceral = HIo = ((750*Liptinit/100) + (125*Vitrinite/100)+(50*inertinite/100))
Based on the determined original HI value (HIo) the original TOC (TOCo) can be calculated based on equation 2 by Peters at el. (2005).
TOCo = F (HIx) * (TOCx) / [HI0 / (1-f) * (F - TOCx) + HIx (TOCx)]
F = H/C ratio of expelled HCs [fraction]
HIx = measured HI value [mgHC/gTOC)
TOCx = measured TOC [wt%]
HIo = original HI, assumed or calculated
f = extent of fractional conversion (Peters et al., 2005) [fraction]
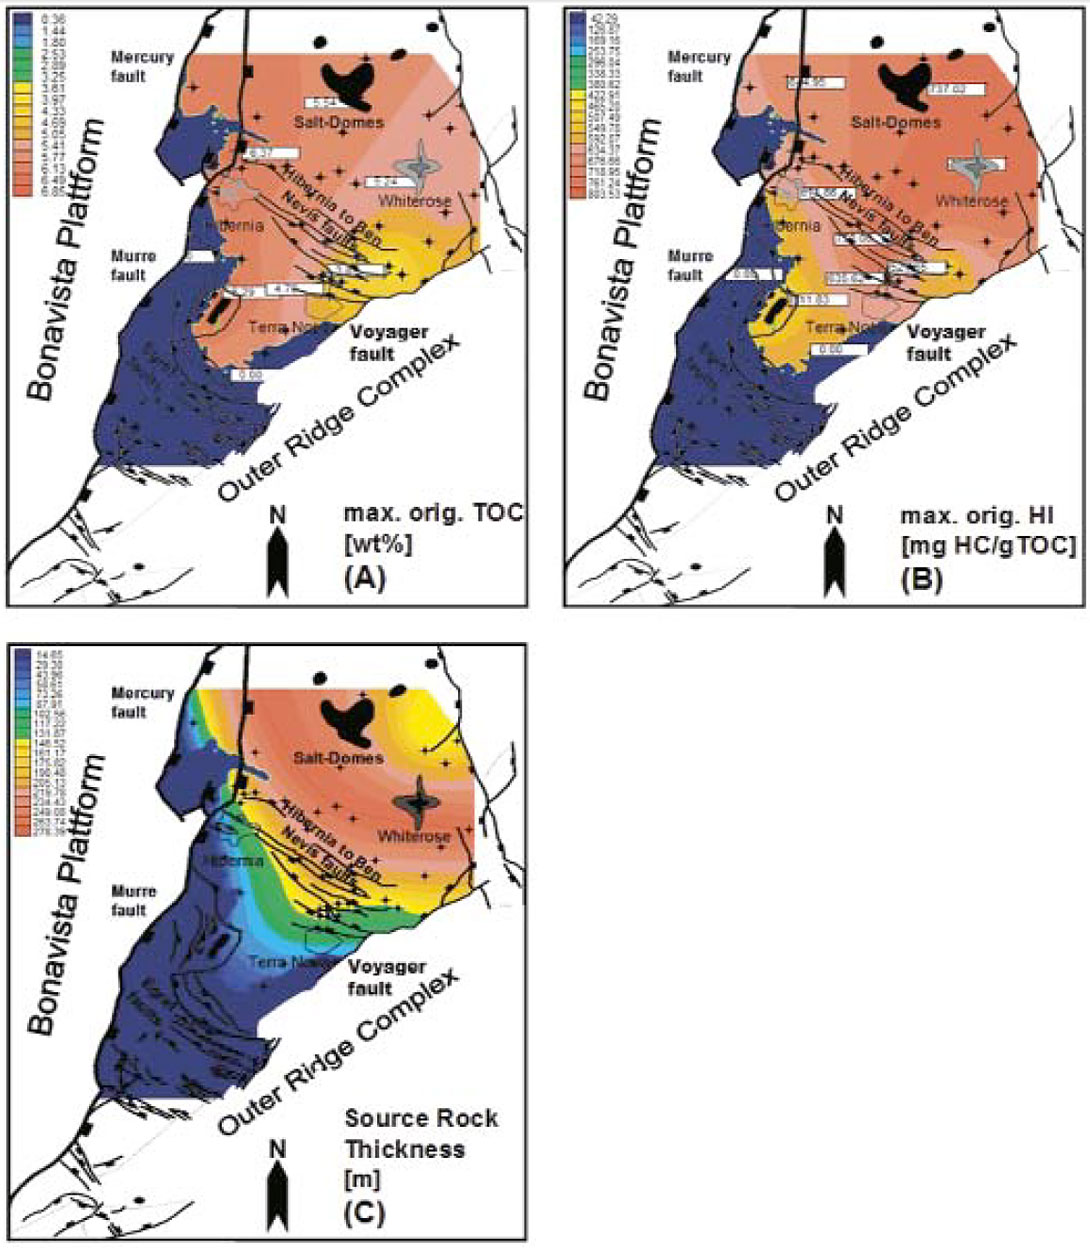
The averaged HIo and TOCo values can be plotted on maps for each well location, interpolated in between and finally assigned to the corresponding source rock layer (Figure 6A and B). Finally the thickness of the active source rock is of prime importance to be able to calculate the generated masses more accurately. Based on the porosity and resistively logs for 17 wells in the Jeanne d’Arc basin the organic richness (TOC and S2) was calculated to determine the active part of the source rock (Huang et al., 1994; Magoon et al. 2005; GSC, 2008; Figure 6A-C)
Petroleum System – Carrier, Reservoir, Trap Formation (JdA)
The most important reservoir units in the Jeanne d’Arc basin are siliziclastic deposits dumped into the basin during periods of uplift and erosion during the Late Jurassic and Early Cretaceous with best reservoir porosities ranging between 15 and 25% and permeabilities of up to 100 mD. The measured reservoir data can be used to adjust the default lithologies so that they match the measurements. Seal units are in general of shaly composition with capillary entry pressures ranging between 12 and 16 MPa and permeabilities between -6.00 and -7.50 log mD at 5% porosity (Hantschel and Kauerauf, 2009). The first effective and ideally compacted seal in the Jeanne d’Arc basin above the Egret source rock was deposited during the latest Thitonian in the form of the Fortune shale unit, which seals the Jeanne d’Arc reservoir. Trap formation took place basically during the deposition of the Hibernia Formation, during the Berriasian (140 Ma) with a second period during the Paleocene (53 Ma). Afterwards the general shape of the drainage areas did not change any more and the entire migration pattern kept constant from this time onwards (last 53 Ma).
Petroleum System – Migration (JdA)
To perform a quick migration analysis one can use in this particular study a reservoir map deriving from an age younger than 53 Ma, to analyze the general migration pattern, maximum and minimum column heights for accumulations with respect to the capillary entry pressure of the overlying seal and for different densities and phases of the accumulated fluids, etc. Figure 7 shows such a fast migration analysis for the Jeanne d’Arc reservoir layer of the Jeanne d’Arc basin using the reservoir map from the present day situation.
This ex ante analysis helps greatly in understanding the basics of the petroleum system, and hence allowing adjustment of the input data to improve the full 4D simulation. Finally we can perform a simulation taking into account all physical and geochemical properties of the rocks and fluids by using Flowpath, Darcy, Invasion Percolation or a combined method to elaborate a complete mass balance calculation, either for the entire basin or for a single oil field (Baur et al., 2009 b).
Results Petroleum System (JdA)
A new filling history differing from the traditional one could be determined for the Terra Nova oil field. The new results say that the field was not only charged by the source rock which underlies the prospect area directly, but was additionally charged by a kitchen area located between the Terra Nova and Hibernia oil fields (Baur et al., 2009 b). This is also supported by the measured results of the geochemical analysis. The development of the drainage areas through time and the present accumulations for the Hibernia-, Mara-, Hebron-, Ben Nevis and Springdale accumulations could be determined with the model very well whereas the high gas content in the White Rose prospect could not be reproduced. Based on our 5 different elaborated PhaseKinetics for the Egret source rock we could determine different source rock provinces, where the western part of the source rock looks more heterogenous and the eastern part more homogenous.
Carson Basin
The Carson Basin on the eastern Grand Banks of Newfoundland has been penetrated by four wells, which were drilled along its western margin. The Carson Basin wells contain a thick Mesozoic and Cenozoic sedimentary section which includes reservoirs and seals; but source rocks, such as those in the Jeanne d’Arc Basin, have not been found. To assess the petroleum system, well samples were collected to provide Rock-Eval, vitrinite reflectance and biostratigraphic data to obtain ages, depositional environments and data for possible source rocks.
Additionally, an integrated 4D model of the Carson Basin was built from biostratigraphy and seismic surfaces, and an Egretlike source rock in the center of the basin was added. The modeling showed that significant volumes of hydrocarbons could have been generated, mainly during the main Late Cretaceous-Early Tertiary rifting event. Hence, significant volumes of hydrocarbon could be present in the Carson Basin, mainly in stratigraphic traps in Early Cretaceous or Early Tertiary clastic reservoirs.
Establishing the stratigraphy and paleo-environment conditions (Carson Basin)
Cuttings were collected from Bonnition H-32, Osprey H-84, Skua E-41 and St. George J-55 as well as from Cormorant N-83 and Terra Nova K-18 from the Jeanne d’Arc Basin to allow comparison with a better known area (Wielens et al., 2002). In addition to the traditional approach of using foraminifera and ostracod data to establish palaeo-environmental curves, palynomorphs have been studied. Especially dinoflagellate species show environmental preferences which are reflected in the cyst phase (e.g. Wall et al., 1977; Dale, 1996), and can frequently be used to differentiate between marginal marine, inner and outer neritic and open marine environments. Preliminary environmental curves for five wells (Terra Nova K-18, Cormorant N-83, St. George J-55, Skua E-41, and Osprey H-84) are shown in Figure 8. The general trends are similar to the sea level curve of Haq et al. (1987) and can be used to correlate the paleo-environment in the Carson basin to those in the Jeanne d’Arc basin.
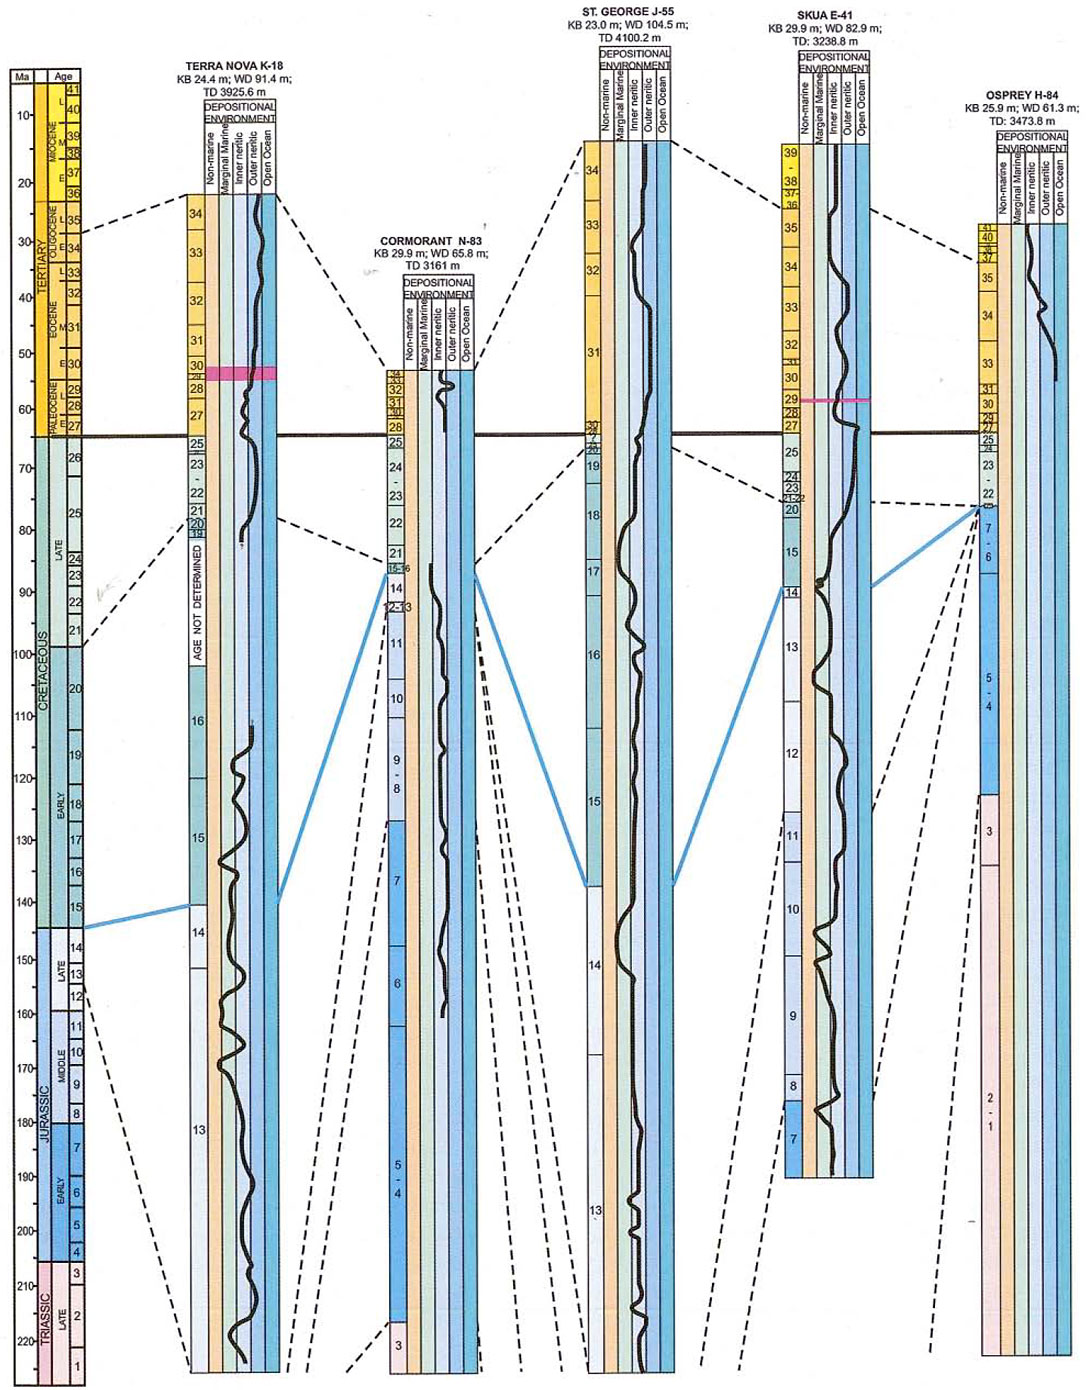
Throughout the Jurassic, palaeo-environments generally varied from marginal marine to inner neritic. At Skua E-41, outer neritic conditions existed probably for a few million years during the Oxfordian (12 on Figure 8) but changed to marginal marine to non-marine in the Kimmeridgian (13). The Kimmeridgian (13) is inner neritic to marginal marine at the St. George J-55 well and non-marine to innermost neritic in the Skua E-41 well.
We assume that a Late Jurassic source rock, similar to the Egret Member (of the Rankin Formation) of the Jeanne d’Arc basin, is present in the deeper-water, distal parts of the Carson Basin. This is based on a regional paleotectonic reconstruction, together with gravity and magnetic data, including sea-floor spreading magnetic anomalies (Wielens et al., 2006). We interpret the absence of the Egret Member in the four wells to reflect the wells’ locations rather than the Member’s absence from the two basins, because the presence of the Egret Member is known to be widespread as, more than 100 km away from the Jeanne d’Arc basin, it has been found in wells such as Baccalieu I-78 in the Flemish Pass Basin (McCracken et al., 2000).
The characteristics for the assumed Egret Member source rock used in the numerical model were derived mainly from Rock-Eval data. A Type II kerogen with a homogenous TOC of 4% and a Hydrogen Index of 600 mgHC/g Corg has been used in the model.
Other possible source rocks may also be present, e.g. the Paleocene interval which contains a dinocyst bloom in Skua E-41 but the very low maturity level is the limiting factor for this rock unit to act as a source rock.
Extensive Cretaceous reservoir sediments are rarely developed but there are several hiatuses and erosional unconformities. The Avalon Uplift, a regional arch, was active between 143 Ma and 95 Ma, and caused the deposition of locally limited, but coarse grained reservoir rocks on the eastern side of the Carson basin. Additional close examination of seismic data (Wielens et al., 2006) shows features of possible reservoir potential within the Early Tertiary channel system mapped at the northern end of the Carson Basin. This channel system has been strongly influenced by the structure of the underlying Mesozoic section with its significant salt, which moves concurrent with deposition of the overlaying sediments, as proposed by Davison (2004). Circumstantial evidence for fluid charging of parts of the channel system is the widespread presence of seismic amplitude or ‘bright spot’ anomalies (Wielens et al., 2006).
Recognition of this clastic fairway system was a key to the development of a 4D geological model for numerical basin simulation. Seals for the reservoirs are provided by the many shales in the sedimentary section.
Basin Modeling (Carson Basin)
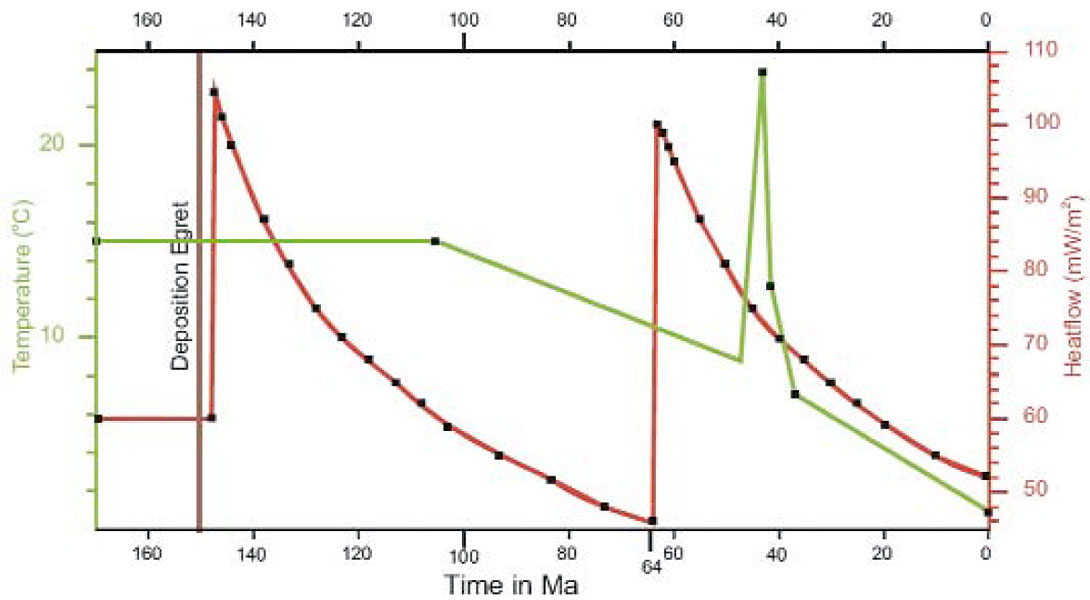
The 4D modeling was done with Petromod®, after calibration from well data in its 1D module. Most important for petroleum generation is the thermal regime, which is controlled basically by heat flow. Figure 9 shows the red temperature curve as applied to the base of the sedimentary section over time and reflects the influence of two rifting events. The first one, related to the rifting of Grand Banks from Iberia at 146 Ma, would have had little effect on a 152 Ma old source rock, as it would not have been sufficiently deeply buried. The peak heat flow value of about 100 mW/m2 is a consensus derived from many publications (e.g. Sclater et al., 1980). The second rift event, the separation from Europe at 65 Ma, would have had a significant effect on a 152 Ma or Egret Member equivalent (or older Jurassic) potential source rock. The peak heat flow value of 100 mW/m2 is slightly smaller than the earlier peak heat flow value, because the rifting event appears to have been smaller on a global scale and the rifting centre was more distant. In both cases, the heat flow likely diminished consistent with Mackenzie type decay i.e. exponential decrease (Turcotte and Shubert, 2002, p. 154) to a present-day value of 52 mW/m2 (S. Dehler, pers. comm., 2002). The spike in the green line for the sediment-water interface temperature (Figure 9) represents the Paleocene warming episode.
The model shows that hydrocarbon generation is most sensitive to variations in heat flow. Using a best estimate of heat flow during rifting, the model shows that significant volumes of hydrocarbons can be generated (light green bar on Figure 10). The hydrocarbon generation simulation shows that significant generation stopped soon after this final rifting event (Figure 10).
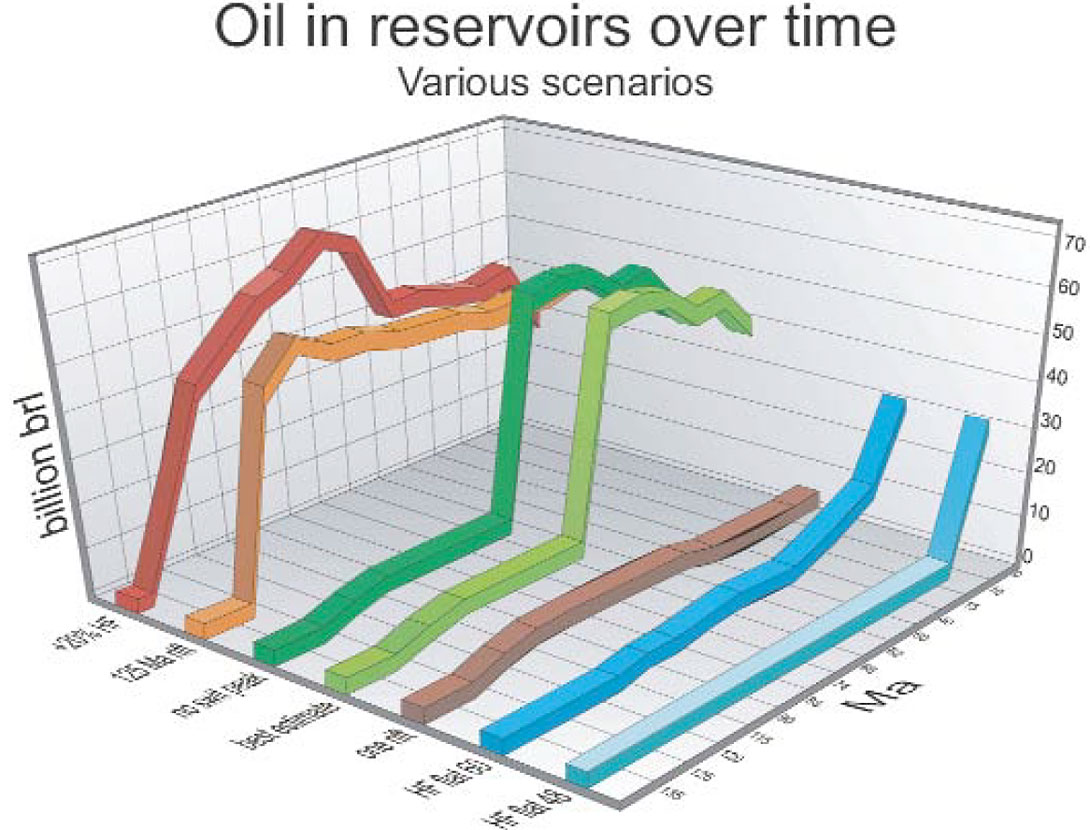
Figure 10 shows a 3D plot of modeled results showing the calculated volumes of oil, in billions of barrels, in the combined reservoirs over time, in Ma. The numbers used in the following are based on simulation in a simplified, idealized model, directly reflect the model input parameters, and should NOT be quoted. They are used to compare relative magnitudes of oil and gas here in different scenarios. The results of the best-estimate-of-allparameters simulation are in light green (Figure 10). Dark green results derive from deleting the Paleocene temperature spike at the sediment-water interface (Figure 10). Red depicts the effect on ‘best estimate’ of an increase of heat flow by 20 %. Shifting the 64 Ma rifting to 125 Ma is shown in orange; discarding the 64 Ma rift is in brown. The blue bars show results of flat heat flow at 60 mW/m2 in dark blue and 48 mW/m2 in light blue; the latter is the minimum heat flow needed to generate hydrocarbons.

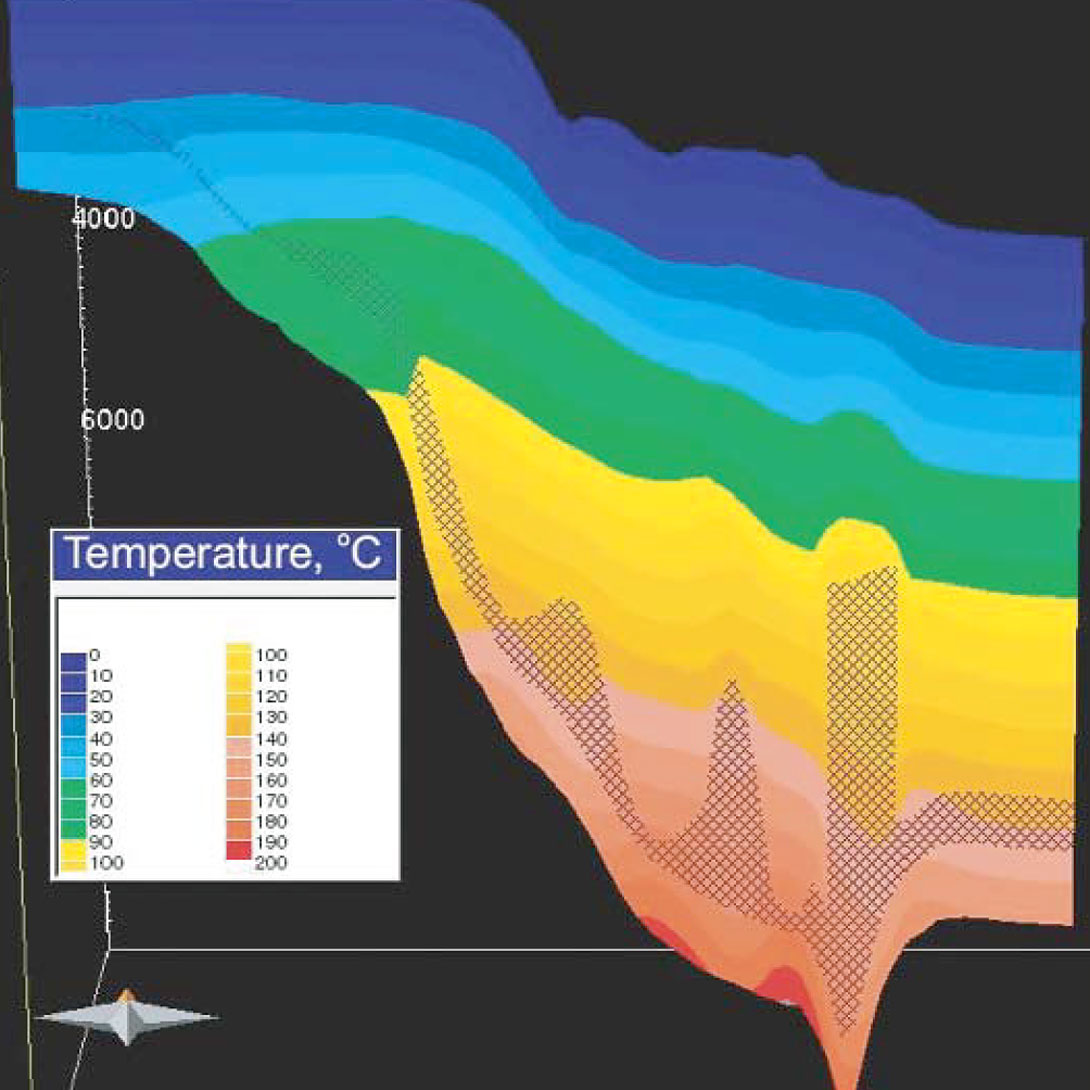
The generated hydrocarbons in the numerical model migrate to the up-dip pinch-out of the sandstone layer, sealed by the Fortune Bay Shale, with a few accumulations in structures already formed by salt deformation (Figure 11). Salt movement into diapirs affects the local maturation process and timing. The high thermal conductivity of the salt would transport the heat to a higher level in the section, locally raising the temperature of shallow strata. This would create a ‘hot-chimney’ effect in the source rock (Figure 12).
Conclusion (Carson Basin)
The Carson Basin is capable of generating significant volumes of hydrocarbons, with migration mainly into the Jeanne d’Arc Formation, if a Jurassic Egret Member type source rock is present. The timing of hydrocarbon generation was prior to 65 Ma, and most younger traps will have a smaller chance of charging The volume of oil that would have been generated by the potential Egret Member source rock of similar characteristics to those in the Jeanne d’ Arc Basin is large. The simulation shows that nearly 50% of the basin is sufficiently mature to generate hydrocarbons. However, migration inefficiencies reduce the volume that will be trapped; a commonly-used rule is that about 10% may be trapped, meaning that 5 billion barrels could be present. The various simulation runs will help to establish the P10, P90 probabilities and best-guess values of hydrocarbons that are needed for Monte Carlo simulations and economic models. Salt movement may pose a significant risk of breaching reservoirs.

Related Reading


Join the Conversation
Interested in starting, or contributing to a conversation about an article or issue of the RECORDER? Join our CSEG LinkedIn Group.
Share This Article