Introduction
Relative strength in oil prices, and sentiment that future supplies may be limited, have led some operating companies to explore in frontier areas that have proven, historically, to be highly productive. Some of these areas have seen little exploration activity for several decades for varied reasons, such as difficulty of access or governmental restrictions.
Methodology
As is often the case, the announcement of a major oil discovery leads to multiple attempts to determine what was drilled, and how the discovering company was able to identify the target. Finding out how to identify the play can be a good first step in deciding if a competing company wants to chase it further and start evaluating land opportunities or farm-ins. Identifying the available data to examine, over or near the prospect, is generally near the top of the list, ranging from gravity or EM data to seismic. It is the start of the hunt for clues as to what they know that you don’t.
In this case study, a vintage 2D line from the NPR-A was identified that crossed an area known to be the site of a recent discovery. Evaluation of the existing processed data did not yield any insight as to what the actual prospect was. Therefore, the decision was made to reprocess the data using a modern, proven AVO-compliant flow, and to attempt both a structural interpretation as well as an analysis of the prestack data.
A key consideration is that a 6-fold 1975 line with a 100-meter group interval was all that was available. The acquisition parameters are detailed in Table 1. Normally, a line with these sparse parameters would not be considered, even for a QI, if more modern data was available.
| Table 1. Acquisition parameters. | |
| Date shot | 1975 |
| Instrument | DFS III |
| # Channels | 48 |
| Sample rate | 2 ms |
| Record length | 6 sec |
| Instrument filter | 8-124 Hz |
| Source type | Dynamite |
| Source pattern | Single hole |
| Source depth | 23 m |
| Charge size | 22.7 kg |
| Source interval | 402.3 m |
| Group interval | 100.6 m |
| Near offset | 50.3 m |
| Far offset | 2363.7 m |
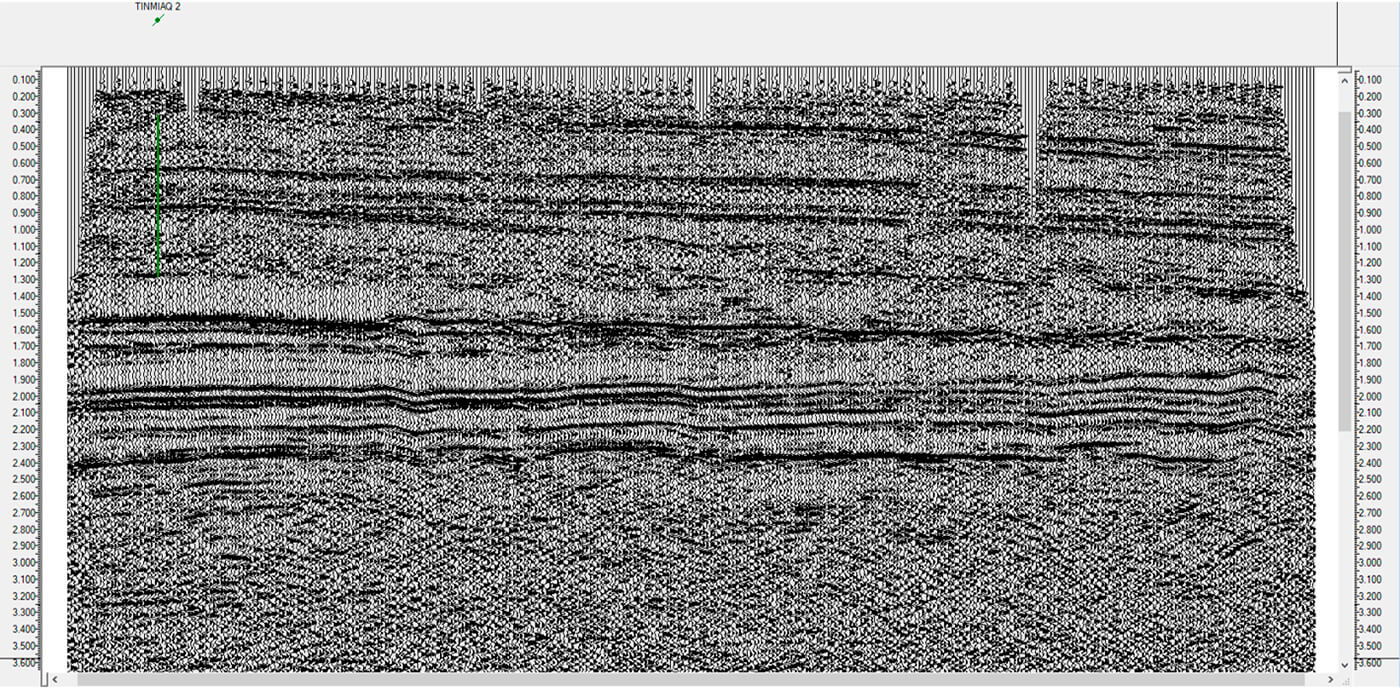
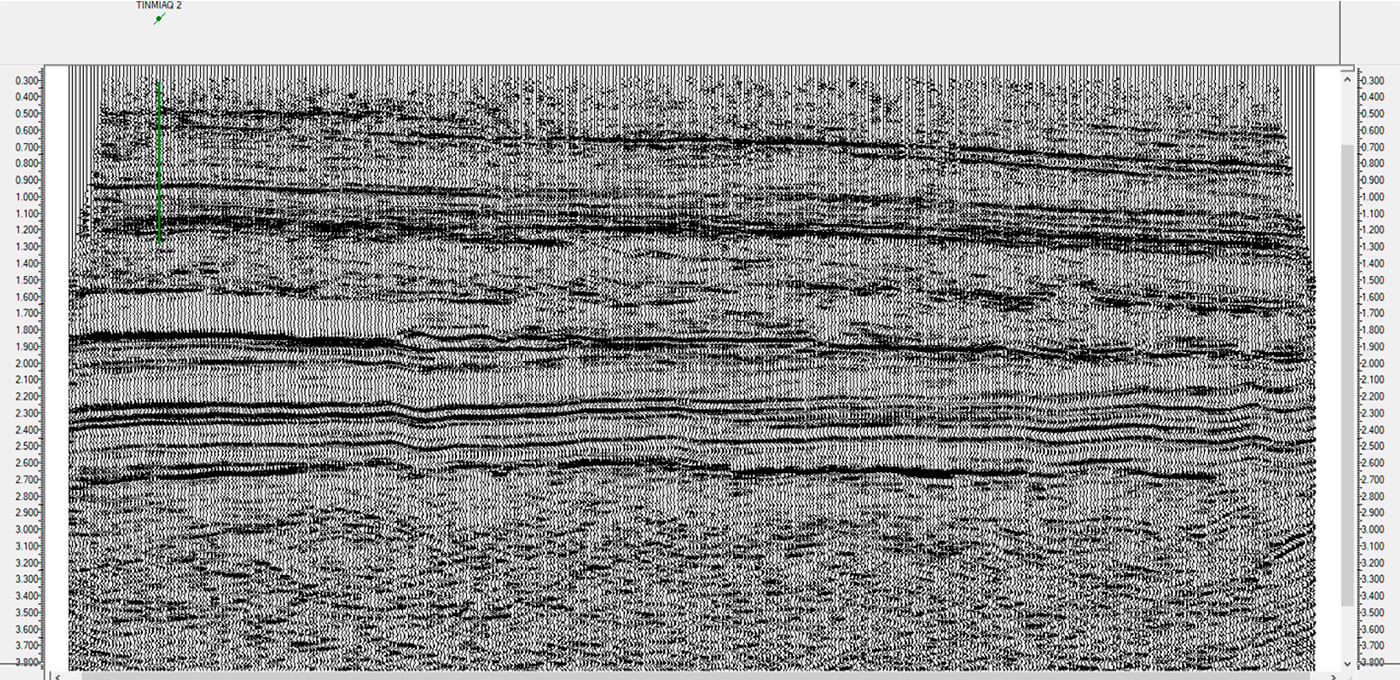
The data package included field data reformatted to SEGY, scanned copies of the observer’s reports and survey notes, a JPEG image of the original final film section, and a SEGY version of the original final stacked data. It is worth noting that the original 1975 processing predates the use of migration in production processing, so the final section is an unmigrated structure stack (Fig. 1). Survey data was provided as latitude and longitude locations, based on shot point positions. This data was provided to the processor to evaluate and determine the likelihood of successful processing results.
Initial potential issues were identified as octal file numbering of the original data, which had been renumbered to decimal on the SEGY conversion. Some noise-contaminated records, which were possibly contaminated by the SEGY conversion and not the original recording, were also identified. Additionally, the available survey notes gave a bare minimum to perform a survey audit, and the only other elevation information was from the legacy film section image. Fortunately, Google Earth could be used to build an accurate elevation profile. Given that the purpose of the processing was more qualitative, in the sense that geographic position was not precisely required, it was decided to proceed with the provided survey data and derived elevations.
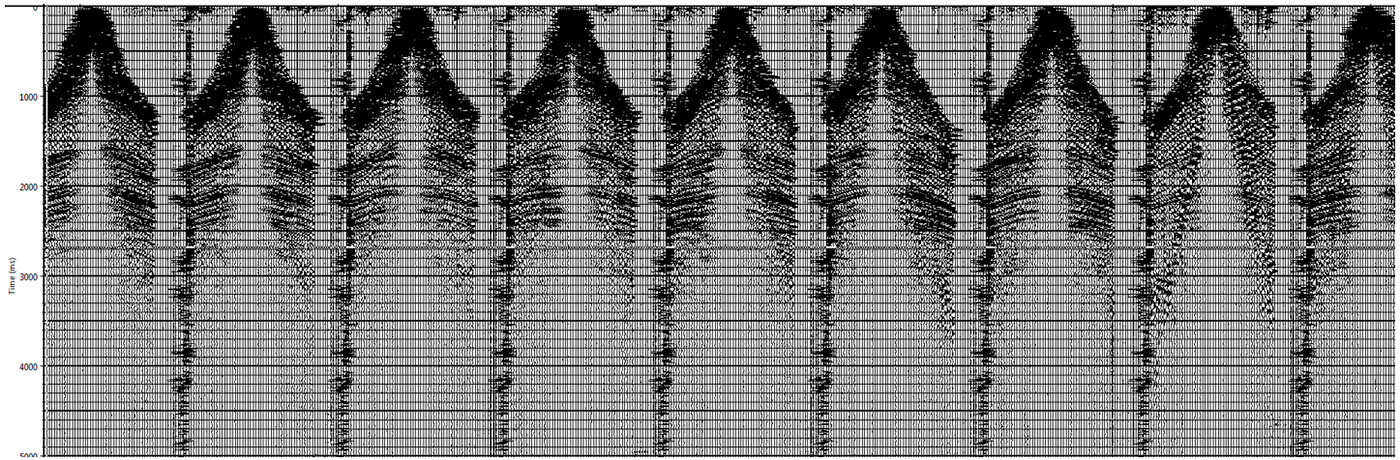
Older seismic data often presents challenges in getting the relative geometry of source and receiver locations assigned to the trace headers of the data. In this case, the SEGY-converted data required a mapping of the field file numbers in the trace headers to the original octal numbering that had been used in recording. Additionally, a numbering scheme to allow for 4 receivers per shot point had to be created, and the receiver XY positions had to be adjusted to be a one-half group interval skid from the defined source point survey locations. Once the geometry was assigned, it was necessary to confirm that the relative spatial relationships between the sources and receivers were correct. Figure 2 shows the raw SEGY-converted field data before geometry assignment.
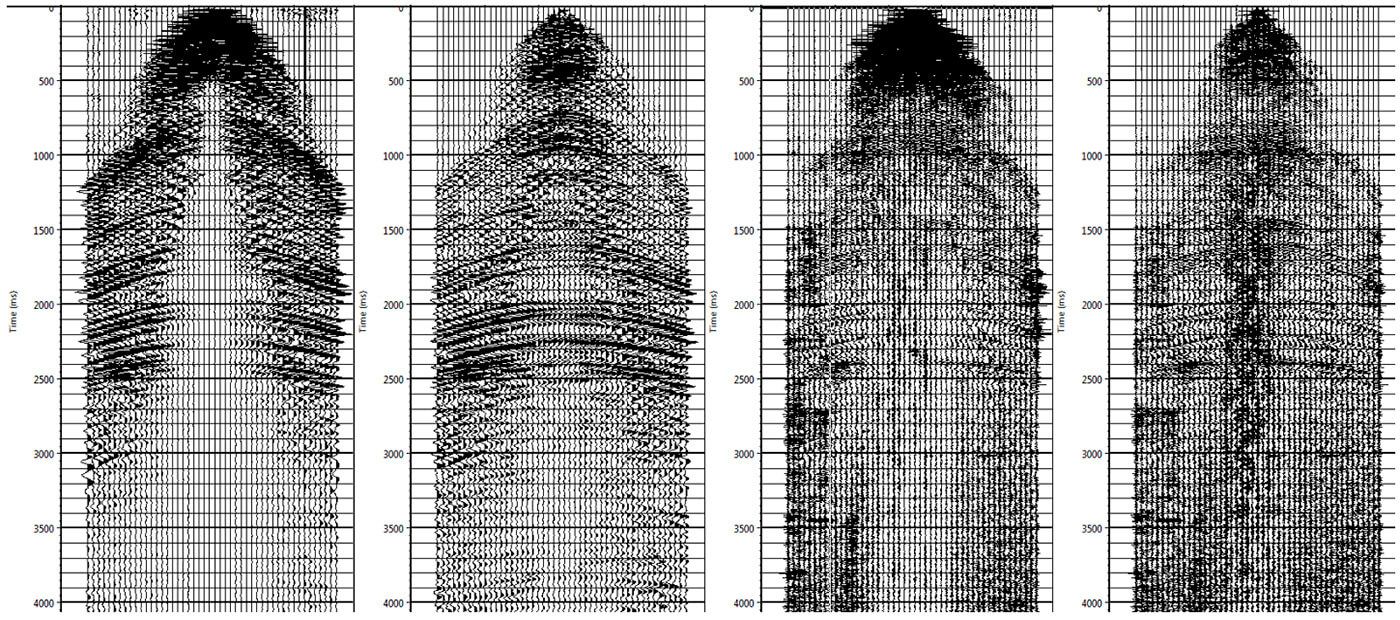
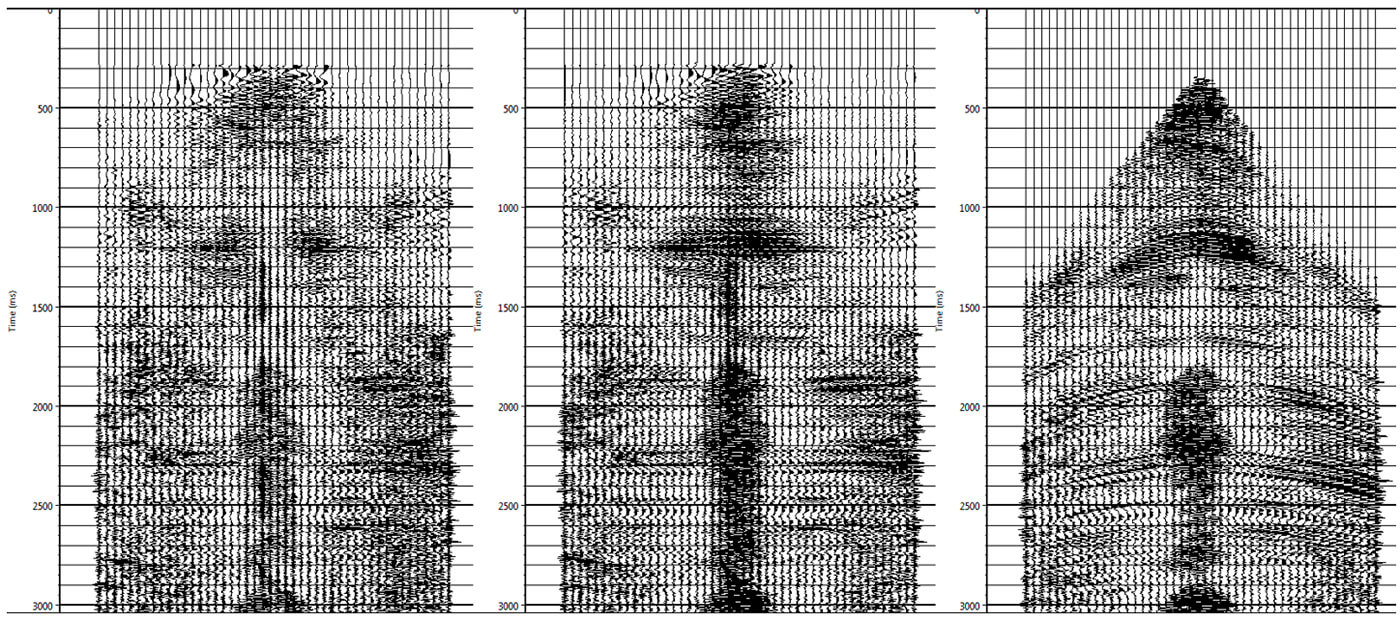
As the goal of the processing was to obtain fully AVO-compliant gathers, it was decided to follow a processing flow analogous to one recently employed on several newly acquired 2D and 3D programs, with a strong focus on noise attenuation. The focus on noise was due in large part to the fact that the data was only 6-fold, while the newly acquired programs were generally on the order of 80- to 120- fold. A first step for this was to apply manual trace edits to the data, removing noisy traces and correcting reverse polarity stations. An exponential gain correction was applied, followed by spike removal, and linear noise attenuation using a model and subtract method, before surface-consistent deconvolution. The deconvolved data was again passed through a spike removal and linear noise attenuation with a surface-consistent scale applied to generate a set of AVO-compliant gathers. To simplify the image processing, a trace-by-trace scalar was applied, as well as a spectral balance, and a set of gathers that could be used for the easier determination of statics and velocity was created. Figure 3 illustrates the progression from raw field data to AVO-compliant deconvolved gathers.
Refraction statics were computed for the data using a regression-based approach from the first break picks, and a datum and replacement velocity selected to match other data in the area. Several passes of automatic residual statics and velocity analysis yielded a final stack showing good continuity and static stability (Fig. 4). Several QC steps confirming the static solution and optimizing the data image were undertaken before a final stack and gathers were generated. A post-stack migration was performed as an initial look at the response of the data to migration. Based on the post-stack results, an initial PSTM (pre-stack time migration) was run, including testing of the migration operator to optimize the migration image. Noting the presence of a great deal of random noise in the final gathers, a random noise attenuation method was used to reduce the random noise pre-migration. Another PSTM was run using these noise-attenuated gathers as input, and the results were improved relative to the original PSTM. To optimize the imaging, PSTM image velocity analysis was run using these noise-attenuated gathers, and an updated velocity field was generated for the PSTM process. A final image volume was generated using this updated PSTM velocity field (Fig. 5).
To generate the AVO-compliant gathers required returning to the AVO-compliant decon data, applying the statics computed using the non-AVO-compliant data, and producing a set of gathers with the final statics and velocity applied. As a general rule, the non-AVO-compliant data is easier to work with, allowing for easier residual static calculation and velocity analysis. Having already determined the efficacy of additional noise attenuation, random noise was attacked with a rank-reduction approach, and additional spike removal performed (Fig. 6). The data was equalized with a surface-consistent scale, and fed into the PSTM using the optimized parameters from the non-AVO-compliant data. A stacked AVO-compliant PSTM version was first generated as a check on the response of the AVO-compliant data to the PSTM process.
Since the data was acquired as 6-fold, and increasing the CDP bin size from the natural bin of 50.3 m was not a realistic option, it was decided to allow the Kirchhoff migration algorithm to generate a fully populated volume with 100.6 m offset bins. Migrated gathers were generated from 0 to 2816.4 m in 100.6 m steps, giving 28-fold output CDP offset gathers. Of course, the limited sampling of offsets in the input data led to cancellation issues at the ends of the line, but generally, the summation power of the migration was able to produce a reliable output. Post-processing of the migrated gathers included random noise attenuation and a residual moveout correction.
Analysis of the reprocessed data included interpretation of the stacked products, in particular the prestack time migration, as well as detailed analysis of the AVO-compliant migrated gathers. By looking at the actual prestack data, a more detailed interpretation was performed including the generation of custom AVO volumes providing a more detailed and geologically constrained interpretation.
The reprocessed line was chosen since it overlies the ConocoPhillips Tinmiaq #2 well drilled in 2016. The well was drilled into the Willow trend in the Lower Nanushuk Formation. The well flowed over 3200 barrels per day of 41-45° API oil. The play is believed to be a stratigraphic trap in the Nanushuk and to contain up to 300 million barrels of recoverable oil. The Nanushuk sits at the top of the Cretaceous in the lower Brookian Sequence. The oil-bearing zones are comprised of stratigraphically trapped sandstones, sealed by overlying mudstone. Previously known productive zones in the general area tend to be deeper, in the Jurassic and Triassic (Decker, 2018). The goal of this study was to determine if the reprocessed vintage data could be used to find an AVO response at the discovery location, and if so, to see how prevalent the AVO response was elsewhere in the section.
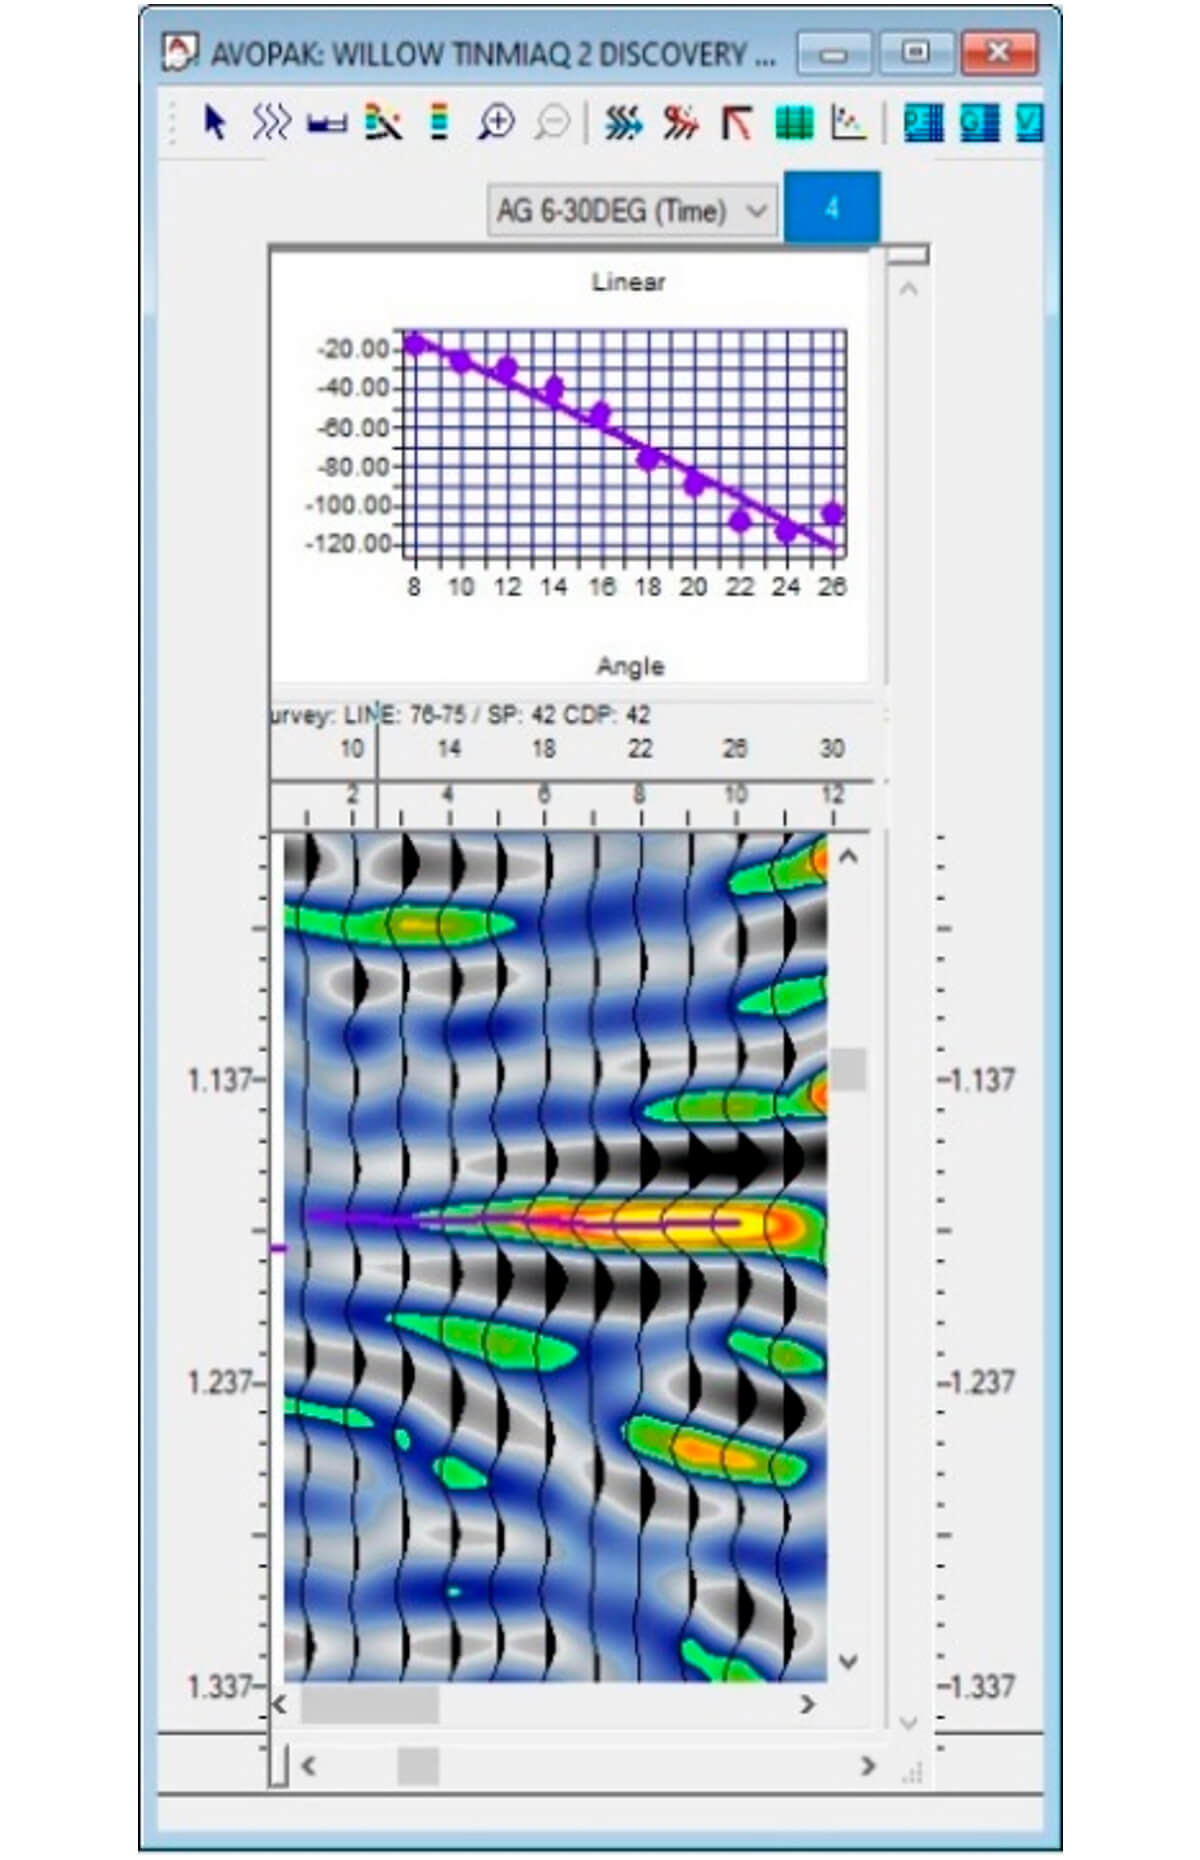
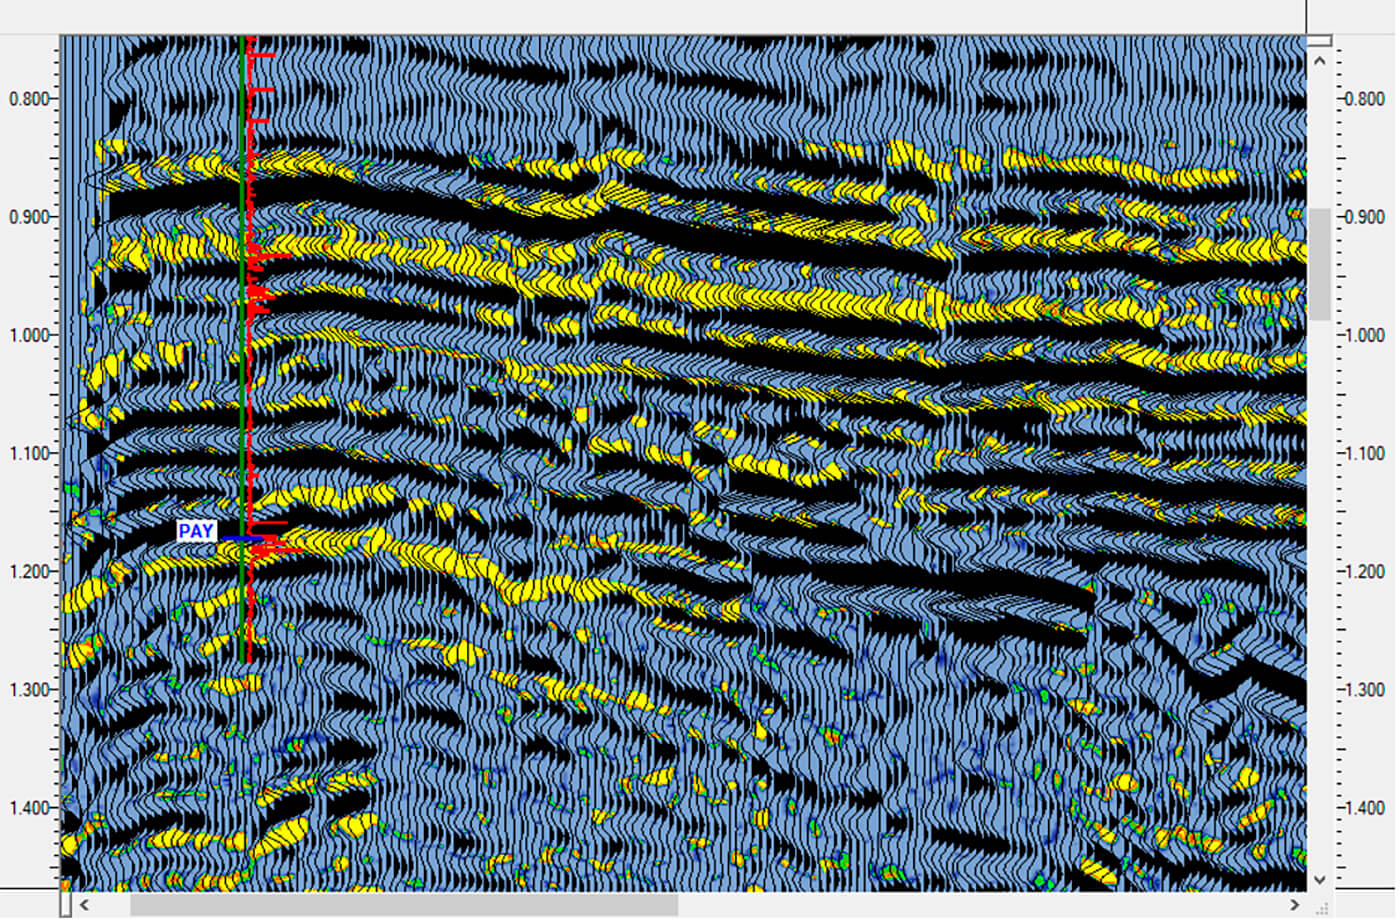
The first step in this process was to tie the well data from Tinmiaq #2 to the seismic marker on the stack associated with production. The sonic and density logs from the well were used to build a synthetic for the tie, and a filter of 5/10 – 30/40 Hz was applied to both the synthetic and the seismic data to make the correlation simpler and more reliable. A horizon was then digitized along the seismic marker associated with the pay zone, which was then used in the gather display to identify and digitize the seismic amplitudes associated with the stacked marker at the pay zone. The AVO-compliant PSTM offset gathers were converted to angle gathers, using the smoothed processing-derived velocity field; the angles used were between 6 and 30 degrees. The amplitudes at the pay horizon were cross-plotted relative to their associated angle to determine if there was a gradient associated with the hydrocarbon-charged sand.
Results
Figure 7 illustrates a well-behaved linear gradient between amplitude and angle of incidence for the marker associated with pay at the Tinmiaq #2 well location. The strong negative gradient is a well-recognized response of productive sands throughout the industry. A gradient volume for the entire 2D line was created after the calibration process, using the same filter parameters for the synthetic tie and an angle range between 6 and 30° (Fig. 8). The occurrence of additional anomalies away from the well is largely constrained to the known productive horizon, and also appears constrained by structure, which further suggests that these AVO anomalies are most likely associated with the presence of hydrocarbons. This correlation of the AVO response to the well results suggests that the observed AVO from the vintage 2D data can be used to identify possible hydrocarbon-bearing zones in the data.
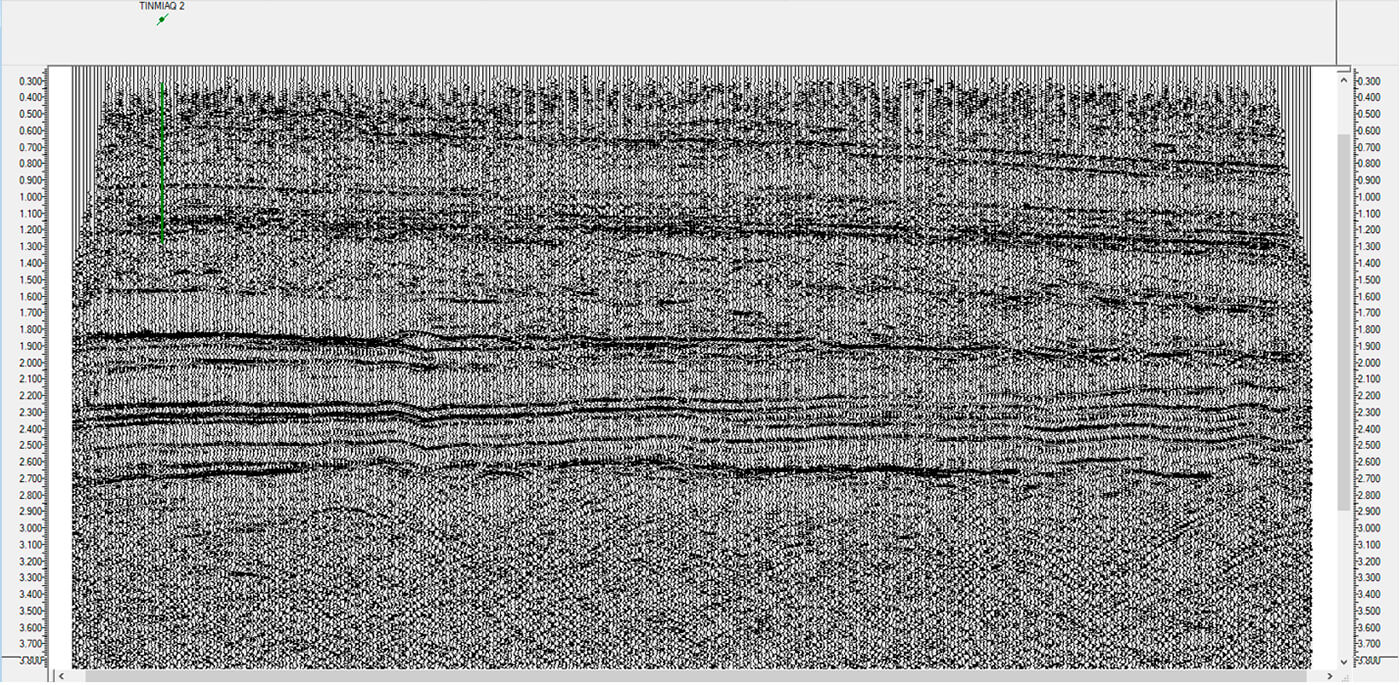
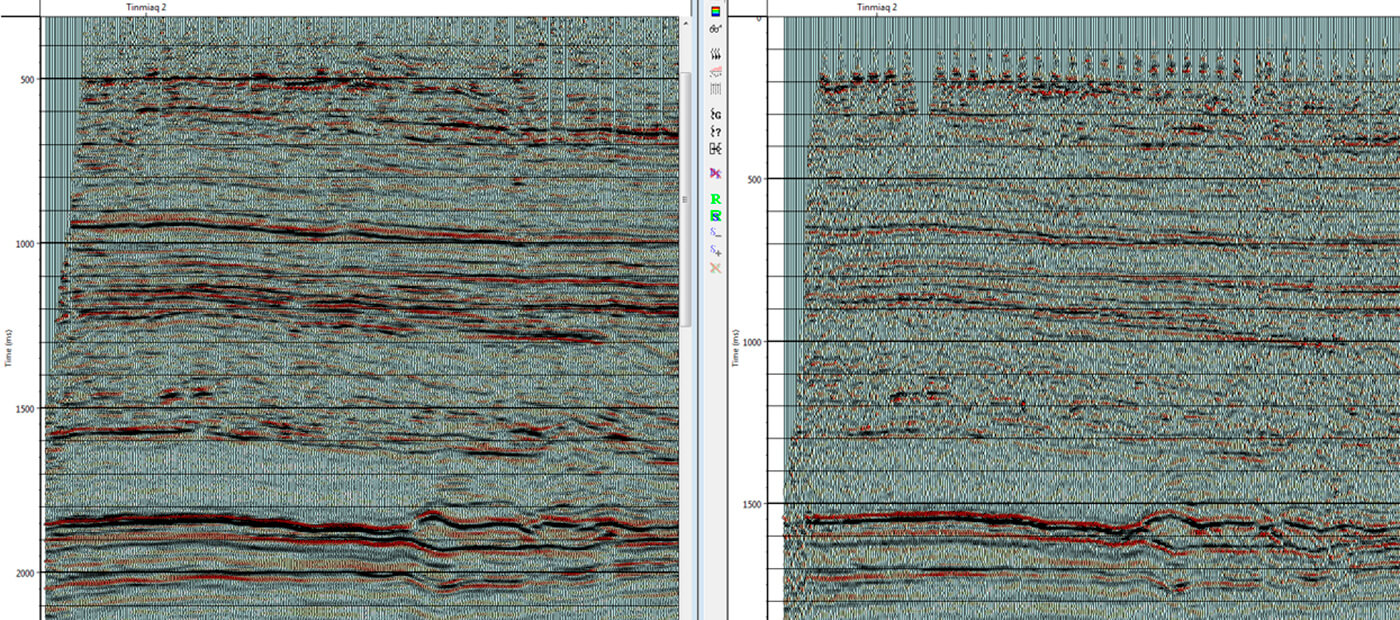
Reprocessing of the data not only allowed for AVO analysis of the migrated gathers, but the improvement in overall imaging led to a more confident interpretation of the data. Figure 9 provides a side by side comparison of a portion of the line, showing, unsurprisingly, that 45 years of processing technology advancement can lead to improved processing results.
Conclusion
Application of modern state-of-the-art processing techniques to vintage seismic data can be used to delineate previously unrecognized hydrocarbon-bearing zones. As the understanding of trapping mechanisms and the potentially productive zones in older known petroleum basins has improved over time, so too has the ability to extract meaningful information from older datasets acquired in these basins. While this case study may offer an extreme example of the challenges facing acquisition of new data, similar challenges can exist almost anywhere in the world where exploration programs are proposed. If value can be extracted to improve the focus of an exploration program, via careful reprocessing and detailed interpretation, the potential time and monetary savings should be easily justifiable.

Acknowledgements
The authors would like to thank the United States Geological Survey for permission to use the seismic data. Well data was provided by the Alaska Oil and Gas Conservation Commission via a public records request.


Join the Conversation
Interested in starting, or contributing to a conversation about an article or issue of the RECORDER? Join our CSEG LinkedIn Group.
Share This Article