To de-risk a frontier area properly requires establishing the geological framework, and this is where seismic data can provide important controls on the basin framework by helping to understand features such as stratigraphic thicknesses, large-scale structural features such as faults and folds, and vertical and lateral velocity variations. To help reduce the risk in unexplored environments this paper presents an approach that can be adopted to model pore pressure in deep-water settings, with Labrador as the main case study area featured, but also discussing other global examples such as the Vøring Basin, Mid-Norway. Analogues are often focused on a similar basinscale tectonostratigraphic framework, but there are many aspects to a geological-pressure model that must be de-risked, for example, sand-shale geometries, reservoir plumbing, TOC within shales, thermal evolution, and sedimentation rate. A geological-pressure model approach can be used to sense-check any pore pressure interpretation from seismic velocity although, as discussed herein, these data are not always suitable for use for pore pressure prediction. Deep lithologies are, by regional analogue and geological process, likely to be affected by cementation, which will act to preserve loading-related overpressure generated by disequilibrium compaction by reducing permeability, but may not add to the overall pore pressure magnitude. The cements (and any carbonate or volcanic lithologies) will, however, result in faster shales such that wireline and seismic-based velocity data will under-predict the pore pressure. When building the geological- pressure model, it is critical to realise that the in-situ pore pressure is a function of the geological history that a rock experiences, which can be independent of the absolute age, i.e., pressure is controlled geological processes.
Introduction
There are many different elements to a play that require analogues to aid in de-risking, especially in areas with limited offset well data. Analogues are often focused on a similar basin-scale tectonostratigraphic framework, but there are many aspects to a geological-pressure model that must be de-risked, for example, sand-shale geometries, reservoir plumbing, TOC within shales, thermal evolution, and sedimentation rate. There are many examples of analogous processes and relationships that can de-risk the pore pressure from settings that wouldn’t be considered analogous if solely based on the basin-scale framework.
This paper aims to discuss the considerations that must be made when building a geological-pressure model and to show how the integration of global analogues can help in de-risking the magnitude of the pore pressures that are predicted, and provide confidence in the sub-surface facies distributions that help define the pore pressure model. There are several examples of analogous pairs of basins where one is more heavily drilled and thus provides a rich database, and the other has minimalto- no wells, yet shows significant potential for exploration. One such pair would be the deep-water areas of Mid-Norway (data-rich) and Labrador (data-poor), where the tectonostratigraphic framework is very similar on both sides of the Atlantic Margin. Other examples from French Guiana, Guyana, and Suriname include the Zaedyus, Jaguar, and Liza discoveries based on experience in West Africa.
One of the most important realizations when building a geological-pressure model is that the evolution of the in-situ pore pressure is a function of the processes a rock experiences, which can be independent of the absolute geological age, i.e., pressure is primarily controlled by vertical loading, thermal and chemical diagenesis, and the structural framework. For example, lessons from Cretaceous-aged rocks in one basin might be the appropriate analogue for a Tertiary-aged rock in another basin.
Constructing a Geological-Pressure Model
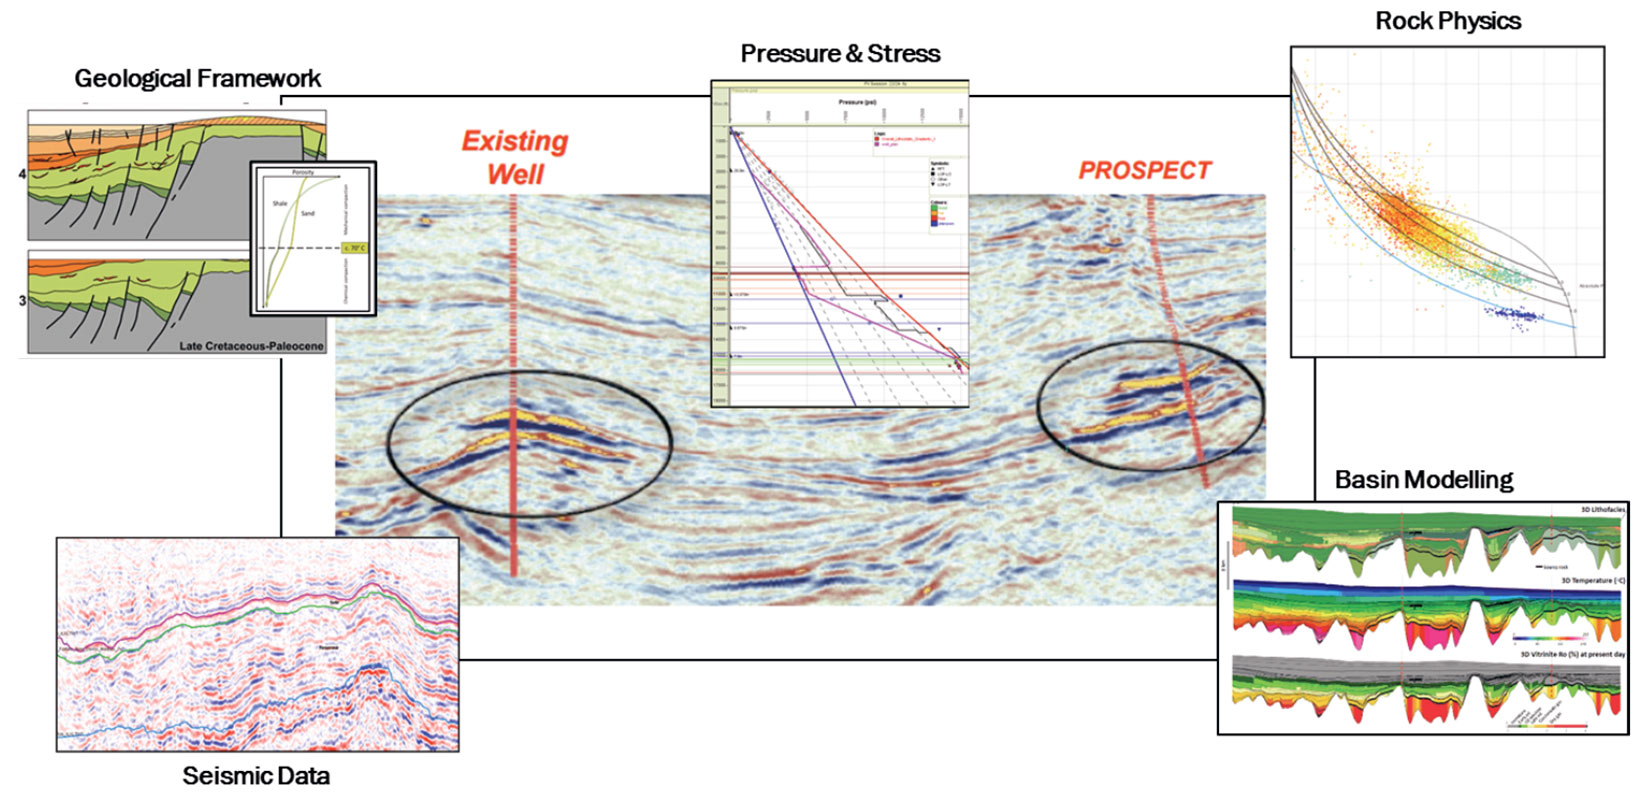
Constructing a pore pressure profile in deep-water plays involves several stages (Figure 1). Firstly, the lithofacies must be understood, partly from seismic reflectivity data and partly from analogue settings. Secondly, reservoirs often have different pressures to their associated shales; they can be lower via lateral drainage or higher due to lateral transfer. Thirdly, a frequent problem in wildcat situations, with little to no well calibration, is the reliance on seismic interval velocities for pressure prediction, as these data may not be suitable if the shales have undergone diagenesis. Lastly, pore pressure is assumed to be generated via vertical loading through sediment deposition and undercompaction of shales; in reality, other processes such as fluid expansion (e.g., Bowers, 1994) and load transfer (e.g., Lahann & Swarbrick, 2011) can increase the pore pressure beyond that predicted by standard techniques. Generation of a pressure profile requires that all elements discussed above must be considered.
a) Establishing the Geological Framework from Seismic Data
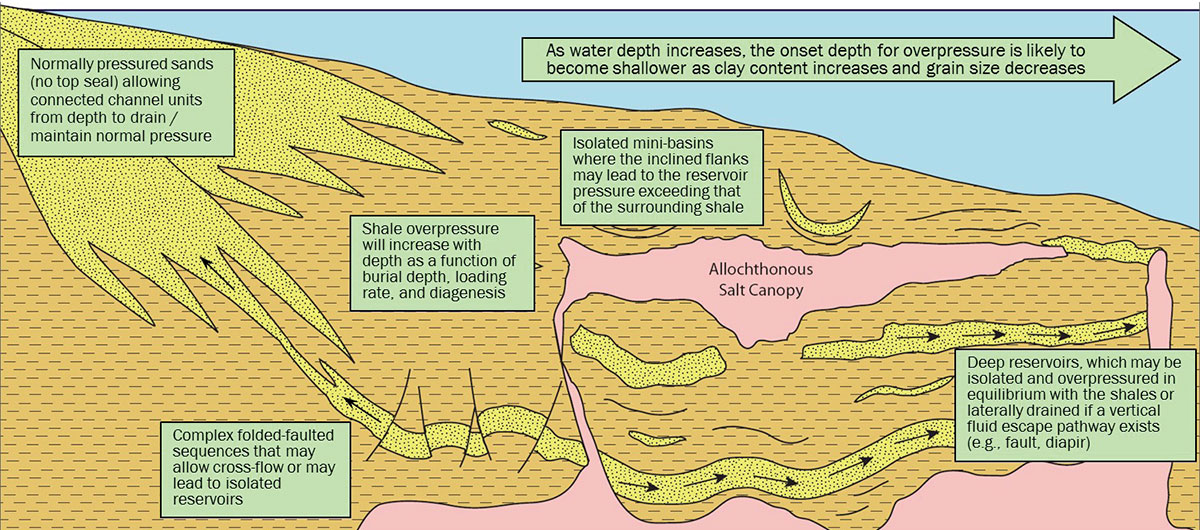
Seismic data can provide an important framework for a new basin / frontier play by helping to understand features such as stratigraphic thicknesses, large-scale structural features (faults and folds), and vertical and lateral velocity variations, as well as providing the ability to derive estimates of fluid distributions. Building an understanding of the geomorphological structure of the basin is a critical element that allows a generalist pressure model to be constructed; for example, if there is a variation in the sediment load across the region of interest, then this can be linked to a variation in the magnitude of pore pressure. Furthermore, if large-scale faulting is present, then an assessment of the potential for juxtaposition seals or cross-stratigraphic fluid flow can be performed. Seismic velocity data can be used to investigate if the pore pressure varies vertically and laterally, i.e., zones of anomalously slow data typically indicate area of high pore pressure. Figure 2 captures the range of sand-shale relationships typically experienced along the Atlantic Margin, including the interaction with structural features and salt bodies.
The key control on the distribution of pore pressure in deep-water areas is largely dependent on the rate of deposition of each facies. As discussed in Osborne & Swarbrick (1997), pore pressure due to vertical loading (disequilibrium compaction) is the dominant mechanism for generating pore pressure that should build along a trend parallel to the overburden (constant effective stress/constant porosity). Where net:gross (N:G) is low (as in the case of mud-rich fans) thin isolated reservoirs typically record high pore pressures where located within an overpressured shale. Where N:G is high, as in the case of sand-rich or amalgamated fans, single thick sand reservoirs are present and the pore pressure would be expected to form a gradient parallel to the hydrostatic gradient, i.e., a fluid-parallel gradient. Using these empirical relationships and a detailed understanding of lithology and facies, improved pore pressure and fracture gradient profiles can be built for well planning purposes.
For each offset well in a basin where the lithology is known, that lithology can be tied to the seismic reflectivity. Typically, strong reflectivity is only observed at a clear contact of two different lithologies, in this example sand-shale or shale-sand contacts where a large acoustic impedance exists. Further, the acoustic impedance changes with depth for sands and shales due to the “cross-over” in elastic response, i.e., shales are harder than sands in the shallow section but become softer than the sands at depth (Avseth et al., 2008). Where a thick package of contiguous sediment is present, there are often limited internal surfaces capable of generating strong reflections, hence the lithology model could be oversimplified if the experience from offset wells is not integrated. Subtle changes in shale composition can also create large impedance contrasts which may mimic a sand-shale interface, leading to a false lithological model in which permeable units might be interpreted when they are not actually present. Once the dominant lithologies have been determined from seismic reflectivity, the pore pressure within each package can modelled using the techniques outlined in this paper, including the dangers of an incorrect lithology model.
Green et al. (2015) presented a case study from the newly identified basins in offshore Labrador where the pressure profile was built using the interpreted lithofacies and stratigraphic thickness variation to derive a geological-pressure model that was then refined using global analogues, primarily from Mid-Norway, and offset wells from the Labrador shelf.
b) Understanding the Sand-Shale Inter-relationships
Pore pressure prediction in sands is not a recommended approach. The reason for this is that due to the enhanced reservoir properties (e.g., porosity and permeability), fluids can drain much more readily out of and into these units. Therefore, mineral cements can form (or secondary dissolution can occur) such that the porosity within the sands is no longer related purely to overpressure (or compaction state) as in shales. Pressure prediction methods, such as the commonly used Eaton technique (1975), are likely to produce incorrect pressure predictions in such scenarios.
One way to predict the likely reservoir pressure regimes in any deep-water reservoir is to use global analogues, assessing the end-member character of typical deep-water settings whereby sands are either connected over large distances or stratigraphically isolated (Figure 2). If reservoirs are encased in shales in three dimensions, then the overpressure in the reservoir will be similar to that of the surrounding shales. However, if the sands are extensive, as is common in some deep-sea fan depositional settings (Nise Formation, Mid-Norway; Lower Tertiary, Gulf of Mexico) and can connect to the sea floor via faults or continuous reservoir on to the shelf, then they may potentially lose pressure over geological time such that the reservoir overpressure is considerably less than the surrounding shales. This process is termed lateral drainage. Examples of lateral drainage are observed on the Labrador Shelf, where the Bjarni reservoirs are near normally pressured and the shale pressure estimated from wireline data (velocity, resistivity) show significant overpressure (O’Connor et al., 2013). In some cases the wireline-derived shale pressure curve will show shoulder effects above and below the reservoir as the shales are locally partially drained through association with the drained sands (Green et al., 2015).
Another consideration that must be assessed is the structural control(s) on the relationship between sands and shales (Figure 2). For example, if a sand is cross-cut by a fault then the fault may provide a pathway for the vertical migration of pressure from deeper (typically higher overpressure) to shallower units. The vertical transfer of pressure could lead to the shallow sand now being more overpressured than the surrounding shales or even result in the possibility of top seal failure; one example of this is from the Malay Basin (Tingay et al., 2007). The fault may play another role too, isolating a reservoir due to fault throw that may preserve pressure within the isolated sand that may otherwise drain to the rest of the sand body on the other side of the fault, as is commonly observed in the Jurassic reservoirs of the Jeanne d'Arc Basin, e.g., Terra Nova field. Such a scenario would mean that the variation in local offset well data informs on the uncertainty of any pressure model being developed.
Where sands are identified using reflectivity data, an estimate on whether these sands are likely to drain or be isolated, either through depositional or structural geometries, can be made based on such analogues as described above, and a range of pressure models for the area can be constructed to assess the likely uncertainty.
c) Integrating Temperature and Age with Log Response
Often, the predicted pressure from wireline curves and the measured pressure from direct pressure data will not match each other. As discussed above, the mismatch may be due to the open/closed nature of the sands within thick shales; however, the mismatch may also be due to an incorrect magnitude of the pore pressure prediction within the shales. The mis-prediction in the shales may be due to either of a combination of elevated temperature resulting in maturation of hydrocarbons or diagenetic alteration of the shales. In all cases the true pore pressure would be higher than the predicted pore pressure, as the wireline data record a low porosity rock (hard/fast signature) which implies low pressure, yet the actual pressure may still be high(er) magnitude.
Maturation of hydrocarbons can lead to secondary pressure being generated, a process typically referred to as fluid expansion, but the effect on the pore pressure can be quantified if enough well data are present; however, without well data it is not possible to quantify the effect. The solution necessitates a secondary pressure-porosity relationship to characterize the change in pore pressure mechanism (Bowers, 1994), whereas diagenesis/presence of carbonate material requires a switch from a data-driven solution to a model-driven solution. The need for multiple compaction models is commonplace in various basins worldwide where deep targets are the focus, e.g., West Africa, where Cretaceous targets are currently being explored (unpublished data). It is worth noting that as these are primarily thermally-driven processes, the geothermal gradient is key; for example in the Malay Basin the effect may be observed at approximately 2.0-2.5 km due to the 50°C/ km gradient (O’Connor et al., 2011), whereas in the Gulf of Mexico the same effects are have been observed deeper than 4 km (Lahann, 2001) yet may not be present in the deep-water part of the basin at depths in excess of 7 km (e.g., Hauser et al., 2013).
Alternatively, the mis-prediction could be due to the presence of carbonate-rich shales, i.e., a lithology effect. Focus in this section is on the diagenetic alteration of shales and carbonate-rich shales. Significant change in the character of the shales occurs in the Cretaceous in most explored basins globally, with an increase in carbonate material (calcareous shales, intercalated limestone and/or dolomite) due primarily to the warmer climate and development of shallow inland seas. These lithologies may demonstrate no porosity/effective stress relationship such that pore pressure prediction using wireline data and/or remote data (seismic velocity) is fundamentally flawed as is the case in carbonates (Jenkins et al., 2012).
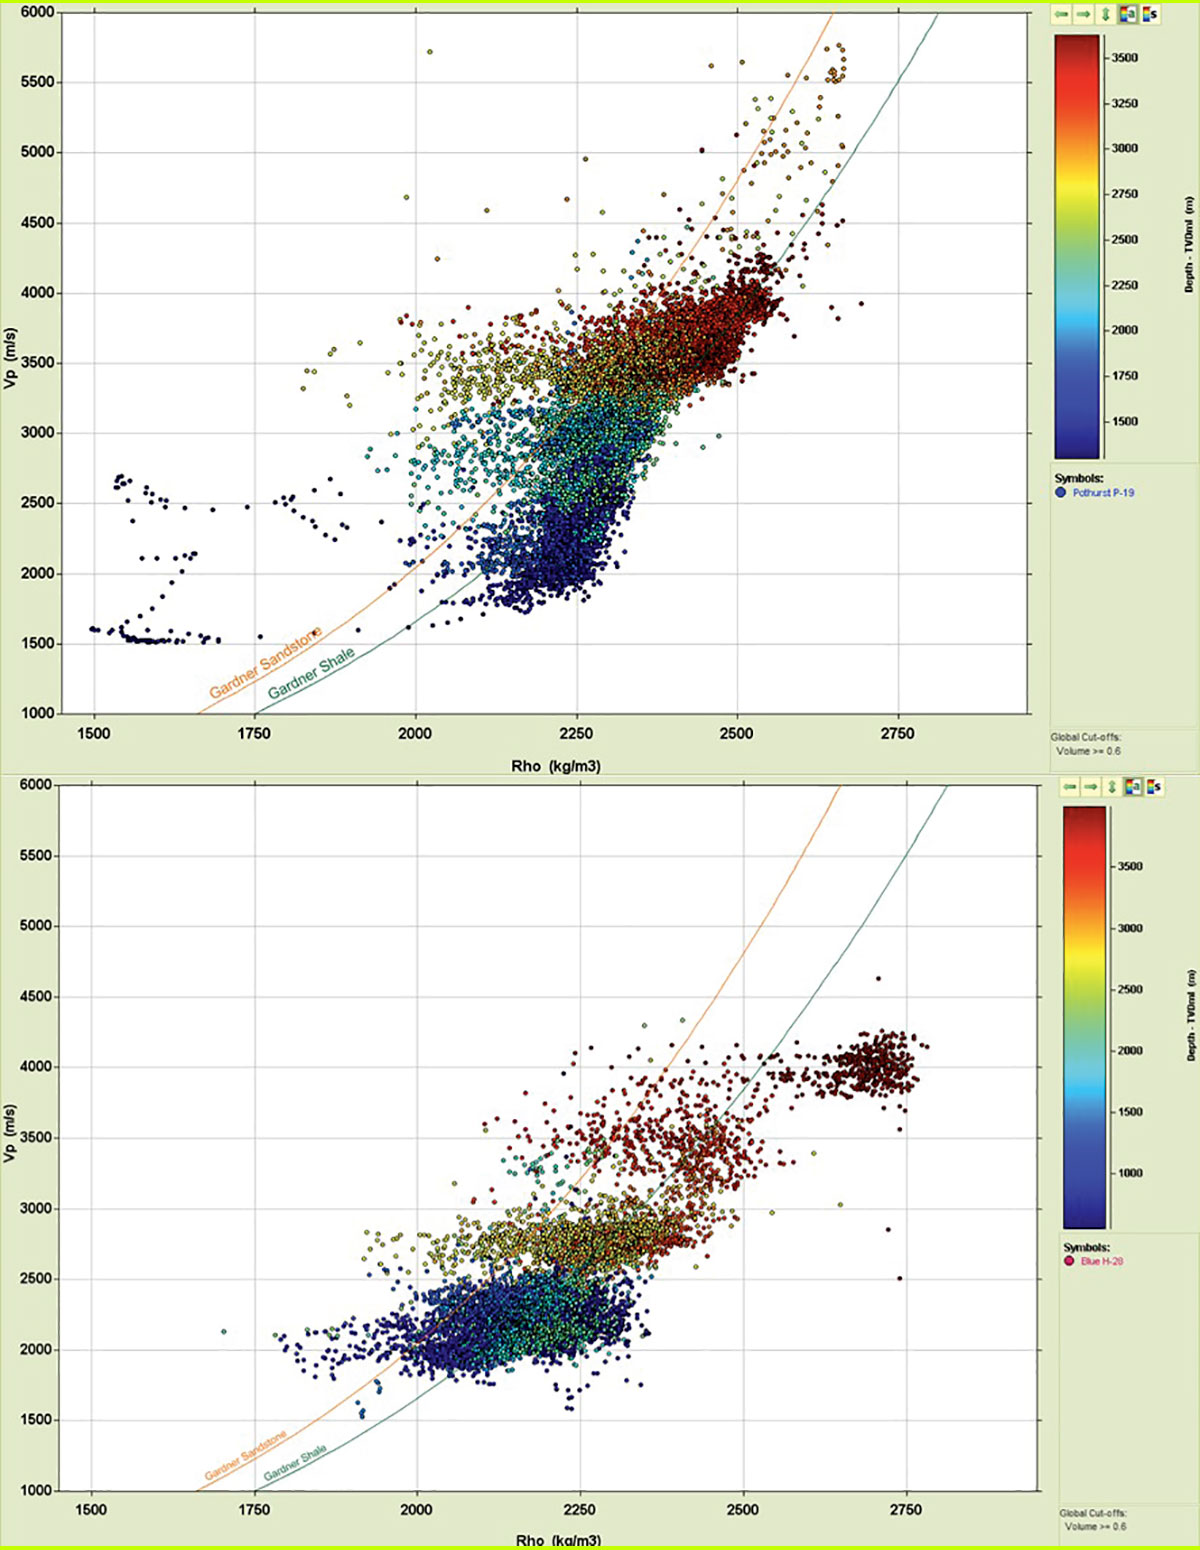
The observation of non-shale lithology or chemical alteration of shales can be verified using velocity-density cross-plots (Swarbrick, 2012). Figure 3 shows velocity-density cross-plots for Pothurst P-19 (upper) and Blue H-28 (lower) from the Labrador Shelf and Orphan Basin, respectively. In each plot the entire well is shown with a V-shale cut-off of 0.6 applied. The published sand and shale trends from Gardner et al. (1974) are shown as reference lines and have not been locally calibrated. The shale data from Pothurst P-19 are all from the Tertiary and do not deviate from the Gardner shale trend, indicative of disequilibrium compaction as the sole pressure mechanism. However, the density values exceed 2500 kg/m3 which suggest low porosity. As the bottom hole temperature (BHT) is less than 100 ºC and the rocks are still Tertiary, it is likely that the high density values correspond to subsidiary quartz or carbonate, i.e., a small volume of material within the shales rather than diagenetic shale alteration. By way of contrast, Blue H-28 has relatively low density Tertiary shales (Figure 3), which are interpreted to have high porosity and are consistent with disequilibrium compaction as the sole pressure mechanism. However, the Cretaceous shales (>3500 mTVDbsf) are very high density (>2650 kg/m3) and plot off of the standard Gardner shale trend (green lines on Figure 3). For the same velocity, at the same depth, the Cretaceous shales are denser than the Tertiary shales in Pothurst P-19. The same observations as from Blue H-28 are also made in several wells in the Saglek Basin in northern Labrador (Gilbert F-53, Karlsefni A-13 and Rut H-11), all of which have a BHT in excess of 100ºC (as does Blue H-28), a known threshold for secondary diagenetic processes in clay-rich shales (e.g. Lahann et al., 2001 and the references within) that lead to changes in velocity and/or density via cementation.
The critical impact of cementation is that the wireline-derived pressure predictions underpredict the true shale pressure where the shales are faster/denser as a result of cementation. Therefore, it is likely that (a) quartz cement reduces permeability and seals overpressure generated by disequilibrium compaction rather than acting to increase overall overpressure in excess of that generated by loading, and that (b) the effects are limited to the Basal Tertiary and Cretaceous in the deep-water, depending on depth, age, and geothermal gradient. This latter point is supported by the published deep-water analogues that suggest that disequilibrium compaction is the dominant pore pressure mechanism in Tertiary sediments, i.e., no/minor thermal/time-driven diagenetic processes are active. Such observations have been made in the Gulf of Mexico (Hauser et al., 2013; Yu & Hilterman, 2014), and in the Black Sea (Marin-Moreno et al., 2013).
d) Building a Process-Driven Pressure Model
To produce an interpretation of pore pressure in a frontier area typically requires a reliance on seismic interval velocities. However, it should be noted that seismic interval velocity data are, at best, a smoothed version of the wireline velocity data; therefore, any fluid expansion or cementation effects noted in the wireline data will be manifest in the seismic data, i.e., cemented rock signatures present in the log data will also be present in the seismic velocities. Thus the same limitations apply and a geologically-driven solution is required to supplement the overall pressure model where direct data cannot be relied upon.
In frontier basins, determining the subsurface pore pressure is inherently challenging for the reason outlined above. Typically, offset well data are rare or irrelevant, and the primary dataset is limited to seismic interval velocities with some form of interpretation of the geological depositional system. As a result, making any assessment of the pore pressure is problematic. One of the keys methods to unlock the potential of the deep-water blocks (e.g., Guyana, Suriname) and to ensure successful exploration in the future is to adopt different approaches and include as much geological understanding as possible into the study to ensure consistency.
One approach is to apply best practice pore pressure prediction methods extrapolated from known areas on the shelf to the frontier deep-water domain (e.g., Labrador). The geopressure model built must explain the current overpressure occurrences, taking into account the local geology and analogous areas (structure, stresses, temperature, basin history, sedimentation rates, and depositional architecture). Using the geopressure model, we can then sense-check seismic velocity- based pore pressure predictions together with basin modeling performed in an uncalibrated area.
In the uncalibrated area, further constraints can be placed on the pressure variabilities by incorporating seismic inversion schemes in order to determine a range of plausible geological outcomes that fit with prior knowledge of rock types (from adjacent wells and literature review), rock physics relationships, seismic interpretation, and pre-stack amplitude data. Typically, uncertainties around pore pressure variations can then be captured using scenarios and compared with simplistic 2D-basin models to ensure consistency and optimize well design (Edwards et al., 2017). The 2D-basin models in these instances can prove instrumental in testing the sensibility of the forecasts, notably the magnitude of the high cases and the impact of different shale types, e.g., varying porosity/permeability relationships, which may not be known pre-drill. The advantage of 2D-basin models in these instances is that predictions based entirely on seismic interval velocities would fail to fully capture the pressure variabilities, particularly where silty and / or mixed-lithology’s are present. By utilizing such models, tests can be performed to investigate ranges of expected net-to-gross (N:G) present and 3D connectivity (or not) to deliver more detailed lithology prognoses at the chosen well plan location in order to constrain the expected pressure ranges (Green et al., 2015; Edwards et al., 2017).
Conclusions: Use a Systematic Approach to De-risk Pore Pressure
To aid in de-risking a frontier area requires establishing the geological framework of the region of interest. Seismic data can provide this important framework for a new basin / frontier play by helping to understand features such as stratigraphic thicknesses, large-scale structural features such as faults and folds, and vertical and lateral velocity variations, as well as providing the ability to derive estimates of fluid distributions. One of the most important elements when building the geological-pressure model is recognizing that the evolution of the in-situ pore pressure is a function of the processes a rock experiences, which can be independent of the absolute geological age, i.e., pressure is primarily controlled by vertical loading, thermal and chemical diagenesis, and the structural framework. A key data source to supplement the geological-pressure model built based on the framework established from seismic data is the integration of global analogue data, which typically allow for pressure-generative processes/mechanisms to be quantified based on offset well data and translated via comparison of the geological framework in each area.


Join the Conversation
Interested in starting, or contributing to a conversation about an article or issue of the RECORDER? Join our CSEG LinkedIn Group.
Share This Article