During 2013 and early 2014 a test program was carried out to evaluate a multi-electrode, High Resolution Resistivity/ Induced Polarization (HRRIP) system over 9 mineral deposits within the non-glaciated region of the Yukon. The HRRIP system was chosen over conventional resistivity/IP systems used in the mining industry for the following reasons: 1) The lack of glacial material overlying these deposits means they can be mapped at depths less than 70 to 80 m, 2) conventional systems require the use of large generators to generate the current, with corresponding large field crews, and often require line cutting whereas the HRRIP systems can be used with limited or no line cutting, 3) the HRRIP systems only require a battery operated current source with a crew of 3 to 4 personnel and are therefore portable and light weight, 4) this means the HRRIP systems are faster, cheaper, and leave a smaller environmental footprint. The HRRIP systems are therefore an economic and environmentally friendly way to explore for these targets because exploration costs are reduced with smaller crews and less time spent collecting the data in the field.
HRRIP systems have been used within the environmental and engineering geophysical community for more than 30 years. Typical applications include locating aggregate, groundwater mapping, salt water intrusion into fresh water aquifers, contaminant and leachate mapping, shallow landslide hazard mapping of slip planes, porosity and potential debris volumes and locating buried tunnels and sink holes. These systems are ideal for follow-up of exploration targets in non-glaciated environments since they can map shallow resistivity and IP structures potentially associated with mineralization and/or alteration products to depths between 70 and 80 m.
The geology of the nine deposits is well known and they have been extensively drilled to outline mineralization. They are perfect deposits for testing the HRRIP system. The deposits were selected to provide different deposit types, different structural styles and different metal content (Au, Ag. Cu, Pd, Zn). The resistivity and IP responses depend on the host rock of the deposit as well as the type of mineralization associated with the deposit. For example, the stockwork structure of a porphyry copper deposit containing disseminated sulphide mineralization has a distinct IP response.
The primary goal of the study was to investigate if these high resolution systems could be used to map known mineralization and structure. In particular, for which deposit types and/or geological situations does the method work and are there deposits where the inversions are inconclusive or incomplete. By understanding the geophysical response over deposits with known geology and mineralization we learn how the HRRIP method can be more effectively utilized in prospective areas where the geology and mineralization are not that well known. A second goal was to investigate which array type(s), if any, were most effective for mapping the different deposit types. The nine deposits selected to test the HRRIP method provided a cross section of the target types and mineralization outlined above.
This paper summarises the main results of the study and provides example inversions from the Klaza gold deposit.
HRRIP methods
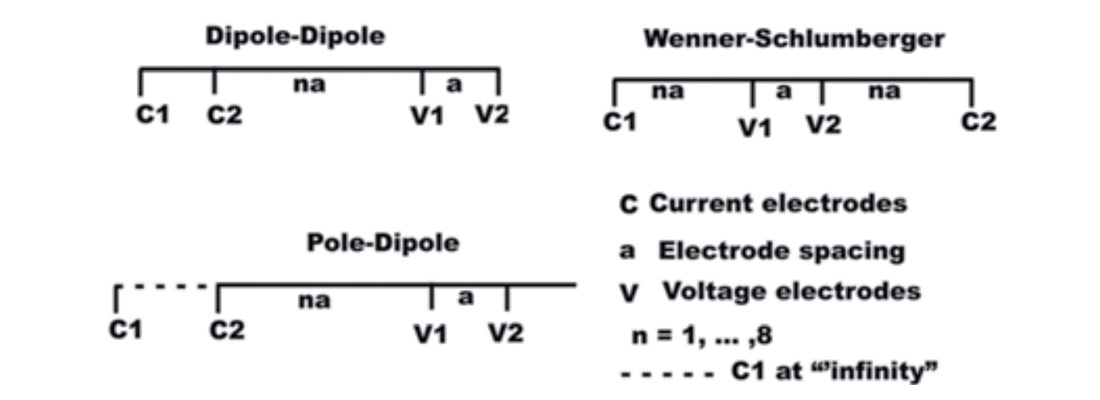
Multi-electrode, high resolution, shallow resistivity/IP systems are a light weight version of traditional resistivity/IP systems used for mineral exploration. Their main advantage is they are portable, light-weight, and do not require large generators for the current. For example, an 84-electrode 2D array with an electrode spacing of 5 m covers a distance of 415 m and, depending on the array used, images the upper 50 to 100 m of the subsurface. In addition, the smaller electrode spacing provides good lateral resolution. Longer lines are obtained using roll-along techniques similar to those utilized within the seismic industry. These systems can collect data using common arrays (Fig. 1) such as dipole-dipole, pole-dipole, pole-pole, and Wenner-Schlumberger (or inverse Wenner-Schlumberger), as well as specialized arrays such as the strong gradient array developed by Advanced Geoscience Inc (AGI). See Best et al. 2014 for further details of the arrays. Each array has its strengths and weaknesses when imaging the subsurface. A comparison of using a battery versus a generator was carried out at the Brewery Creek case study (Figure 4). The results showed that batteries provided a more stable current (Best et al, 2014). Hence all the case study tests were carried out using batteries.
An Advanced Geosciences lnc. (AGI) Supersting multi-electrode resistivity/IP system with 84 electrodes was used to collect the resistivity and induced polarization (IP) data. The electrode spacing was fixed at 5 m for this case study, providing a spread length of 83 x 5 = 415 m. Most lines were short enough so that only a single spread length was necessary. Those lines longer than a spread length were obtained using the roll-along option of the Supersting System.
The current (I) and voltage (V) were measured for each electrode pair and converted to an apparent resistivity (ρa) using the following formulas (Sumner, 1976).
Dipole-dipole ρa = π (V/I) n(n+1)(n+2)a; Pole-dipole ρa = π (V/I) n(n+1)a; Schlumberger (inverse Schlumberger) ρa = π (V/I) n(n+1)a; Wenner ρa = 2π (V/I)
where V is the measured voltage (volts), I is the injected current (amperes), a is the spacing between the electrodes (m) and n is a multiple of the electrode spacing (5, 10, 15 m, etc., i.e. n = 1, 2, 3, etc.). The apparent resistivity computed from the above equations equals the actual resistivity of the subsurface only for the case of a homogenous earth. The inverse Schlumberger array is the same as the Schlumberger array except the current and voltage electrodes are interchanged (reciprocity theorem).
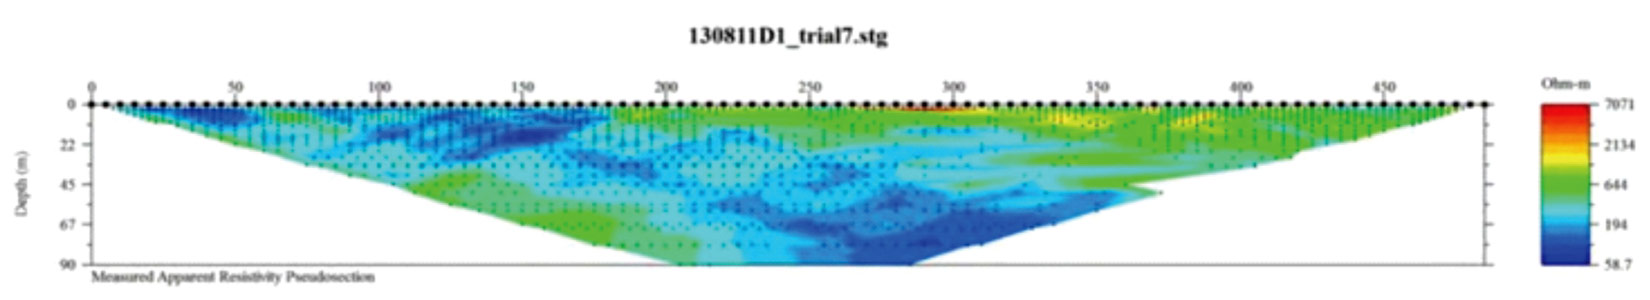
The resistivity data were presented as an apparent resistivity pseudosection (Fig. 2). If the subsurface was not a simple homogenous layer then the actual resistivity must be determined from inversion of a forward model. The forward model can be a 1D, 2D or 3D. We used a two-dimensional inversion program (Earthimager software developed by AGI) because 3D data collection is time-consuming and expensive and we collected the profiles with lines placed parallel to known strike in order to keep the interpretation as close to 2D as possible.
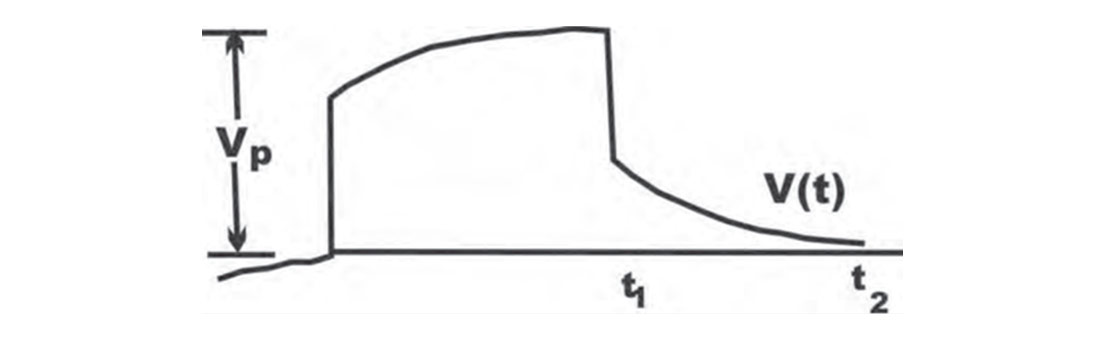
The Supersting system measures the induced polarization and apparent resistivity at the same time. The unit of induced polarization measured by the Supersting is chargeability (M) with units of mV/V or ms. Chargeability is a measure of the integrated decay voltage as shown in Figure 3 (Sumner, 1976) and is computed from integrating the voltage decay curve after the current is turned off; in other words:
M = 1/Vp∫V(t) dt (integrated from times t1 to t2)
where the voltage Vp is the same voltage used in the equations for the apparent resistivity and is the voltage just before the current is turned off as shown in Figure 2.
The Supersting collects the IP data in 6 time windows starting from time zero and spaced logarithmically. The six voltages (or subset of them) are averaged and divided by the initial (time zero) voltage VP to provide the chargeability. The voltages in the 6 time windows are stored so the user can determine which ones to use during further processing. At least 4 of the voltages must be used in order to produce statistically meaningful chargeability values. The IP data were plotted as IP pseudosections. The Earthimager software uses a forward model (Sumner, 1976) in order to obtain the sub-surface chargeability distribution. The process is similar to that carried out for resistivity inversions.
Minimal line cutting was needed for the AGI Supersting system since the multi-element cable is lightweight and required little effort to move it around in the field . The cable is segregated into 6 sections, each with 14 electrodes to make up the 84 electrode system. Three sections were placed behind the console and 3 were placed in front of the console, making the console the center point of the spread. When a line required roll-along either one or three of the back sections were moved to the front and the console was moved to the new center position. In most instances it only took a few hours to get a single spread ready for data acquisition. Soaking the electrodes to reduce the contact resistance and ensuring they are properly connected to the cable takeouts required the most time. Once all of the electrodes were connected and soaked it took several hours per array type to collect all combinations of current and voltage electrodes for a single spread. A significant amount of the time is for averaging the voltage signal to improve signal-to-noise. The same spread, however, was used for multiple array types without making any physical changes to the cable layout.
The final 2D resistivity and chargeability inversions were output as xyz files for input into Geosoft to produce the sections in the report.
Location and regional setting
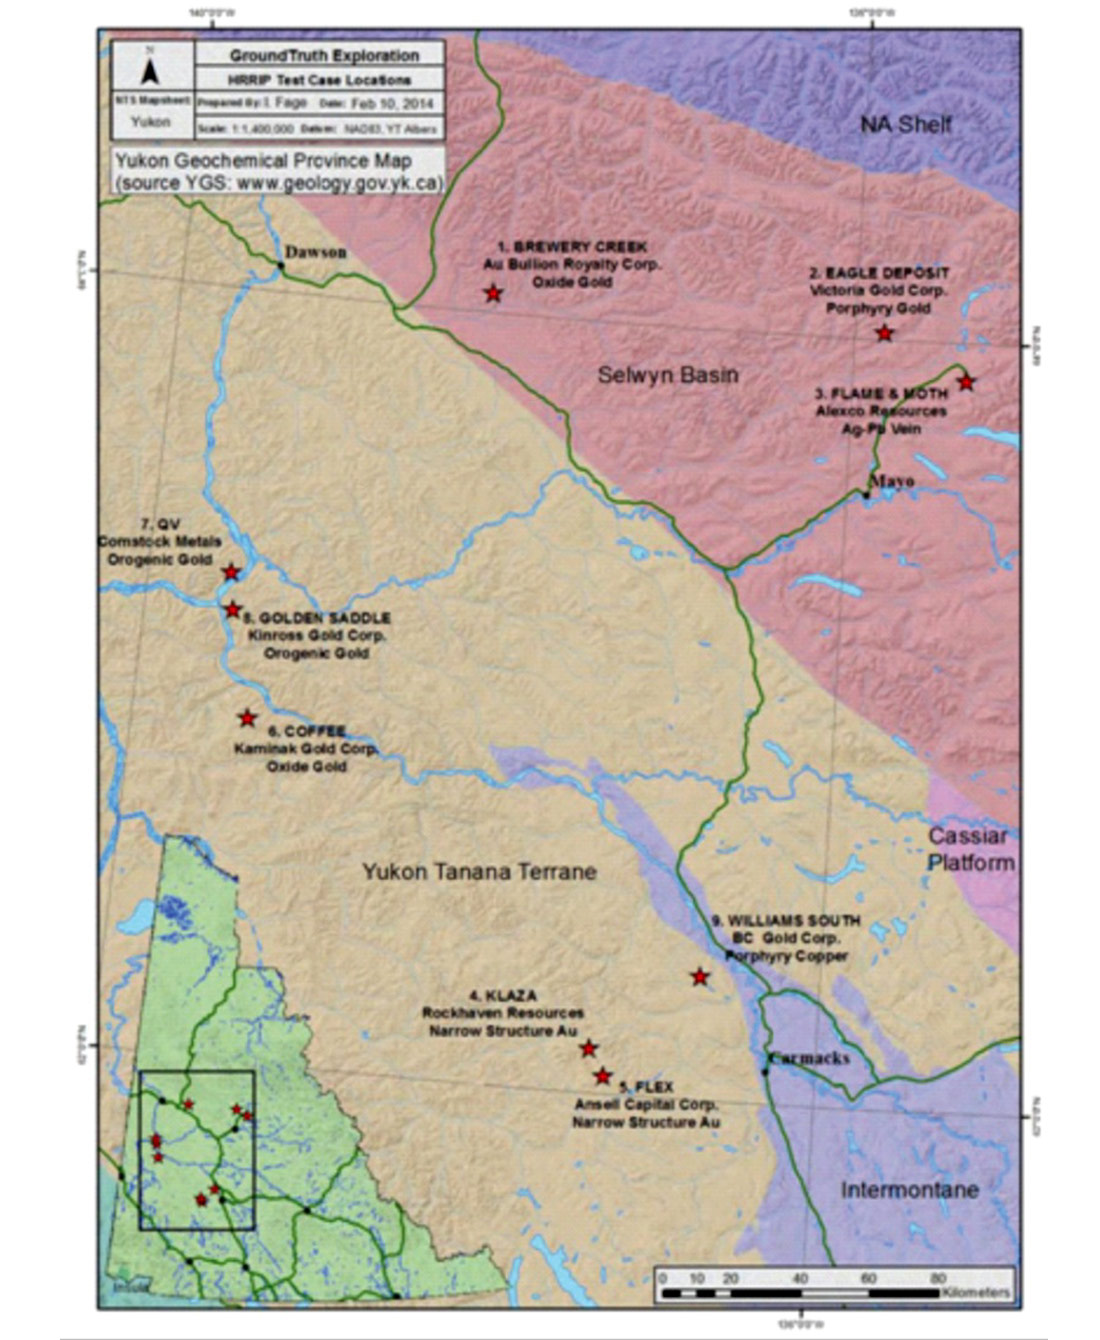
The locations of the 9 case studies are shown on the Yukon terrane map in Figure 4. Brewery Creek (CS-1), Dublin Gulch (CS-2), and Flame/ Moth (CS-3) are east of the Tintina fault and lie within the Selwyn basin. The other case study targets are located west of the Tintina fault and lie within the Yukon Tanana terrane, a pericratonic sequence that extends from northern British Columbia, through Yukon, and into southern Alaska (Colpron et al., 2006; Wainwright et al., 2011). The Yukon Tanana terrane consists of Paleozoic schist and gneiss that were deformed and metamorphosed in the late Paleozoic, and intruded by several suites of Mesozoic intrusions that range in age from Jurassic to Eocene (Mortensen, 1992; Colpron et al., 2006). From Late Permian to Early Jurassic, the rocks were tectonically stacked along foliation- parallel thrust faults (Mortensen, 1992; Berman et al., 2007).
Klaza (CS4) example
Geological setting
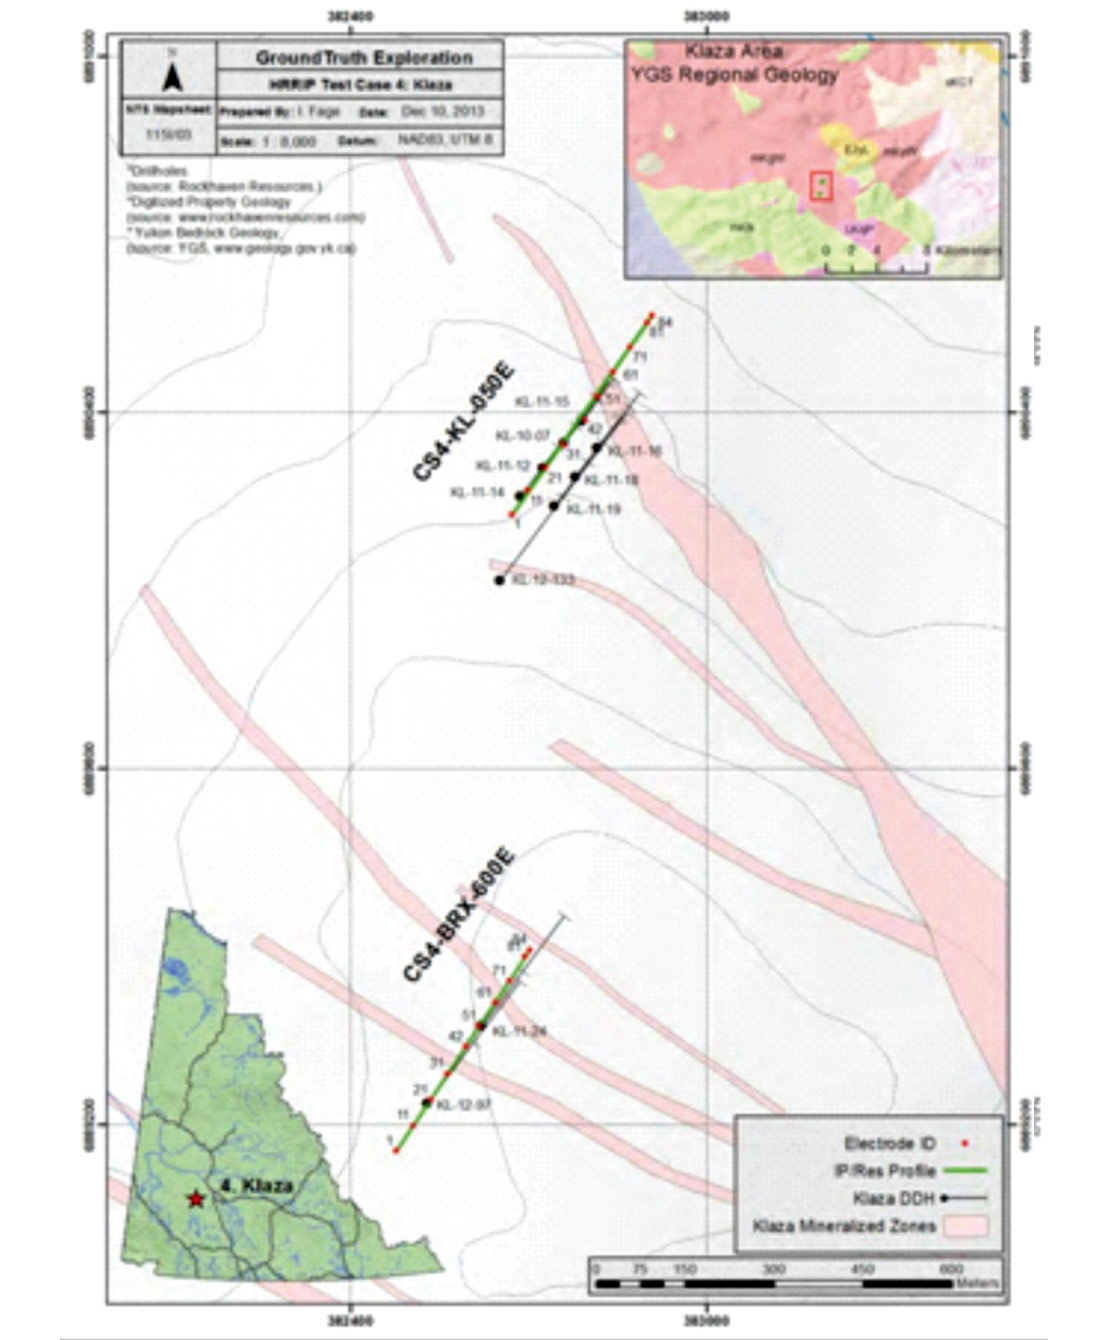
The Klaza property (Figure 4), a gold-silver vein/breccia occurrence in the south Dawson Range, is located in the Mt. Nansen area west of Carmacks within the Paleozoic Yukon-Tanana terrane. Mineralization is hosted in Mid-Cretaceous granodiorite and is associated with four distinct southwest-dipping faulted zones: the Klaza, BYG, Herc, and BRX zones. Lewis and Burke (2011) described galena, arsenopyrite, pyrite and sphalerite-bearing veins and breccia, and noted phyllic and argillic alteration of breccia clasts and in the adjacent granodiorite wall rock. The high resolution resistivity/IP survey was carried out over the BRX and Klaza zones (Figure 5).
Geophysical survey
Field work
Dipole-dipole extended (see Best et al., 2014), inverse Schlumberger, and strong gradient array data were collected on lines KL-050E and BRX-600E (Figure 5). The length of these lines was 415 m (a single spread length) for all arrays. The average RMS error of fit for these 6 arrays (3 per line) was 2.91% with the highest value equal to 4.2% for the dipole dipole extended array on line BRX-600E. These lines had a very high signal-to-noise ratio providing excellent high quality data.
Interpretation
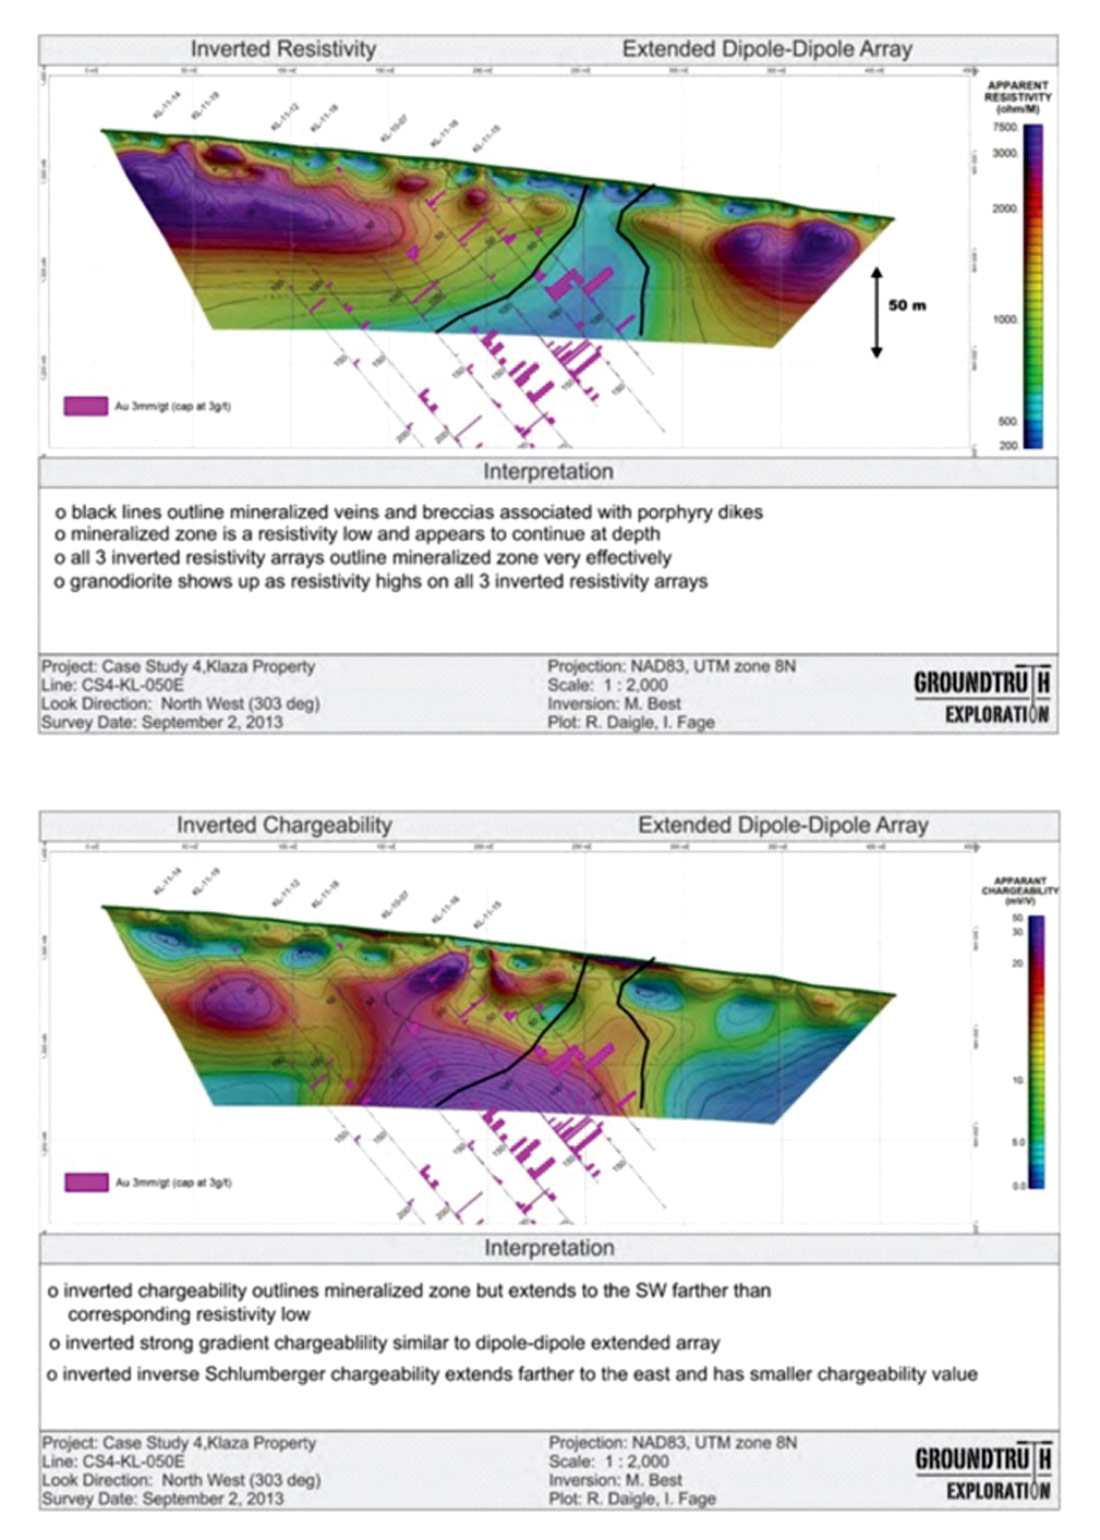
The resistivity and chargeability inversions for the dipole-dipole extended array for line KL-050E, including borehole geology and gold grade, are shown in Figure 6. The black outline is a resistivity low associated with a chargeability high over the mineralized vein and breccia zone. The HRRIP survey indicates these features extend in depth, consistent with the borehole results showing the mineralization also continues at depth. All 3 arrays (dipole-dipole extended, inverse Schlumberger, and strong gradient) on this line showed similar results. The granodiorite showed up as a resistivity high as expected. However, the chargeability values were quite variable. The individual veins and fracture zones did not show up since they were too narrow. but the mineralized zone containing all these individual fractures showed up quite nicely.
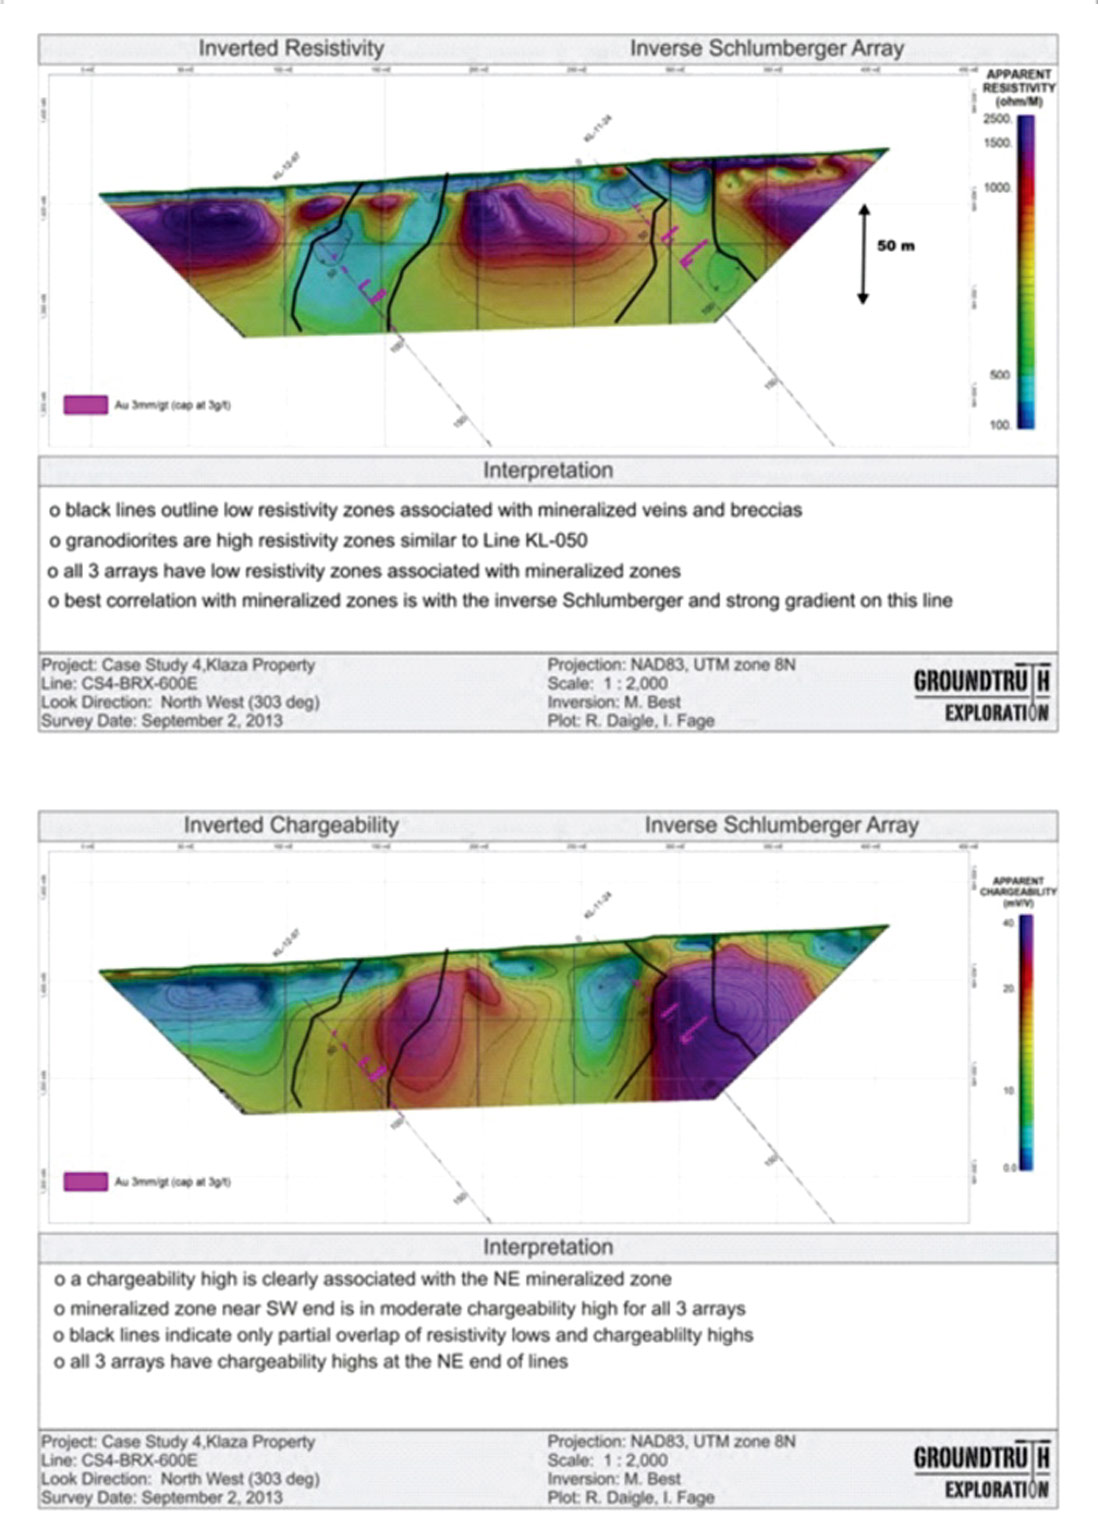
The resistivity and chargeability inversions for the inverse Schlumberger array on line BRX- 600E is presented in Figure 7. The results were generally consistent with those for line KL-050E. There were two mineralized zones along this line (outlined by black lines) with resistive granodiorite surrounding them. As before the inverted resistivity tended to agree more closely with the mineralization than the chargeability, although they both outlined the general mineralized zones. The mineralized zone at the NE end of the line had a large chargeability feature associated with it but the zone near the SW end only had a moderate chargeability. This was consistent with all three of the arrays. The black lines indicated only partial overlap between resistivity lows and chargeability highs on this line.
Summary and conclusions
The HRRIP method turned out to be a fast, efficient, and environmentally friendly approach to explore for mineral deposits in non-glaciated regions of the Yukon. Agreement between known geology and mineralization and the inverted profiles was generally good. In some of the test cases chargeability was effective in locating areas of mineralization and in others resistivity outlined structure and geological formations.
Below are a few general observations.
- gold mineralization associated with sulphide and/or clay alteration often produced a chargeability response.
- resistivity lows were usually related to metasedimentary rocks. Mineralization can be associated with the contact between metasediments and the surrounding resistive rocks (see for example the Eagle deposit case study (CS-2) in Best et al., 2014).
- inverted resistivity profiles provided information on structure and geology which can be used for locating targets of potential mineralization.
- most of the inverted resistivity profiles contained a near surface (approximately the upper 10 to 15 m) section containing numerous high resistivity features related to patches of permafrost.
The study, however, did identify inconsistencies between inversion results, both resistivity and IP, from different arrays along the same line (Best et al., 2014). This points out the importance of using both for interpretation.
The study showed that different geological settings and/or type of mineralization influenced the response of a given array type. The characteristics of one deposit type leads to low resistivity values, for example clay alteration and/or sulphide mineralization, whereas the characteristics of another deposit type leads to high resistivity values, for example quartz veins. Similar arguments hold for how deposit type affects chargeability.
Dipole-dipole and extended dipole-dipole arrays have been shown to have excellent lateral resolution, particularly for inverted resistivity. On the other hand the inverse Schlumberger array, and its extended version were effective at locating chargeability features associated with mineralization. The strong gradient array was somewhere between these two with regard to resistivity resolution and imaging mineralized zones with the chargeability. The location of the “infinity” current electrode influenced the response of pole-dipole arrays and led to asymmetric pseudosections . The depth of exploration for a pole-dipole array is approximately 50% more than the other arrays for a given “a” spacing and fixed number of electrodes. Near-surface resolution, however, was poorer for the pole-dipole array than for the other arrays. Merging pole-dipole data with “infinity” electrodes placed at opposite ends of the spread eliminated any asymmetry associated with single “infinity” locations.

Related Reading


Join the Conversation
Interested in starting, or contributing to a conversation about an article or issue of the RECORDER? Join our CSEG LinkedIn Group.
Share This Article