Introduction
The Oil Sands reservoir related to the Long Lake South (LLS) Project is contained within the McMurray Formation, which is the basal unit of the Lower Cretaceous Mannville Group. The McMurray Formation directly overlies the Subcretaceous Unconformity, which is developed on Paleozoic carbonates of the Beaver Hill Lake Group, and overlain by the Clearwater and Grandrapids Formations of the Mannville Group.
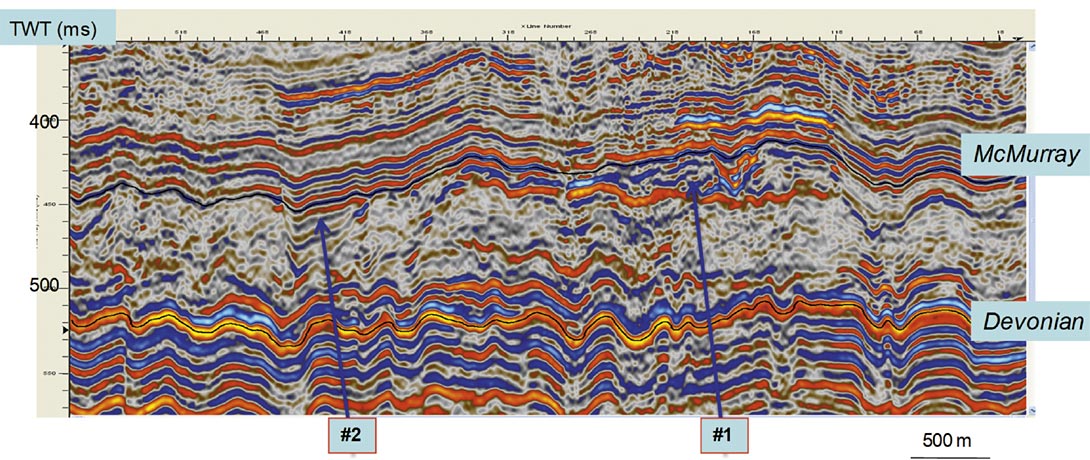
A typical EW seismic line (IL-562) from the prestack time migrated volume, is presented in Figure 1 (Dumitrescu et al., 2009). The reservoir is between the McMurray and Devonian horizons. This high-quality seismic data reveals large-scale depositional elements such as sand-dominated point-bar deposits (#1) and mud-dominated abandoned channel fill deposits (#2).
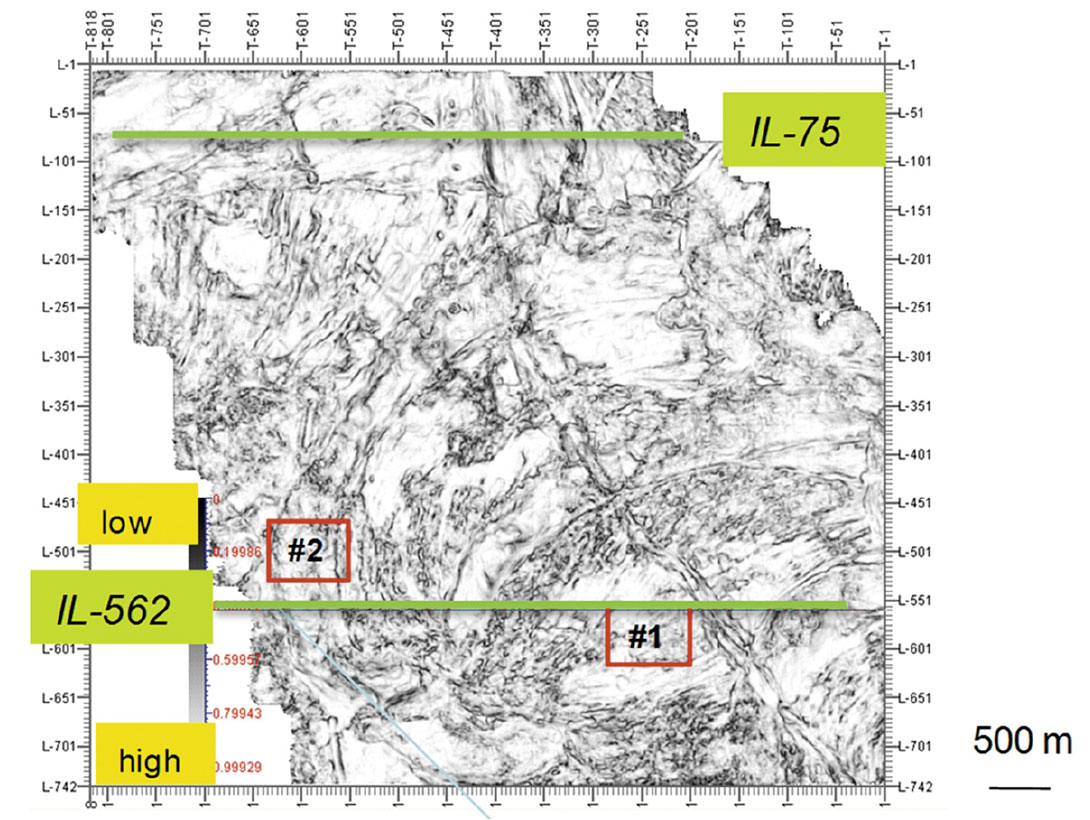
These depositional elements can be visualized on horizon time slices on the edge detector volume attributes such as semblance and volume curvature (most negative, most positive and dip curvature) calculated on the prestack time migrated volume. Figure 2 is an example of a horizon time slice at McMurray +10 ms of the semblance attribute.
Depending on their size and configuration, non-reservoir shale bodies can impede steam chamber growth and fluid drainage within a steam assisted gravity drainage (SAGD) production process. Distinguishing between reservoir and non-reservoir using a conventional seismic interpretation approach has proved ambiguous. However, petrophysical analysis has determined that Vp/Vs and density are key discriminators between sand and shale. Therefore deriving Vp/Vs and density volumes from seismic data is a useful and important objective.
For this project, the processing was designed to preserve prestack amplitudes and involved true amplitude recovery, noise attenuation, statics, and prestack time migration. The results from prestack inversion were used as input data for the neural network analysis (NNA). Neural networks analysis was used for estimating a new seismic volume by integrating well information and several seismic volumes. The estimated Vp/Vs ratio volume in combination with the density volume was used in mapping bitumen sands in heavy oil reservoirs.
Method
The LLS Project includes 3D seismic and approximately 50 logged and cored wells over a 50 square kilometer surface area. The 3D seismic was acquired in 2005 using the Sercel digital multicomponent recording system. Out of 42 wells with dipole sonic logs only 31 were used in the NNA. Petrophysical analysis was performed on all the wells in order to provide a trustworthy set of logs for inversions and neural network analysis.
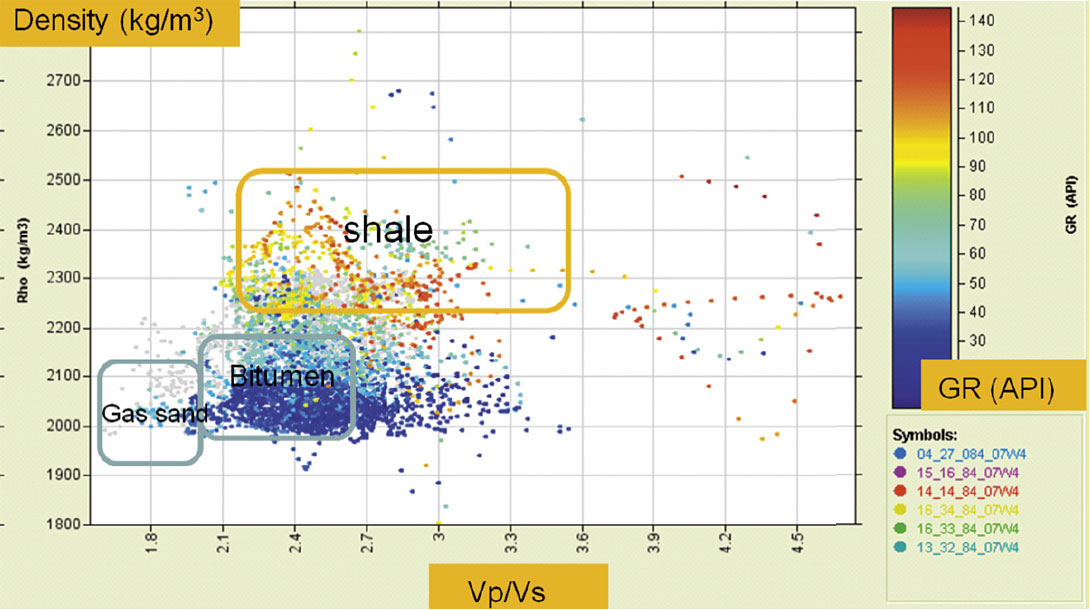
Crossplots of several properties over the target interval showed a good separation between gas sand, bitumen sand and shale. The crossplot in Figure 3 is between density and Vp/Vs logs from wells in the study area. The three zones, gas sand, bitumen sand and shale, are defined based on the associated histograms. The gas sands have low density and the lowest Vp/Vs ratio, the bitumen sands have low density and Vp/Vs values that vary with bitumen quality, and the shales have high values for densities and Vp/Vs.
The neural network was used in an effort to account for non-linear relationships between logs and seismic after first testing the linear multi-attribute method alone. Neural network analysis has four steps: 1. perform a multi-attribute step-wise linear regression and its validation, 2. train neural networks to establish the nonlinear relationships between seismic attributes and reservoir properties at well locations, 3. validate results on the wells withheld from the training, 4. apply trained neural networks to the 3D seismic data volume. The NNA was performed for 31 wells and eight seismic volumes (PSTM stack, AVO-derived P-wave and S-wave reflectivity, fluid factor, P-wave impedance, S-wave impedance, Vp/Vs from inversion and density from a previous NNA) and a sevenpoint operator. Using the ranking process available within the software and after checking the errors, we selected the attributes for training the network.
Results
The logs resulting from petrophysical analysis were used in the prestack inversion and in the neural networks analysis. Only the well ties with good correlations were used in the analysis (31 out of 42 wells). For each of the wells, the data used in the training procedure were the Vp/Vs curves, along with the extracted seismic attributes at each well. For each of the reflectivity traces (PSTM stack, AVO-derived P-wave and S-wave reflectivity, fluid factor), we used not only the trace itself but also transforms of this trace, such as instantaneous phase, instantaneous frequency, etc.
In the first step of the NNA we performed a multi-attribute stepwise linear regression and its validation. The analysis indicated the optimum number of attributes to be used (nine) and their ability to predict the Vp/Vs logs. The correlation coefficient between the actual and the predicted result was equal to 0.73 and the prediction error was 0.22. The validation was computed by leaving out one well at a time and predicting its values using the other wells in the training and the defined linear relationship.
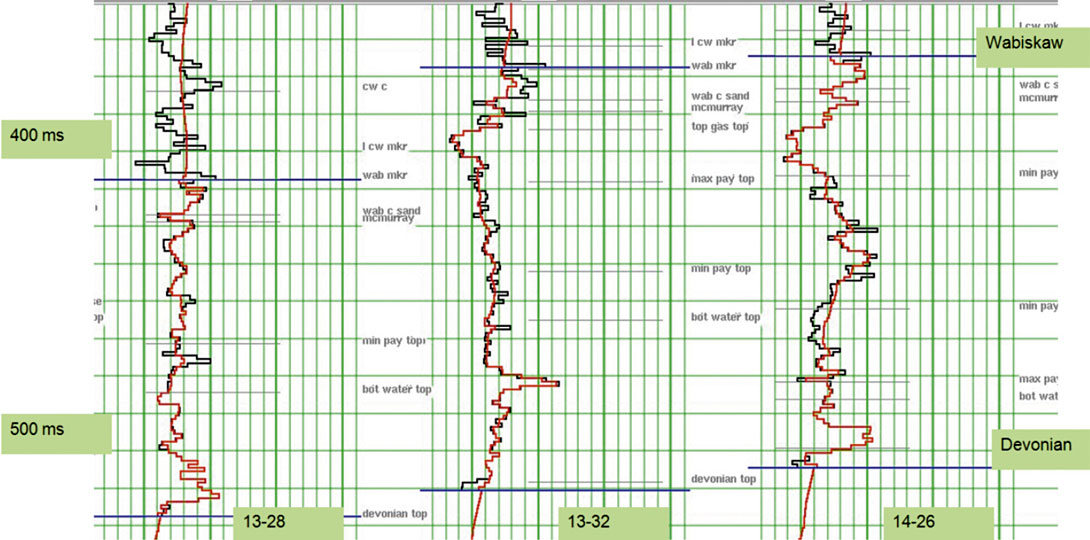
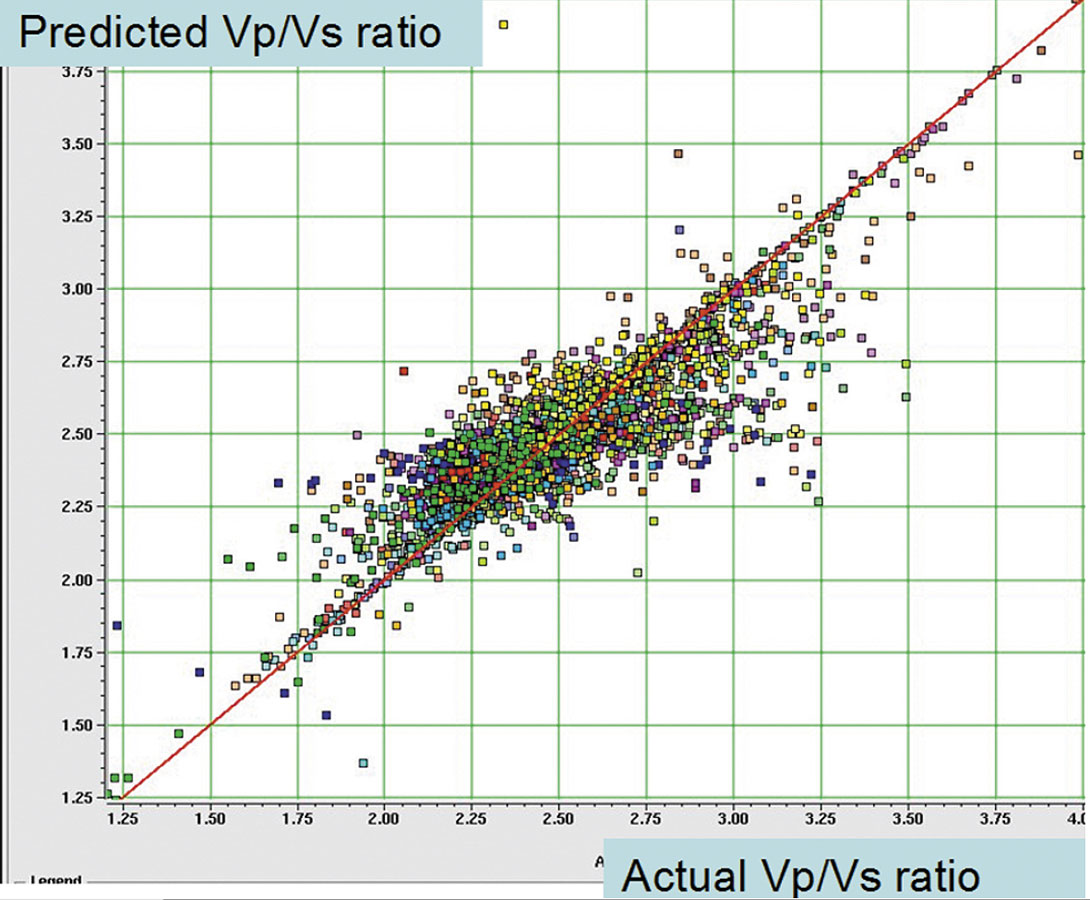
The next step was to train the neural network and to establish the nonlinear relationships between seismic attributes and reservoir properties at well locations. A comparison between the real Vp/Vs and the predicted Vp/Vs logs is presented in Figure 4. After this second step, the correlation coefficient increased to 0.87 and the error dropped to 0.15. A crossplot of the predicted Vp/Vs and the actual Vp/Vs for all the wells in the study area is presented in Figure 5.
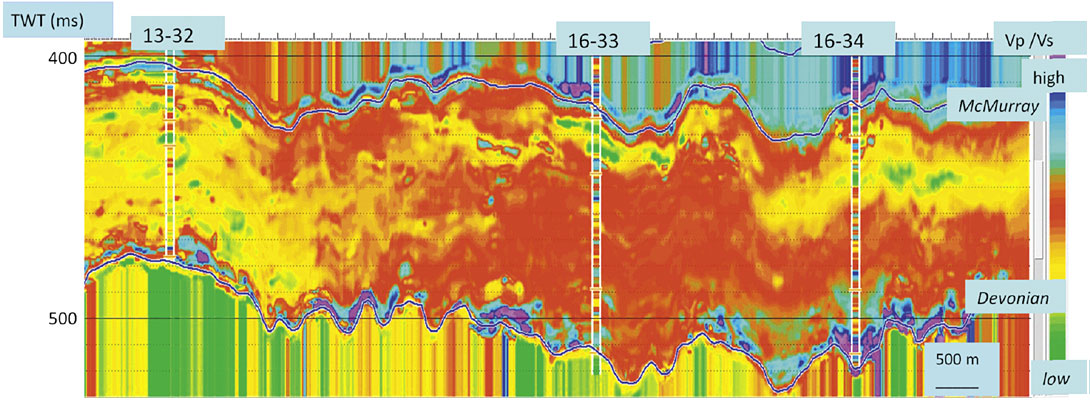
The last step was to apply the trained PNN to the whole 3D seismic volume. Figure 6 shows the estimated Vp/Vs results on the EW line 75 located in the north part of the 3D and some inserted wells (no more than 50 m offline). The Vp/Vs volume was estimated within the target interval: from 5 ms above the McMurray to 5 ms below the Devonian. (All the data outside the calculation interval, are extrapolated end points values.)
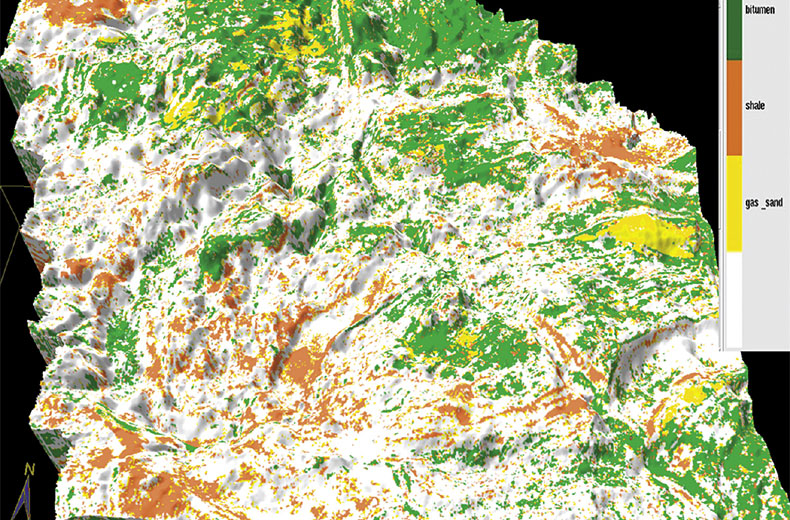
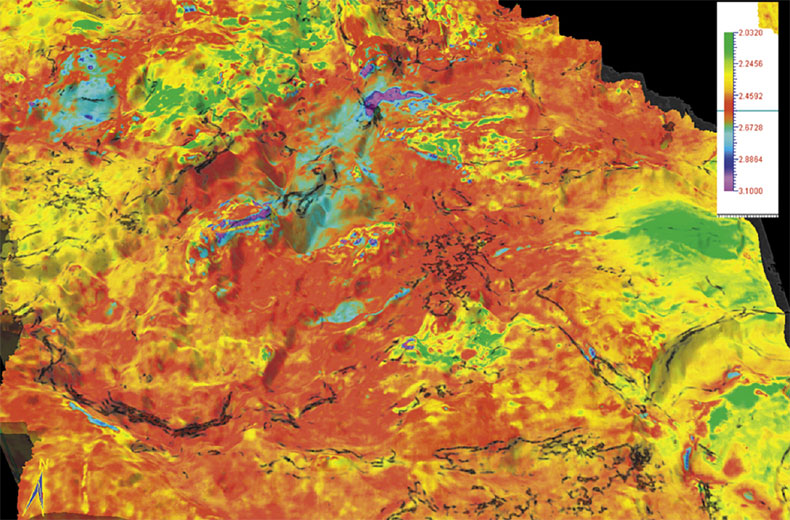
The predicted Vp/Vs volume obtained from the NNA analysis provides meaningful and reliable information about the McMurray reservoir. Density is also an excellent discriminator between gas sand, bitumen sand and shale. By integrating rock physics volumes (Vp/Vs ratio and density) and edge detector attributes (semblance) we characterized and mapped the reservoir heterogeneities impacting the SAGD operation, i.e. the extent of bitumen sand, gas saturated and shale zones. Two ways of doing so are presented here: (i) by crossplotting the rock physics volumes (Figure 7a) and (ii) by co-rendering Vp/Vs with semblance (Figure 7b). Figure 7a shows the spatial distribution of the three zones created in the crossplot given in Figure 3.
Conclusions
We presented a case study for improving the resolution of a Vp/Vs volume (obtained from deterministic inversion) by using neural networks analysis. The derived neural networks results showed a strong correlation with target logs, both at training well locations and other wells, suggesting that rock properties can be accurately estimated with neural networks analysis when deterministic inversion results are used as external attributes in training the networks.
The results of this analysis correlated well with recent drilling, making neural networks analysis part of the workflow for future projects. Utilizing the Vp/Vs and density volumes computed with neural networks analysis minimizes the uncertainty in gas sand, bitumen sand, and shale identification, thereby contributing to optimal horizontal well placement. This outcome has the ultimate effect of increased production and economic efficiency.

Acknowledgements
We acknowledge and thank the following organizations for their support: Sensor Geophysical Ltd., Nexen Inc. and the Consortium for Heavy Oil Research by University Scientists (CHORUS).
Related Reading


Join the Conversation
Interested in starting, or contributing to a conversation about an article or issue of the RECORDER? Join our CSEG LinkedIn Group.
Share This Article