Abstract
Cross-well seismic data offers the possibility of meter-scale characterization of lateral variations in reservoir stratigraphy that compliments the vertical information available from well logs. We use simulated cross-well reflection data to investigate the effectiveness of the cross-well technique for mapping the lateral extent of meter-scale permeability barriers and for qualitative and quantitative mapping of stochastic reservoir heterogeneity. The simulated data clearly demonstrate the possibility of high resolution mapping of shale and carbonate streaks that may partition reservoirs and affect production. We also introduce and evaluate heterogeneity mapping as a technique for mapping subtle reservoir heterogeneity. The evaluation demonstrates that heterogeneity mapping provides a qualitative assessment of the variability of heterogeneity in a reservoir as well as providing quantitative estimates of heterogeneity that can be used to constrain stochastic reservoir simulations.
Introduction
Reservoir simulation requires data on the heterogeneity of the reservoir properties that control the production of the reservoir. In general, high resolution information about the vertical variability of reservoir properties is readily available from well logs. However, information about lateral variability is typically derived from surface seismic data which provides information at a scale roughly an order of magnitude less than the log data. This study evaluates the effectiveness of high resolution, borehole-to-borehole reflection seismology for providing high resolution reservoir images that can be used to derive geostatistical information for reservoir simulation. We use two synthetic cross-well seismic datasets that were created using a velocity model derived from well logs from a well-characterized petroleum reservoir. The model simulates lithologic detail and reservoir heterogeneity at the metre-scale. We then apply heterogeneity mapping to assess heterogeneity in the synthetic seismograms. Heterogeneity mapping provides a bandlimited estimate of the variability in the reservoir model. The geostatistical information extracted from the cross-well seismic data has the potential to add significant new information for reservoir simulation.
Reservoir heterogeneity is a function of the porosity/permeability distribution due to lithologic variation during sedimentary deposition which is further complicated by mechanical processes related to deformation and chemical processes associated with diagenesis. Fluid flow in reservoirs is affected by heterogeneity at a range of scales, from submetre up to 10’s of metres, but the predominant control is exerted by bedding, pore fluid changes, and diagenetic effects at the metre-scale (Grammer, et al, 2004).
Well log and surface seismic data are the primary tools used to characterize reservoir heterogeneity, but both have limitations that control resolution. Well logs sample <1m vertical resolution, whereas surface seismic data typically has a vertical resolution of 30 – 50m at the reservoir interval. Furthermore, well logs only sample in the vicinity of the borehole and are typically spaced at significantly larger than the spatial sampling of surface seismic data, which is typically around 10 – 30m. The difference in vertical and spatial resolution between well log and surface seismic data leaves a gap in the effective scale of reservoir characterization that includes the metre-scale features that exert the strongest control on fluid flow.
The temporal and spatial resolution necessary for characterization of reservoir heterogeneity at the metre-scale can be achieved through cross-well seismic imaging by avoiding near surface effects that attenuate high frequencies and by reducing absorption through shorter propagation distances. These two factors allow for high resolution sampling (~1m) directly at reservoir depths (Lazaratos, 1993).
Model Construction and Synthetic Seismograms
The models used for this analysis are derived from a well and several cores from the White Rose Field in the northeastern portion of the Jeanne d’Arc Basin on the Grand Banks, offshore Newfoundland and Labrador (Bonnell, 2007). The field exhibits a complex fault system due to three episodes of rifting along the Atlantic passive margin (Enachescu, 1987). During the second rifting stage, the reservoir sands of the Ben Nevis Formation (Husky, 2000) were deposited as a well sorted, fine-grained massive quartzose, sandstone (> 300m thick) with a relatively low average permeability (~100mD). At the metre-scale within the sandstones of the Ben Nevis Formation, there are several intervals of irregularly spaced impermeable concretionary cementation of unknown lateral extent (Figure 1).
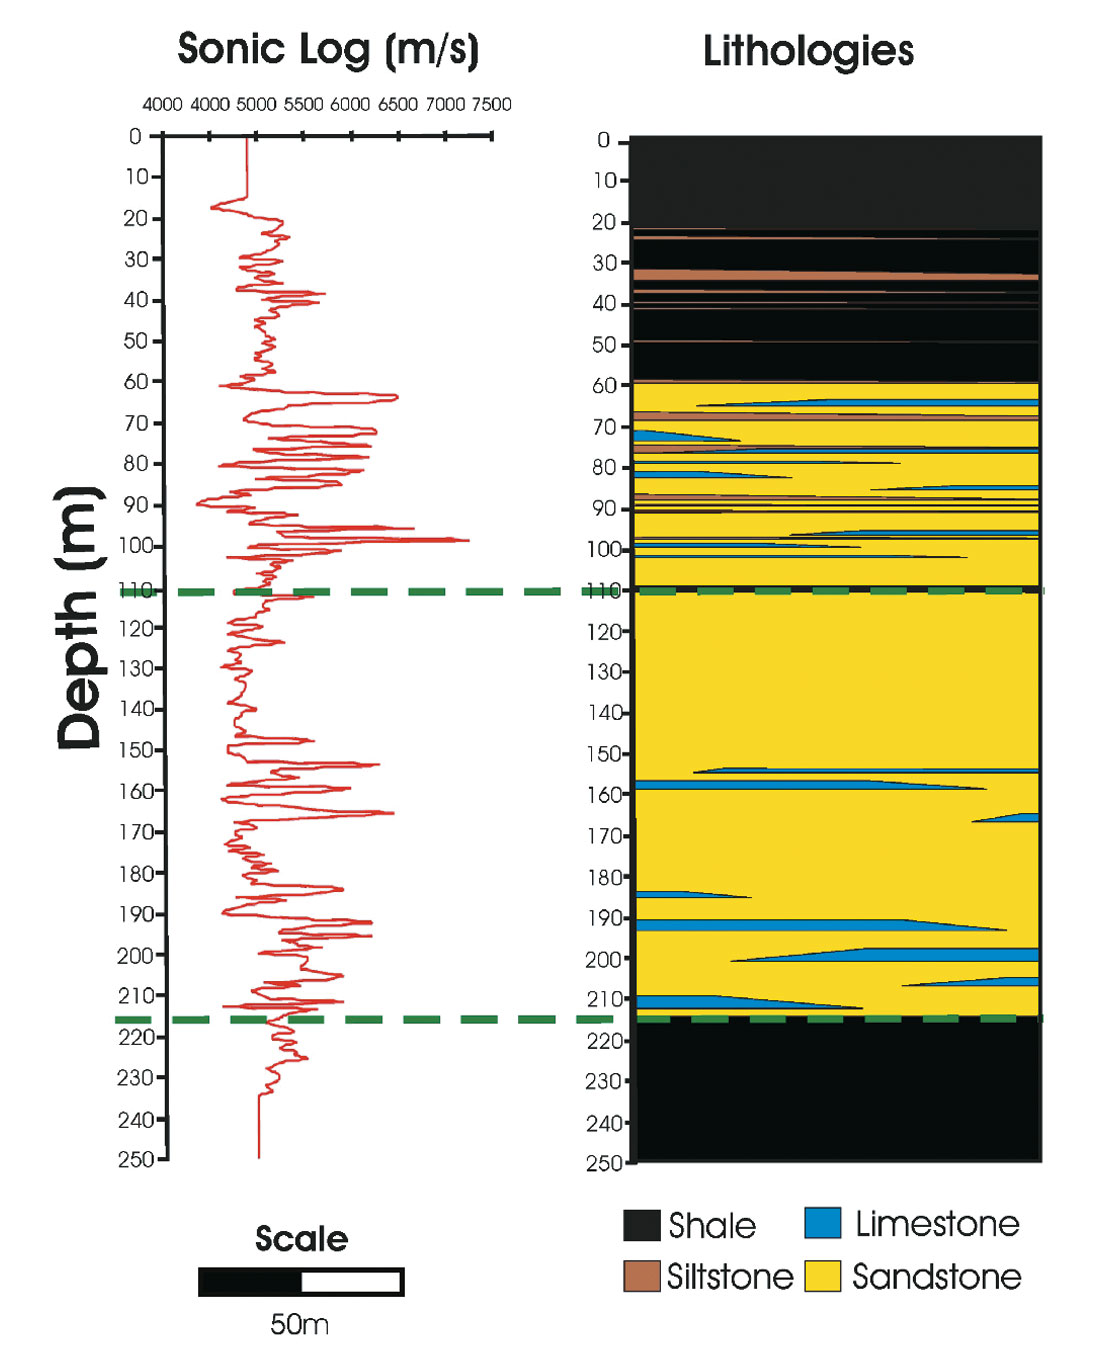
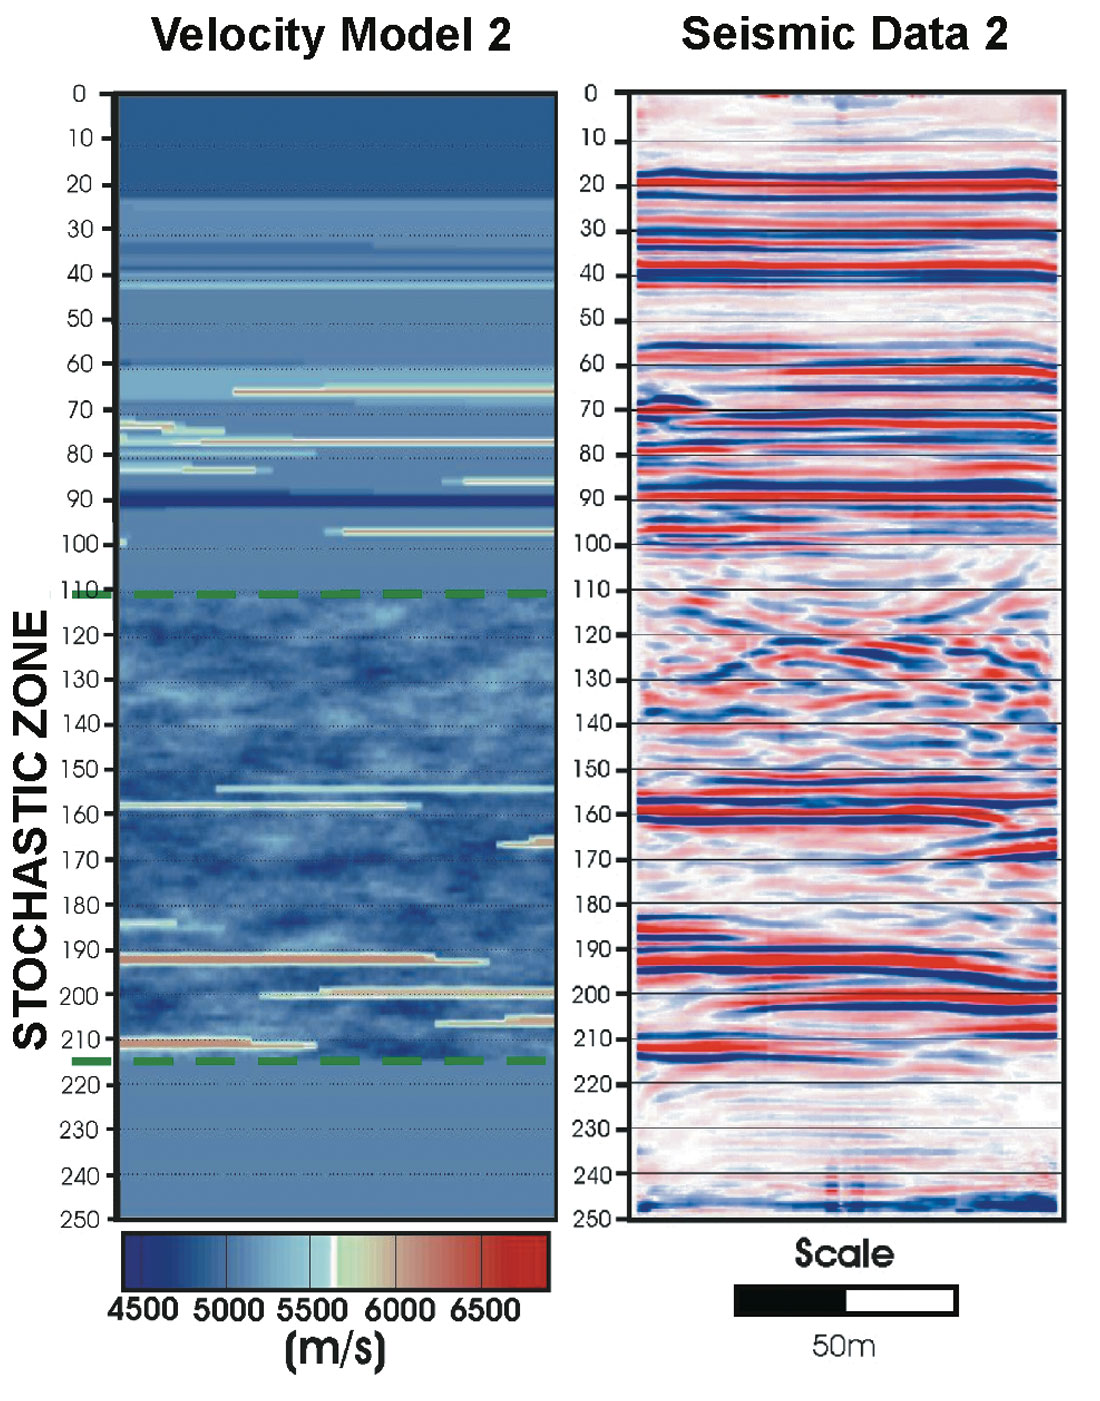
The two models are used to address two specific issues concerning reservoir quality. The first issue concerns the imaging and mapping of highly impermeable, laterally extensive, calcitecemented concretionary intervals that partition the reservoir by impeding vertical fluid flow. The second issue is a test of the ability of high resolution seismic data to recover quantitative heterogeneity information from the reservoir that can be incorporated into reservoir simulations. To address the second issue, we introduce a zone of stochastically derived velocity variation in which we assume two end-member porosity distributions. In the first, depositional processes create a thin, lenticular porosity distribution controlled by variations in sorting and grain size distributions (Pittman, 1979). For the second end-member, we consider a more globular, or low aspect ratio porosity distribution that might be associated with diagenetic processes.
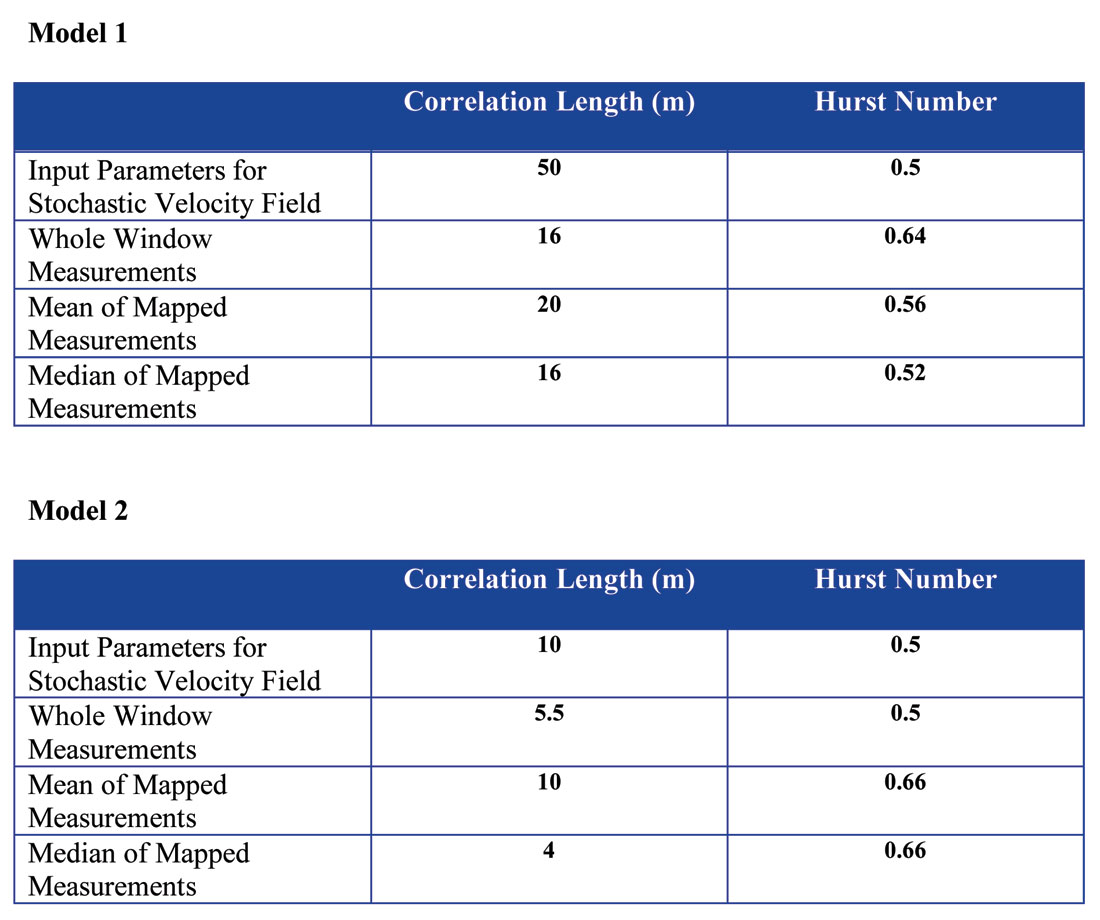
The geologic model (Figure 1) is constrained by actual well data and a pseudo-well derived from the real data. The wells are located 100m apart and cover 250m of the vertical geological section. We assume horizontal stratigraphy over the 100 m interval between the two wells. The lateral extent and thickness of concretionary layers is varied between the wells to examine the ability to resolve layer terminations and thicknesses. These concretionary intervals have anomalous high velocities compared to the surrounding sandstone, with an average reflection coefficient of ~0.09 and should be easily identifiable in the seismic section. Velocities for the stochastic zone of the model are derived from the sonic log. The first distribution (Model 1) represents bedding related porosity heterogeneity so velocity variations are elongate in a horizontal direction and have high aspect ratios (Figure 2). The second porosity distribution (Model 2) is modeled as short, subsequent domains with low aspect ratios (Figure 3).
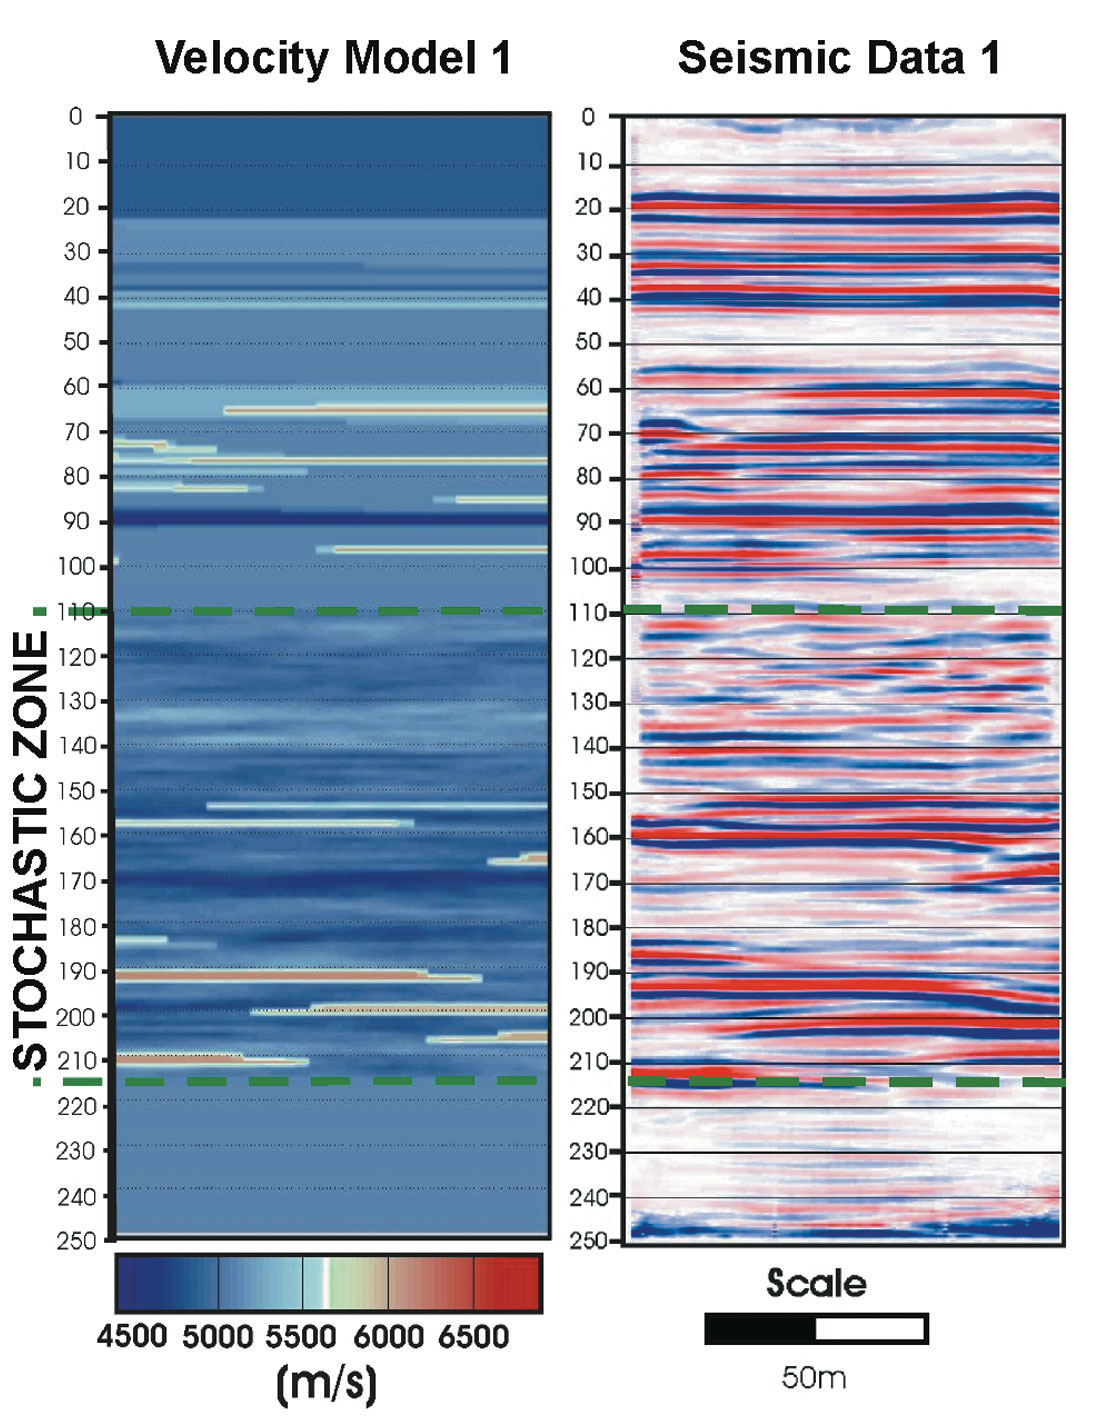
The cross-well seismic data were modeled using a 2-D, second order acoustic finite difference formulation to calculate 125 shots with a vertical spacing of 2 m. The data were recorded at 500 receiver locations spaced 0.5 m apart. The source wavelet was a zero-phase Ricker wavelet with a peak frequency of 1000 Hz and a maximum frequency of 3000 Hz.
Cross-well Seismic Processing
The synthetic data were processed in the ProMAX® VSP package following the processing scheme outlined by previous authors (Lazaratos, 1993, Harris et al., 1995, Rowbotham and Goulty, 1994, Rector et al., 1994, Rector et al., 1995, Lazaratos et al., 1995, Byun, 1999, Byun, et al., 2002). Processing of the synthetic data was simplified by the lack of shear waves, tube waves and out-of-plane energy. The simplified processing flow included direct wave removal, wave field separation, cross-well to CDP domain transformation, and transformation to incident angle domain. This processing scheme essentially converts cross-well data into a depth-domain section that mimics a CDP profile and eases interpretation and analysis of the data. Unfortunately, we were not able to carry out a successful migration in the depth domain which limits the lateral resolution of the cross-well data.
Mapping of Concretion Zones
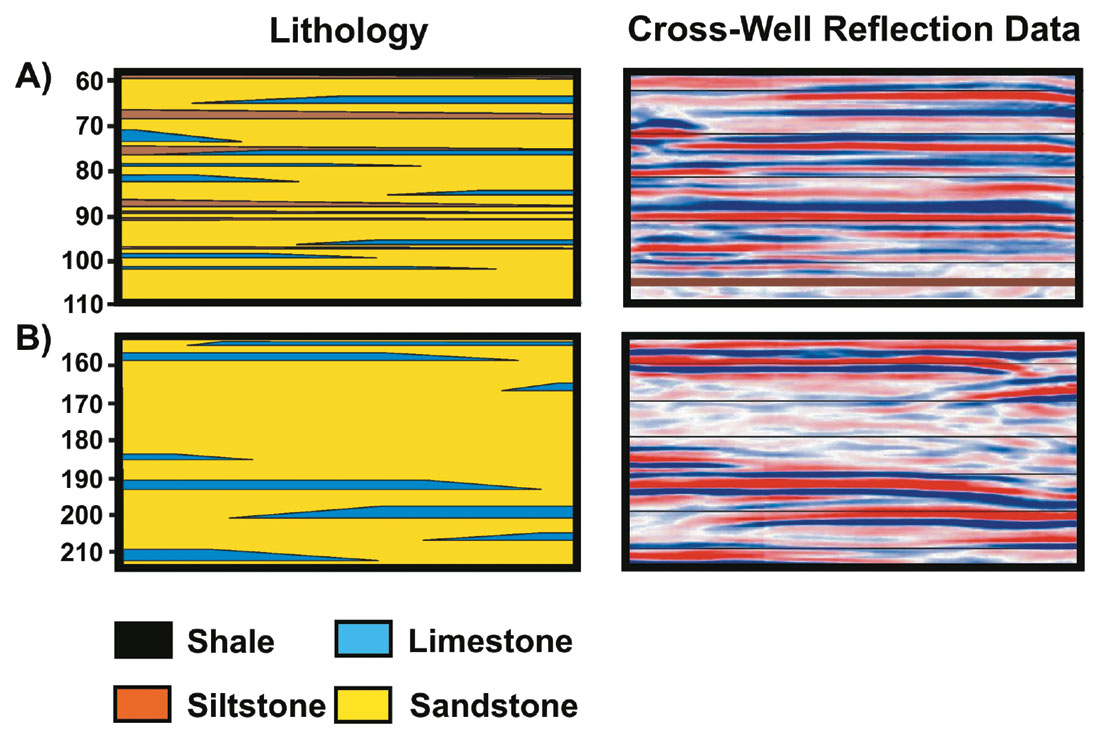
Figure 4 shows a comparison between the lithology and the cross-well seismic response for two zones of Model 1. Zone A represents both continuous and discontinuous layers of shale, siltstone and limestone that range from 0.5 m to 2 m thick within the sandstone reservoir. Zone B is less complex and is characterized by discontinuous limestone layers 1 m to 3 m thick. As expected from the high frequency content, the seismic data contain a wealth of stratigraphic information at the meter scale. Concretion zones and other stratigraphic variations are associated with specular reflections and are readily interpretable directly from the data. Even though the data are unmigrated, terminations of the concretion zones are readily identified, particularly in Zone B. The cross-well data clearly provide detailed information on the lateral extent of the impermeable zones and variability of stratigraphy between the wells that could be incorporated into reservoir simulations.
Information from the Stochastic Zones
The seismic response of the stochastic zones is characterized by a combination of specular reflections associated with the concretion layers and by a relatively incoherent wave field associated with scattering from the stochastic part of the velocity field (Figure 4). The scattered wave fields cannot be easily interpreted visually so we apply an alternative method that we refer to as heterogeneity mapping to derive information from the scattered wave field.
Heterogenity mapping
To explore the statistical properties of heterogeneity preserved in the seismic image of the reservoir models, a method of estimating the spatial statistics of the reflection wavefield is adapted from studies of crustal environments (Hollinger and Levander, 1992; Hurich, 1996; Hurich and Kocurko, 2000; Hurich 2003; Carpentier and Roy-Chowdhury, 2007a; Carpentier and Roy-Chowdhury, 2007b). The method is based on analytical and experimental arguments that demonstrate that the spatial properties of the scattered seismic wave field carry a band-limited version of the spatial properties of the acoustic impedance field that represents the geology. Due to the high-resolution vertical information available from the well logs and the predominant control of the seismic wavelet on the vertical properties of the seismic data and, we focus our analysis on estimating lateral heterogeneity.
The statistical characteristics of the seismic wave field are analyzed by comparing the autocorrelation of the wave field with that of the von Karman distribution. The von Karman distribution is a well documented method of describing stochastic media and is designed to describe self-similar (power law) distributions (Frankel and Clayton, 1986) using the parameters correlation length, and Hurst number. The correlation length represents the length scale beyond which the data are uncorrelated and thus provides an estimate of the range of scales in the data. The Hurst number describes the relative contribution of the various correlated scale lengths to the data providing an estimate of the roughness or smoothness of the data. Hurst numbers tending toward zero represent rough distributions while Hurst numbers tending toward one represent relatively smooth distributions.
The spatial statistics of the seismic data are determined by fitting the autocorrelation of a windowed data sample of the data, to the autocorrelation of a theoretical von Karman model using a least squares approach. The fitting process provides estimates of correlation length and Hurst number as well as the relative power in the window. Heterogeneity mapping is carried out by sliding the analysis window through the entire seismogram resulting in a mapping of the spatial variation of the two von Karman parameters. The seismograms in this study contain only P-waves and no tube-waves, so the effectiveness of extracting spatial statistics should be primarily a factor of the technique, and not the quality of the data or data processing.
To help assess the quality of the spatial statistics derived from the seismic data, we extract statistical information using two methods. The first method employs a sliding data window to map variations in the statistics within the reservoir. This approach emphasizes local heterogeneity at the scale of the analysis window and is most effective in characterizing small-scale heterogeneity. The second approach uses a data window that extends the full inter-well distance and slides vertically through the data. This approach provides an average estimate of the power and two von Karman statistics between the two wells and is most effective in describing larger-scale heterogeneity.
Qualitative Analysis
We focus our discussion of the statistical analysis on the upper half of the stochastic zone of the two models (110-152 m) because these zones are least affected by specular reflections associated with the concretion zones. Maps of power, correlation length and Hurst number for the two models are shown in Figure 5. The maps were computed using a window 35m wide and 17.5m high that incremented through the section every 2m horizontally and every 1m vertically. Each pixel in the maps represents a sample of seismic data the size of the analysis window. For comparison to the mapping results, we also determine the von Karman statistics for the entire 100 by 42 m stochastic zones.
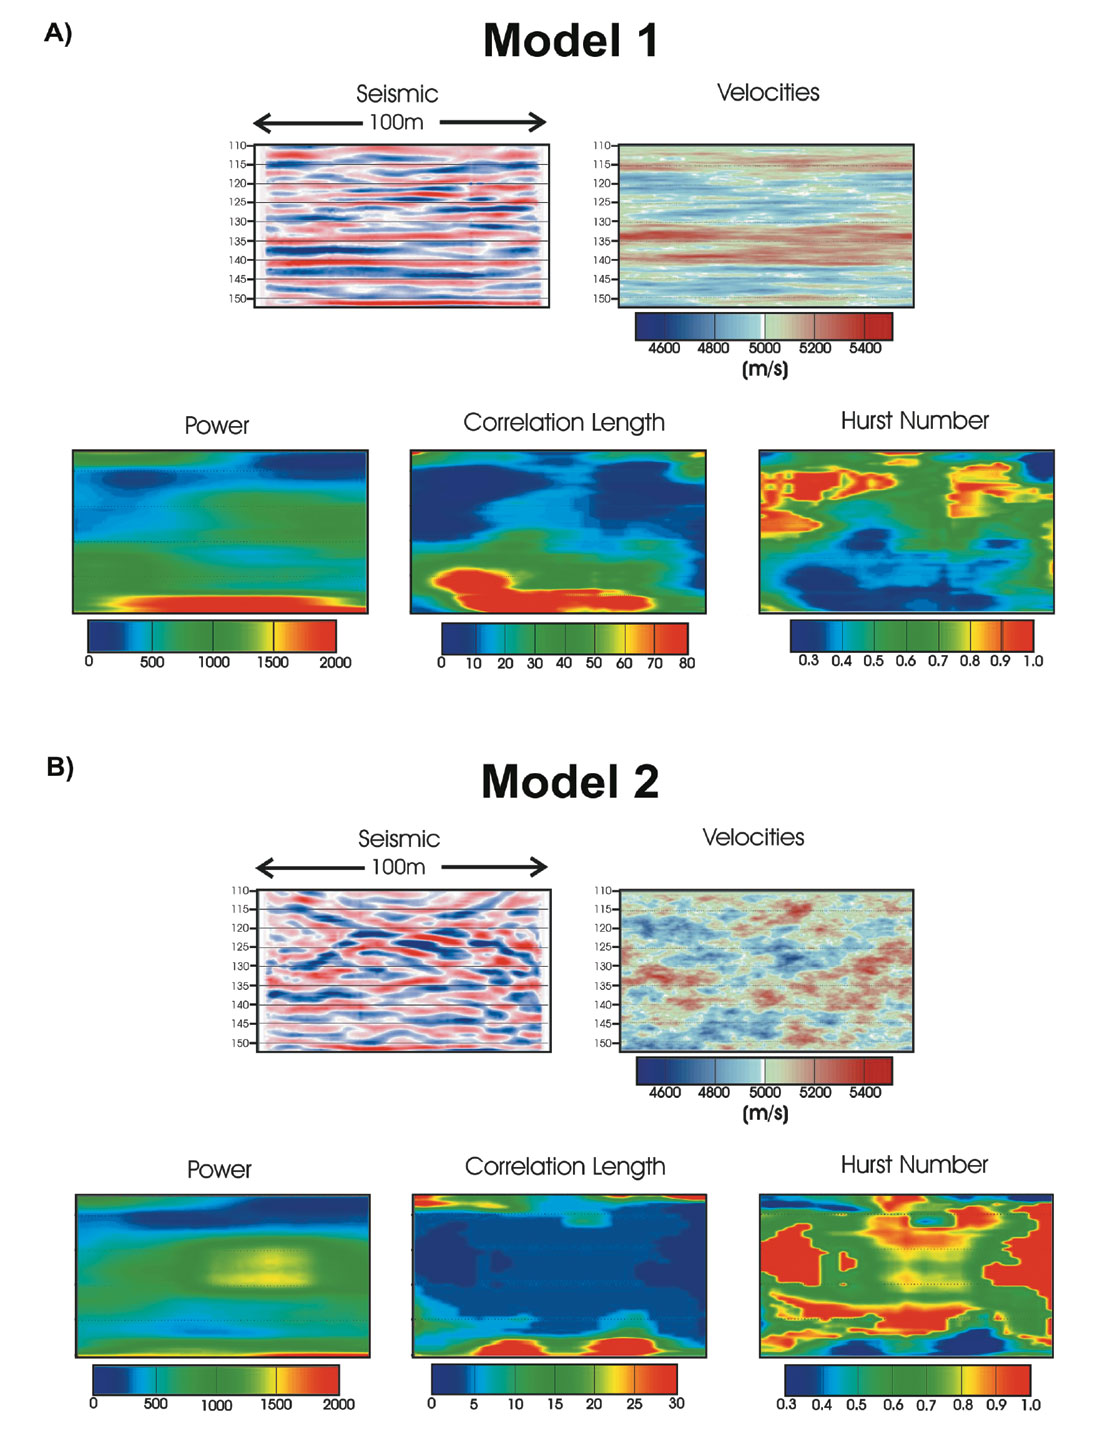
The overall seismic response of the two stochastic zones is distinctly different and is consistent with the respective velocity models (Figure 5). Model 1 which is dominated by relatively thin, continuous layering shows an ordered, subhorizontal seismic response. In contrast, Model 2 is dominated by disordered incoherent events. Interestingly, the power maps show only modest differences between the two models. Our expectation is that the thin continuous layering and the associated specular reflections in Model 1 should produce a significantly higher power response than the scattered response in Model 2. Since the range of velocity contrasts is the same for both models, the similar power maps suggest that in this particular case, spatial interference may be as important as temporal interference for controlling the power of the reflection response.
There is a clear division in the von Karman statistics between the upper and lower portions of Model 1. The top part is characterized by shorter correlation lengths and higher Hurst numbers than the bottom part indicating shorter events of similar length as opposed to longer events and a wider range of event lengths in the lower part.
Model 2 shows a more homogenous response that is similar to that of the upper part of Model 1 except that the correlation lengths are considerably shorter.
The variations of the von Karman statistics as revealed by heterogeneity mapping are consistent with the stochastic lithology models and their seismic response. The mapping reveals subtle variations that may represent information of fundamental importance for reservoir characterization and simulation.
Quantitative Analysis
Although the qualitative aspects of the heterogeneity maps are themselves potentially useful for reservoir characterization, the more interesting and difficult issue is whether we can extract quantitative information that we can use as constraints for reservoir simulations. It is well recognized that the spatial attributes of the seismic data tend to underestimate the correlation length and overestimate the Hurst number of the causative velocity/impedance field (Hurich and Kocurko, 2000; Carpentier and Roy-Chowdhury, 2007a). Scaling of the von Karman statistics between the seismic response and the causative geology is an issue of ongoing research. However, it is clear that two major issues are at play. Firstly, the frequency/bandwidth of the seismic wavelet operates as a low pass filter and thus removes the high frequency components of the geology. Secondly, the ideal seismic response can be viewed as the derivative of the velocity/impedance field and the differentiation process alters the spatial properties of the velocity/impedance field. It has been recently demonstrated that the vertical and horizontal derivatives are coupled, so although we tend to view a seismogram as a vertical (temporal) derivative, the horizontal (spatial) properties a re altered as well (Carpentier and Roy-Chowdhury, 2007a). Although we do not presently have a complete solution for the scaling issue, numerous numerical experiments (Hurich and Kocurko, 2000; Carpentier and Roy-Chowdhury, 2007a) indicate scaling factors in the range of 2 to 5 are appropriate for correlation length and 0.6 to 0.8 for Hurst number. The numerical experiments further suggest that the scaling issue is tractable and further research should provide clearer constraints on scaling factors.
Table 1 shows a comparison of the von Karman statistics for the original stochastic velocity fields and the values derived from the seismic data. These data indicate that statistics derived from the cross-well simulation are consistent with previous experience in that the correlation length and Hurst number are respectively under and over estimated. The data indicate that a scaling factor of 2 to 3 is appropriate for the correlation length and a factor of 0.8 is appropriate for the Hurst number.
Further quantitative information can be derived from the distribution of correlation length and Hurst number derived from heterogeneity mapping. Figure 6 shows histograms for the statistics of the two models. The two models show distinctly different distributions for the two statistics, further demonstrating the sensitivity of the scattered wave field to geometry of the geology. The distributions are quite asymmetric suggesting that the measures of central tendency shown in Table 1 tell only part of the story. We suggest that the form of the histograms could be used as the basis for the choice of statistical models used for reservoir simulation.

Conclusions
The objective of this work is to investigate the possibility of using cross-well reflection data to provide data at the meter-scale for reservoir characterization and to provide constraints for reservoir simulation. The high frequency content and dense spatial sampling attainable in cross-well geometry enable detailed mapping of lateral stratigraphic variations at the scale at which they affect reservoir performance. The models demonstrate the possibility of detailed mapping of meter-scale, reservoir partitioning elements such as carbonate and shale streaks. The models also demonstrate that heterogeneity mapping provides a viable tool for mapping reservoir heterogeneity as well as providing quantitative estimates of statistics that can be applied to reservoir characterization and simulation.

Acknowledgements
ProMAX® has been provided to Memorial University as a donation from Landmark Graphics Corporation.


Join the Conversation
Interested in starting, or contributing to a conversation about an article or issue of the RECORDER? Join our CSEG LinkedIn Group.
Share This Article