Carbonate sedimentary rocks that have been fractured, or dolomitized and laterally sealed by tight undolomitized limestone, are frequently seen to produce hydrocarbons. However, the differentiation between limestones and dolomites is a challenge. The purpose of this work is to describe a workflow for discriminating limestones and dolomites, and to map the lateral extent of dolomite reservoir rocks that have a thickness below the seismic resolution.
For this study, we have used the photoelectric index (Pe) well log curve as it is a sensitive indicator of mineralogy. At any well location, Pe exhibits somewhat higher, but flat trend for background limestone. Relative to this flat trend the dolomite units are represented by low values of Pe. However, such well log curves are available only at the location of the wells. We demonstrate an approach of computing Pe volume from the seismic P- and S-impedance volumes. We begin our exercise by crossplotting the P-impedance (IP) against the S-impedance (IS) color coded with Pe curve using the well log data. In IP-IS crossplot space, we highlight the discrimination between the limestone and dolomite clusters by choosing an axis of rotation to highlight the desired discrimination. The result of such a rotation is a single display attribute we call lithology impedance (LI) to identify the formation lithology. Furthermore, its relationship with the Pe curve is established for obtaining Pe volume from the seismic data. The issue of the resolution of the seismic data is addressed by using a thinbed reflectivity inversion.
Introduction
Carbonate reservoir rocks constitute 20% of sedimentary rocks while they hold more than 50% of the world’s proven hydrocarbon reserves and account for 40% of the world’s total hydrocarbon production (Saberi, 2010). Therefore, it is no surprise that carbonate reservoirs are very important targets for oil and gas exploration. Carbonates differ significantly from siliciclastics in that they are not transported, but are largely organically grown or precipitated in place. A specific environment i.e. clear water with little or no silt contamination, specific water temperatures, and food supply are prerequisites for carbonate generation. In contrast to the point source influx of siliciclastics from streams and rivers, carbonate generation occurs along long slopes, platforms, and margins extending for hundreds of kilometers (Sukmono, 2010). Once generated, carbonate rocks are initially known as limestones. Later, dolomitization, a diagenesis process is responsible for the transformation of limestone into dolomite. Diagenesis of limestone into dolomite involves the substitution of some Ca2+ ions in limestone (CaCO3) by Mg ions to form dolomite (Ca.Mg)(CO3)2). This process increases the crystal size, pore size and thus enhances the permeability. Porosity and permeability are also increased due to the solution of allochems. As dolomites are less ductile relative to limestones and sandstones, their porosity and permeability are enhanced by fracturing too. Additionally, as they are less reactive than calcites, dolomites are less likely to lose porosity with depth due to dissolution or re-precipitation (Grammer & Harrison., 2003). For the reasons described above, dolomites often make the best reservoirs in carbonates. Of course the reservoir geometry usually depends on the process of dolomitization and stratigraphic architectures.
In the Western Canadian Sedimentary Basin (WCSB), geoscientists believe that hydrothermal dolomites and the associated minerals and fabrics are formed due to the flow of hot subsurface fluids along conduits. For Middle Ordovician Trenton and Black River carbonates, in eastern Canada the magnesium required for dolomite precipitation was supplied by magnesium-rich seawater-derived (Silurian and/ or Devonian) saline waters from the dissolution of Silurian evaporates. These waters became heated during their descent along faults and fractures to reservoir depths at the center of the basin. Hot basinal brines migrated laterally through basal sandstones, ascended into the network of faults and fractures and precipitated fracture-related dolomite (Ardakani et al., 2013).
Compared with clastic reservoirs, the characterization of dolomite reservoirs presents challenges as many of the conventional methods, such as the Lambda-Mu-Rho approach are not very effective. Consequently, we need to look for alternative methods for their characterization.
Moreover, the latest density logging tools make it possible to differentiate between dolomites and limestones using the photoelectric index log. It records the absorption of low energy gamma ray by the formation in units of barns per electron. Such absorption is dependent upon the atomic number of the formation, and therefore is a sensitive indicator of mineralogy. The limitation is the availability of Pe curves only at well locations. As there is no direct way of computing a 3D volume of Pe from seismic data we look for an indirect way of computing it. In the present work, we demonstrate such an approach for characterizing a hydrothermally dolomitized reservoir which has a thickness below the seismic resolution.
The method
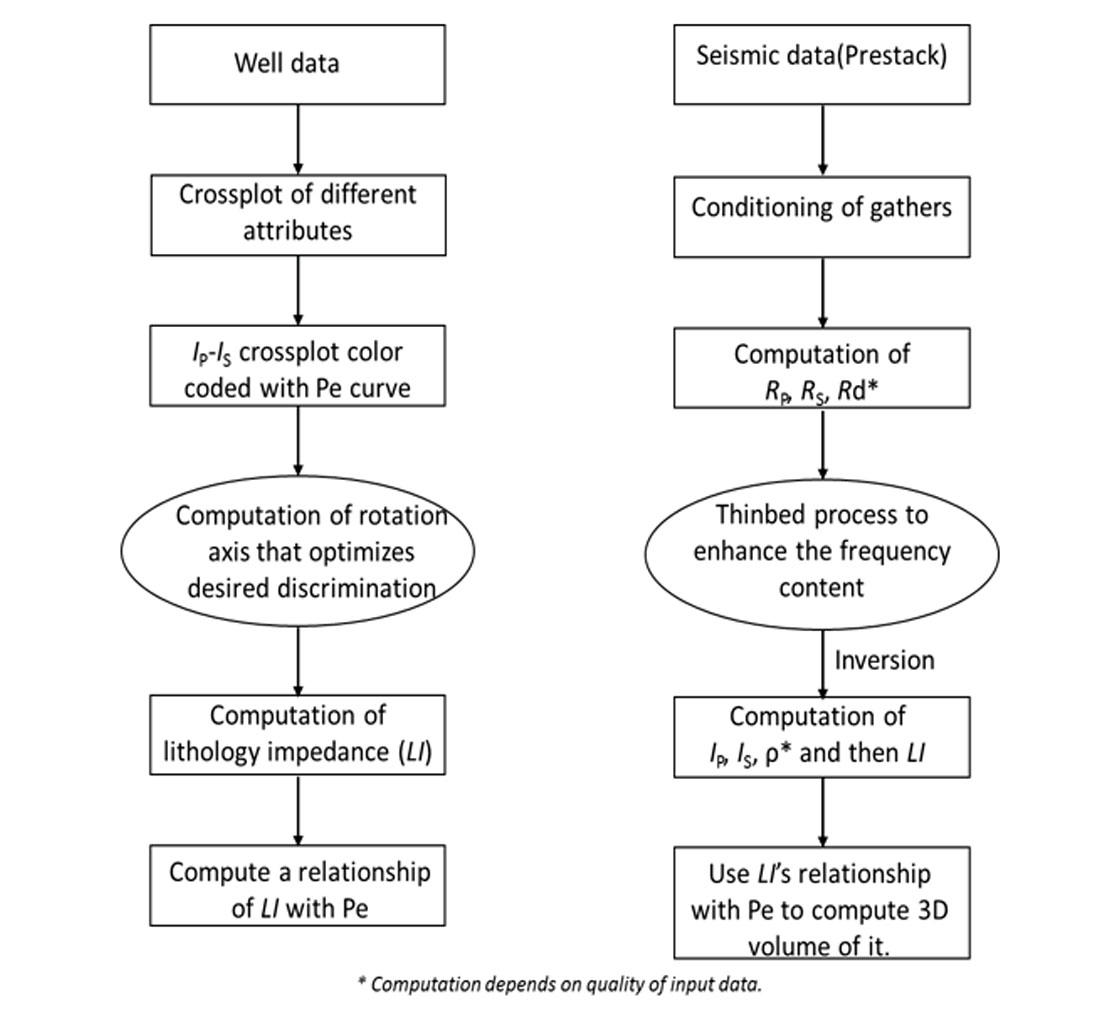
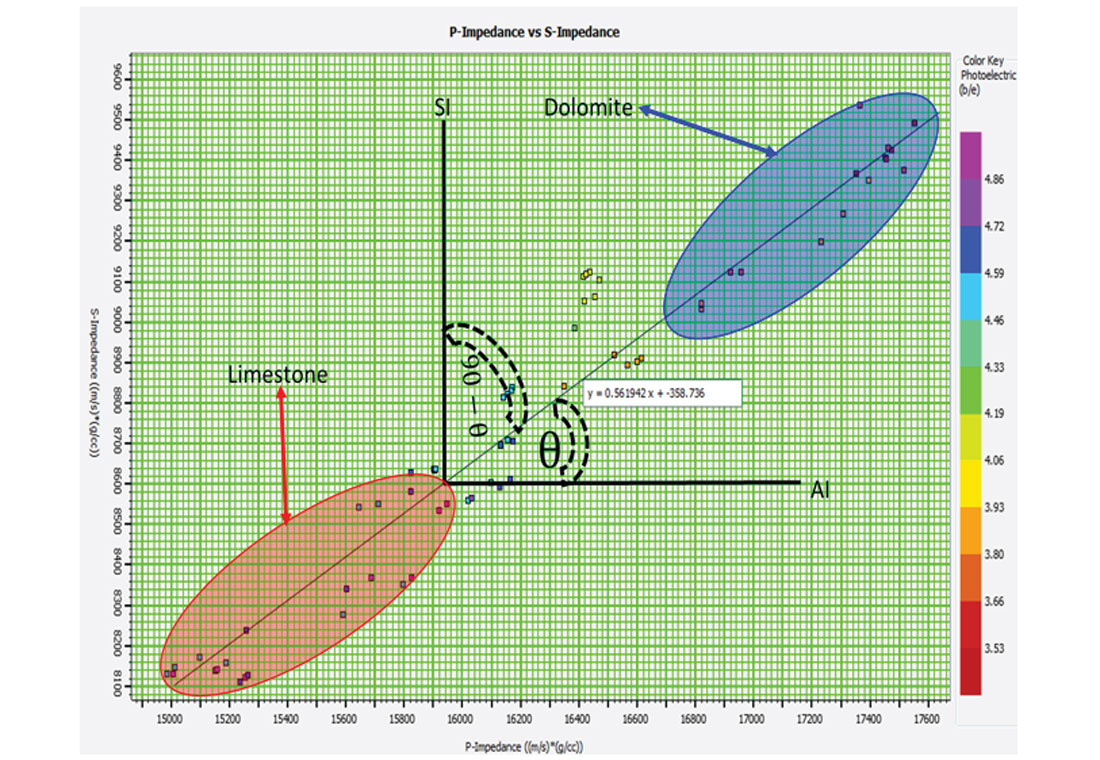
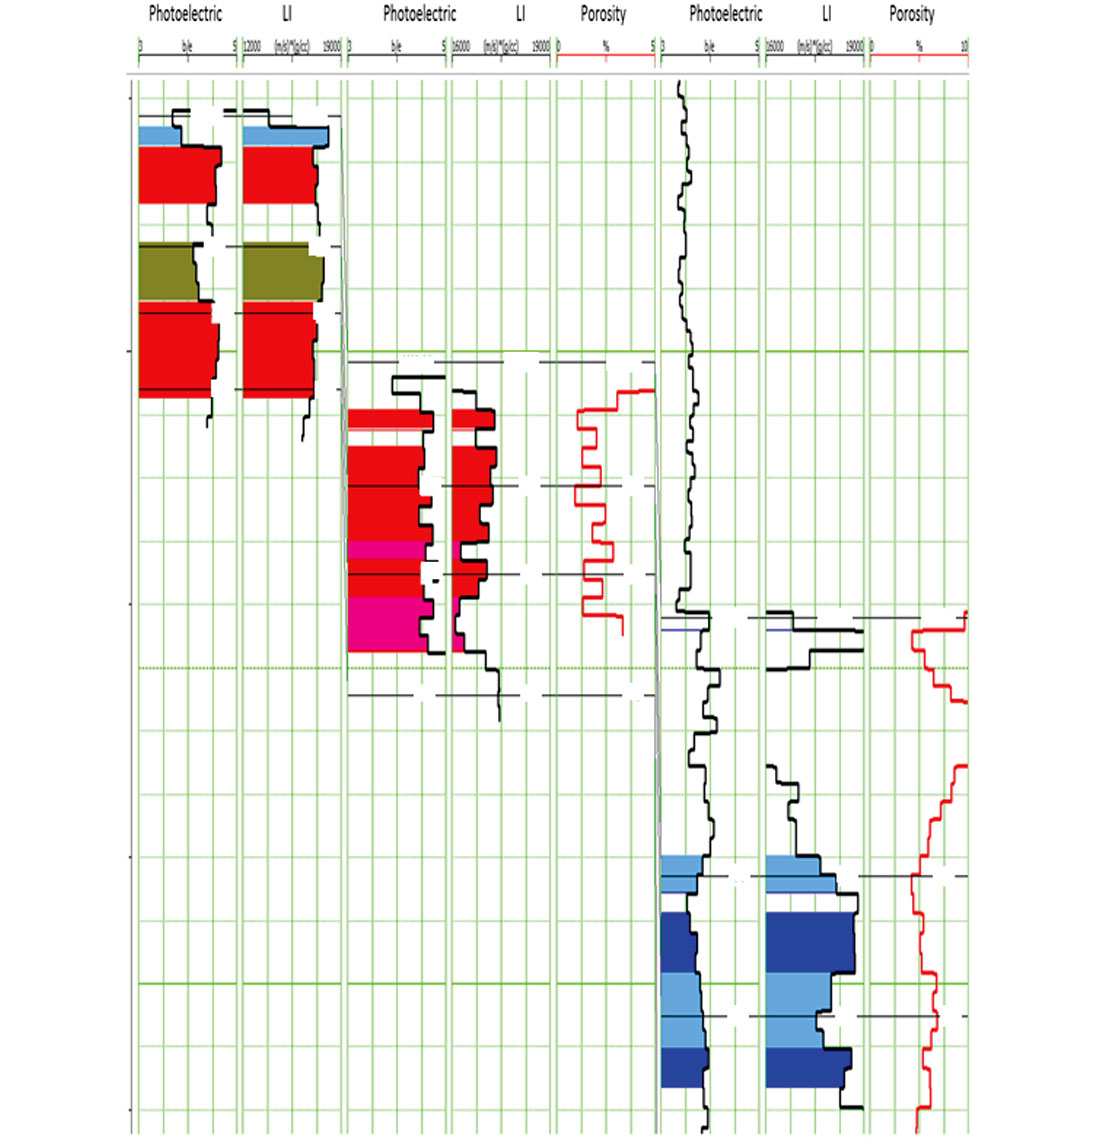
We demonstrate an integrated workflow in which well data and seismic data are used to discriminate between limestone and dolomite as shown in Figure 1. The workflow begins with the generation of different attributes from the well-log curves. As shown in Figure 2, using the IP–IS crossplot color coded with Pe values, the blue and red polygons are drawn corresponding to points that have low and high value of Pe to identify the dolomite zones. Instead of using these two separate attributes, it is possible to differentiate between limestone and dolomite by rotating the clusters in a counterclockwise direction. Such a rotation leads to new attribute, namely lithology impedance (LI) that incorporates lithology formation and can be defined as

where θ is the angle of the regression line intersection with the horizontal axis.
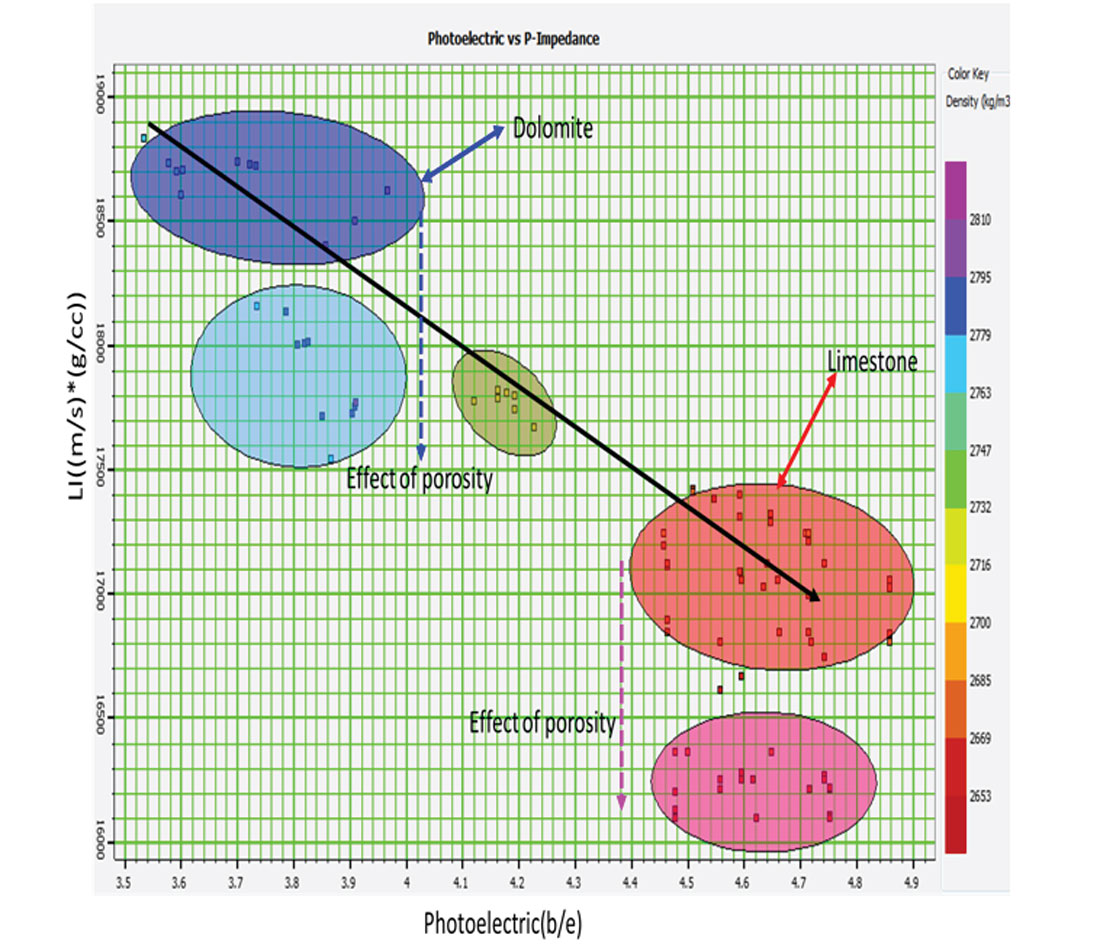
Using the crossplot shown in Figure 3, the relationship between LI and Pe curve is derived which can then be used for obtaining Pe volume from the seismic data as shown in the crossplot in Figure 3. From the figure it is noticed that LI can be used to identify the dolomite. The dotted blue and magenta lines on this crossplot shows the effect of porosity for dolomite and limestone respectively.
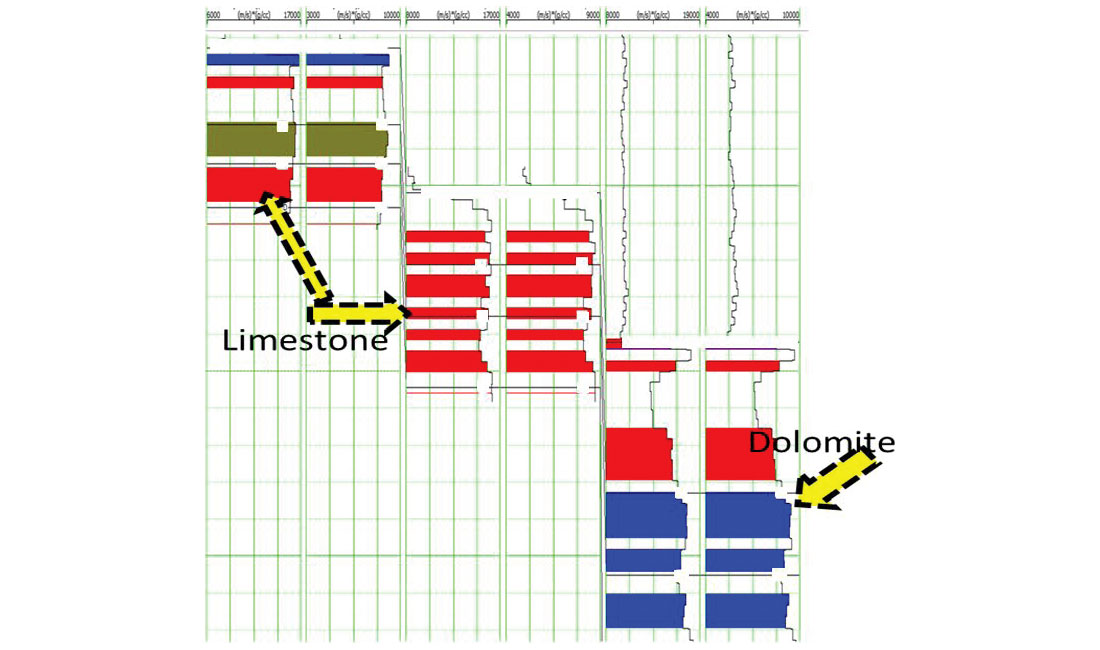
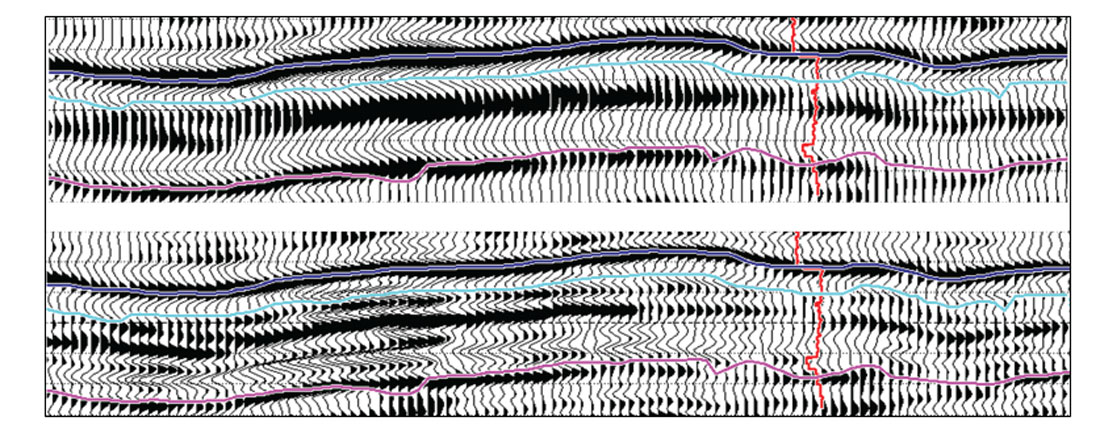
For deriving these attributes from seismic data, we begin with the prestack seismic gathers. After generating angle gathers from the conditioned offset gathers, the Fatti’s approximation to the Zoeppritz equations (Fatti et al., 1994) is used to compute P-reflectivity, S-reflectivity, and density attributes, the latter depending on the quality of input data as well as the presence of long offsets. Due to the band-limited nature of acquired seismic data, any attribute extracted from it will also be band-limited, and so will have a limited resolution. As the target dolomite reservoir is thin, it is necessary to enhance the resolution of the seismic data. An appropriate way of doing it is the thin-bed reflectivity inversion (Chopra et al., 2006; Puryear and Castagna, 2008), which was run on the P- and the S-reflectivity volumes. Following this process, the effect of the time-varying wavelet is removed from the data. The output of this process can be viewed as spectrally broadened seismic data, retrieved in the form of broadband reflectivity data that can be filtered back to any desired bandwidth. This usually represents useful information for interpretation purposes. Thin-bed reflectivity serves to provide the reflection character that can be studied, by convolving the reflectivity with a wavelet of a known frequency band-pass. This not only provides an opportunity to study reflection character associated with features of interest, but also serves to confirm its close match with the original data. In Figure 4 we show a comparison of the filtered thin-bed reflectivity inversion with the P-reflectivity seismic data. The filtered thin-bed reflectivity data is next inverted into P-impedance, S-impedance and density. Once these impedance volumes are obtained, it is possible to compute LI.
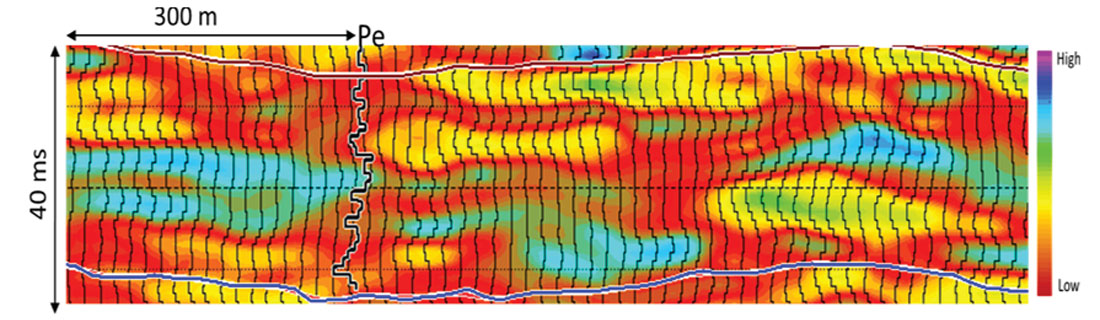
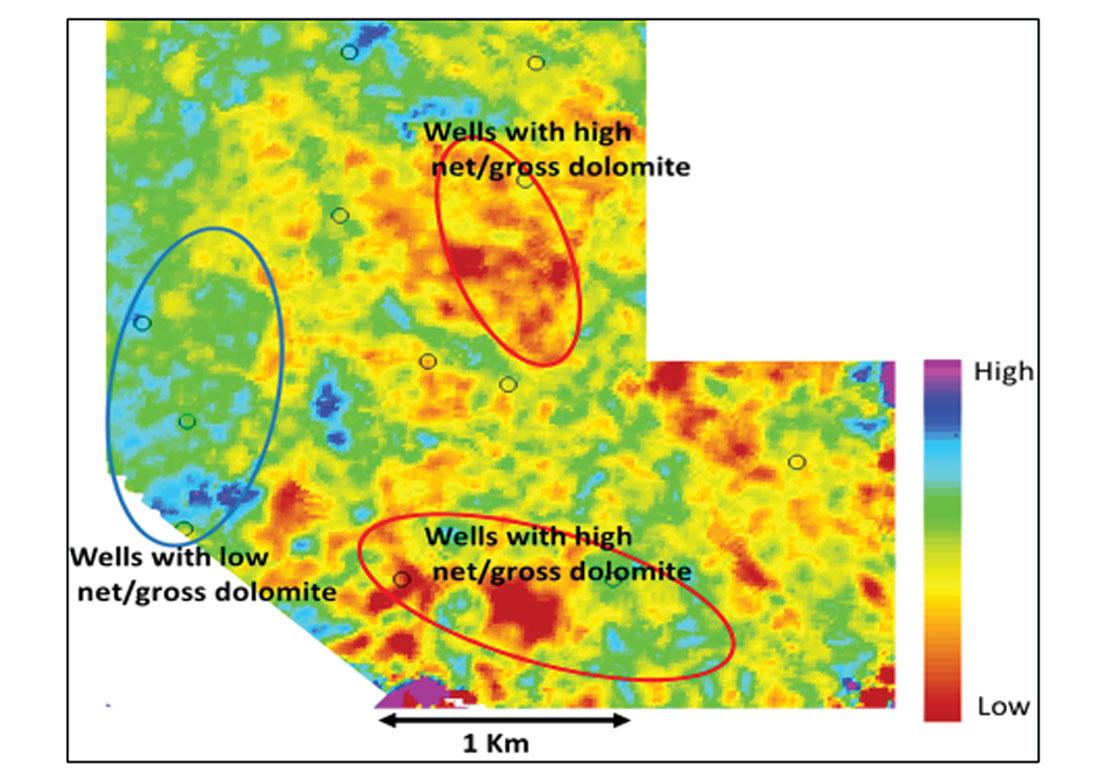
Using the relationship between LI and Pe established from the well we transform the LI volume into a 3D volume of Pe, and use that to infer dolomitic zones in a lateral sense. The segment of computed Pe attribute passing through a well is shown in Figure 5. Overlaid Pe curve shows reasonably good match with the derived Pe data. To map the dolomite zones laterally a horizon slice of Pe volume over a window that includes the zone of interest is shown in Figure 6. It has been found that through the 3D area the predicted Pe response within the reservoir interval correlates fairly well with the net to gross dolomite within the same interval.
Conclusions
Rotation of data in IP–IS crossplot space facilitates the computation of a single attribute known as lithology impedance (LI) that yields information about the lithology discrimination within the formation. It was then used to transform the inverted P-impedance volume into a 3D Pe volume. The derived Pe volume was analyzed and a fairly good match was seen at the blind wells. It was found that throughout the area covered by the 3D seismic volume, the predicted Pe response within the reservoir interval correlated fairly well with the net to gross dolomite within the same interval.

Acknowledgements
We thank Arcis Seismic Solutions, TGS, for allowing us to present this work.


Join the Conversation
Interested in starting, or contributing to a conversation about an article or issue of the RECORDER? Join our CSEG LinkedIn Group.
Share This Article