Summary
The cracks in sedimentary rock that is subjected to a change in the applied stress or fluid pressure will undergo a distortion related to their orientation relative to the principal directions of the applied stress. Both the crack distribution and the fluid-flow properties will be altered as a consequence of the change in either the applied stress or fluid pressure, resulting in a change in the elastic parameters of the rock. It is widely believed that P-waves are sensitive to fluid, whereas S-waves are insensitive to fluid saturation and types. However, we expect that both P- and S-waves are sensitive to pore fluid pressure. In this article, we investigate the influence of stress and pore fluid pressure on seismic waves, in particular anisotropic parameters and AVO response. Our main message is that S-waves are more sensitive to changes in the applied stress or fluid pressure than P-waves, and that combined use of P- and S-waves will help to predict pore pressure and to differentiate the effects of pore pressure and fluid saturation.
Introduction
Over the past decade, the application of seismic anisotropy has evolved from the estimation of stress/fracture orientation and spatial variation of fracture intensity (porosity) to the prediction of fluid saturation, pore pressure and permeability anisotropy in hydrocarbon reservoirs. In particular, there is an increasing interest in time-lapse seismic monitoring of dynamic reservoirs, i.e. to monitor subsurface pressure changes and fluid movements in producing hydrocarbon reservoirs (Angerer et al. 2002). On the other hand, in deepwater environments, wells are expensive and the increased costs associated with drilling in over-pressured formations demand a reliable prediction of pore pressure (Sayers et al. 2000). Therefore we need to quantitatively characterise the seismic signature of pore fluid properties.
The presence of pores or cracks in matrix rock will influence the mechanical properties of the rock, and thus by modelling the crack distribution to account for the effects of stress, we may study the effects of the cracks on these mechanical properties, such as the velocities or the permeability. Clearly then, advancements in the modelling of the mechanical properties resulting from a distribution of cracks will aid the accuracy of inversion techniques. In this article we use the theoretical model developed by Hudson (2000) and Tod (2002) to study the dynamic response of cracked rock, focusing on effects of fluid pressure on measurable anisotropic parameters and AVO response. Our results provide a physical basis for the seismic characterisation of pore fluid pressure. We argue that it is difficult to distinguish the effects of fluid saturation and pore pressure from P-analysis alone because P-waves are sensitive to both saturation and pore pressure, and the joint analysis of P- and S-waves is necessary to differentiate these two effects. Our argument is further supported by the variation of reflection coefficients with differential stress and a study of synthetic seismograms.
Dynamic response of cracked rock
The most recent studies of the dynamic response of cracked rock has been attributed to Percorari (1997), Zatsepin and Crampin (1997), Hudson (2000), and Tod (2002), though the historical root can be traced further. We use the model developed by Hudson (2000) and Tod (2002) as used by Liu and Li (2001) (hereafter referred to as the HT model) in this article. In this model the crack density is developed that depends on both the aspect ratio and orientation of the cracks, and further depends on both the applied stress and the fluid pressure. The dynamic process of rock deformation under a changing differential pressure can be divided into four stages, only the first and third of these are considered in the model herein; collapse of, and closure of, the original cracks. The remaining two stages are defined as the deformation of pores into cracks and the formation of new cracks of small aspect ratio. The HT model we used here thus predicts that the crack density decays monotonically with an increase in the applied stress from some initial value corresponding to the unstressed state, and thus the model is purely elastic, and assumes that during subsequent unloading, the material relaxes to its original state. This model can be used in conjunction with the dependence of the effective elastic parameters on the crack distribution, to model the relation between the anisotropy of the cracked medium, incorporating fluid-flow, and the applied stress and fluid pressure. However, the HT model does not account for the non-linear effects that are likely to become important when modelling large changes in applied stress and fluid pressure.
When a cracked medium is subject to an imposed stress σ and fluid pressure p, the aspect ratio of the cracks is given by (see references above) ,

where μ is the shear modulus, and γ is Poisson’s ratio of the matrix rock. r0 is the initial aspect ratio of the crack, i.e., before stress field and pressure are applied, and r is the aspect ratio of the crack when stress field σij and excess pressure p are applied. Thus the imposed stress and fluid pressure together form the crack opening stress (σijninj + p) for the deformation of a crack with unit normal n. If we define

as the critical stress (Zatsepin and Crampin 1997), the aspect ratio of the cracks becomes.

Note that σdiff= σijninj + p is called the differential stress. Zatsepin and Crampin (1997) modelled the stress-sensitivity of initially randomly oriented cracks in isotropic media. Hudson (2000) and Tod (2002) extended this idea further to model the effects of stress in cracked media using the fluid-flow model developed by Hudson et al. (1996) and Tod (2001). Once the dependence of the aspect ratio on stress is computed, we can use Hudson et al.’s (1996) formulae to calculate the effective elastic stiffness of the cracked rock.
Effects of differential stress on anisotropy
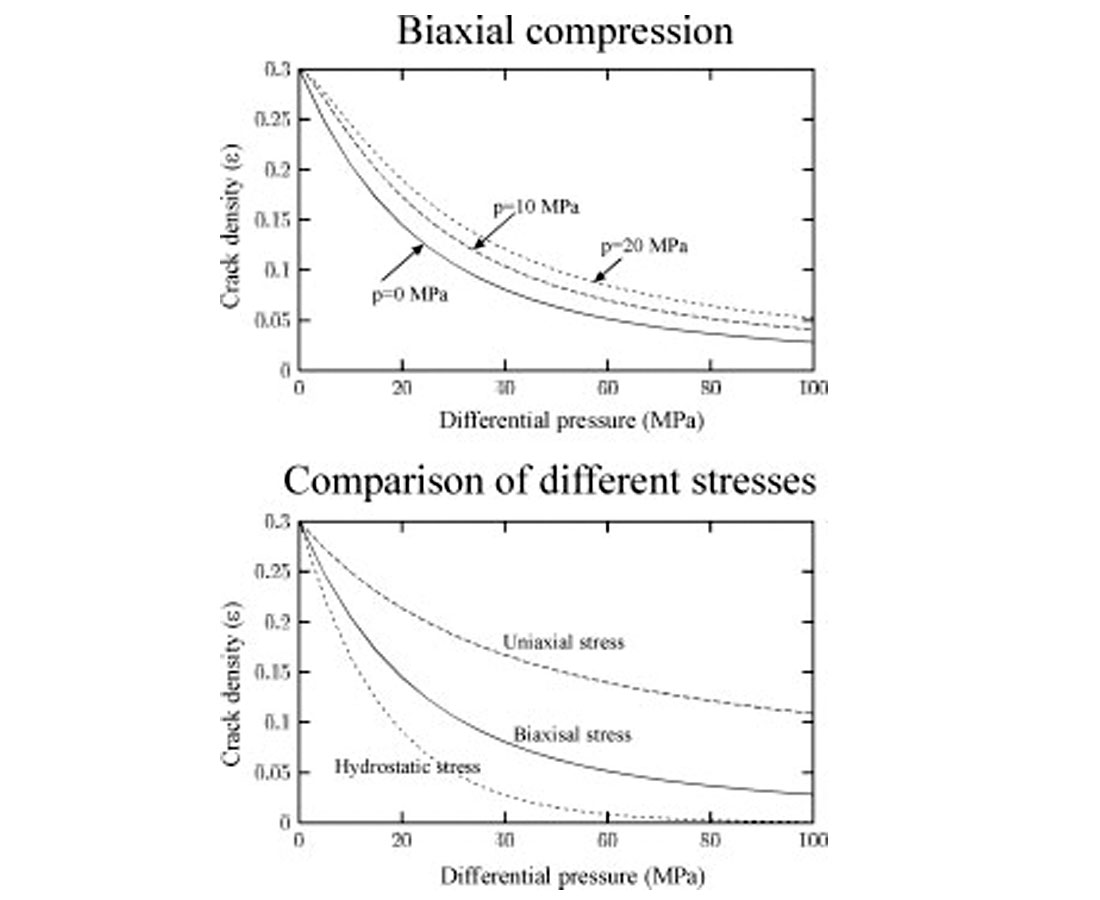
In the following examples, the rock matrix has the following properties, VP = 3.5 km/s, VS = 2 km/s, and the density ρ = 2.3 g/cm3 unless specified otherwise. When the differential pressure is negative, there is no crack closure, thus no change in crack density. However, the change in crack aspect ratio is orientation dependent, so that the effective medium exhibits minor aniosotropy. Once σdiff = σijninj + p is positive, preferentially oriented crack closure occurs and the crack density decreases with increasing compressive biaxial stress (Figure 1). At large stresses only those cracks with normals lying in (or close to) the x3-direction remain open. The presence of a non-zero pressure within the fluid medium increases the crack density at any given value of the compressive stress, as it hinders the process of crack closure (Figure 1). Crack density decreases faster, as a function of differential pressure, for hydrostatic compression than for biaxial compression, which in turn decreases faster than for uniaxial compression. Note that in Figures 1 and 2, we have assumed that rocks are initially isotropic in the stress-free limit.
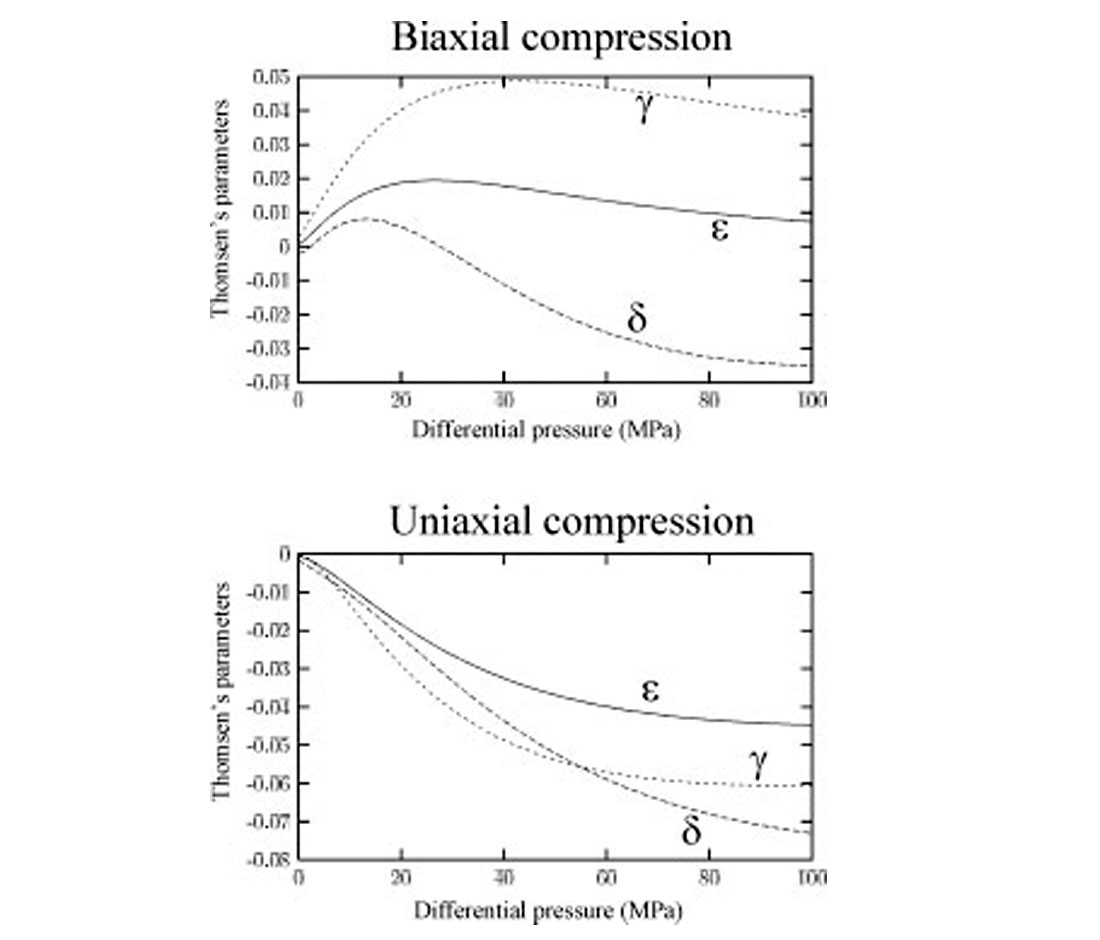
The degree of seismic anisotropy is normally conveniently measured in terms of Thomsen’s three anisotropic parameters (Thomsen, 1986). As can be seen in Figure 2, all three of the parameters reach a maximal value under biaxial or uniaxial compression before decaying towards zero at large differential pressure as the properties of the cracked aggregate approach those of the matrix. We notice that γ, a measure of the S-wave anisotropy, reaches far larger values than ε, a measure of the P-wave anisotropy, so is more likely to be detected. For uniaxial compression, peak values of the anisotropy parameters are reached at larger values of the differential pressure than for biaxial compression. This is largely as a result of the larger crack density at comparative differential pressures for uniaxial compression as opposed to biaxial compression.
The change in shear-wave anisotropy has been observed in field data by Angerer et al. (2002). In 1995, over a period of two months, two nine-component seismic surveys were acquired in the Vacuum field, Wyoming, by the Colorado School of Mines Reservoir Characterisation Project before and after a pilot EOR program of CO2 injection. The injection significantly increased the reservoir pressures from 10.6MPa to 17MPa and altered the fluid composition. Angerer et al. (2002) performed anisotropic analysis on the stacked data, and found that before the injection, the shear-wave time delays lie mostly between ±2%, which means shear-wave splitting is small. However, after the CO2 injection a zone with negative shear-wave splitting is observed. The average value of anisotropy in the anomalous zone is -8%. Peak values lie around -12%. Both shear-wave components decrease differentially after the injection, where the velocity of fast split shear-waves S1 component decreases more than the velocity of the slow shear-wave S2 component. This produces a negative anisotropy where the shear-wave polarised parallel to the maximum horizontal stress direction is slower than the perpendicularly polarised wave. A similar observation of a negative anisotropy (90°-flip in polarisation direction) was made in an over-pressurised reservoir by Crampin et al. (1996). Angerer et al. (2002) also found that the polarisation directions are very heterogeneous in some areas, especially in the pre-CO2 survey and after injection there is better alignment in this quadrant. A possible explanation is that before CO2-injection the reservoir may have been in a very heterogeneous condition as both production and water-injection processes had been in progress for decades. It is suggested that the significant pore-fluid pressure increase between the two surveys may have led to more homogeneously aligned polarisation directions in the whole area. Angerer et al. (2002) concluded that P-waves show little observable changes before and after the CO2 injection, and that significant pore-fluid pressure increases cause the differential opening of low aspect-ratio cracks which leads to decreases in seismic velocities. The S-wave velocities decrease differentially and a significant increase in the degree of velocity anisotropy is observed.
PP- and PS-wave AVO
There are many examples of the use of azimuthal AVO of P-waves to detect fractures (e.g. Lynn et al. 1996). Liu et al. (2001) studied the effects of fluid saturation on the reflectivity of seismic waves, and Liu and Li (2001) compared the AVO responses due to pore pressure and fluid saturation. Here we follow Sayers and Rickett (1997) and consider two cases (Table 1). The first case is a shale/sand model in which sands have lower impedance than the shale, and the second case is also a shale/sand model in which sands have higher acoustic impedance at normal incidence than the encasing shale. It is assumed in this study that the shale is isotropic and the underlying sands are fractured.
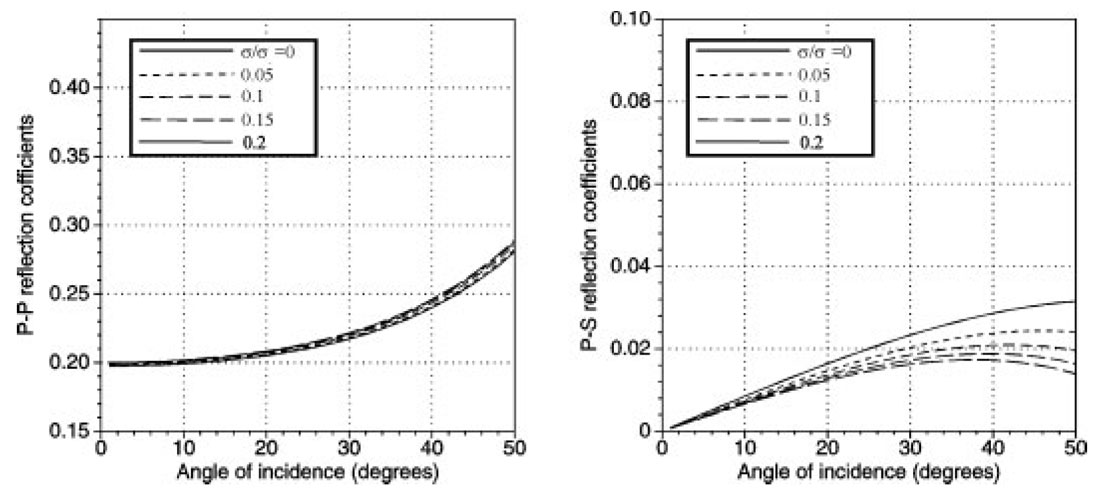

Figures 3 and 4 shows the effects of pore pressure in fractured sands on the plane PP- and PS-wave reflection coefficients (RPP and RPS) for the models used in Table 1. The AVO curves are computed for the azimuths perpendicular to fracture orientations, as there is very little difference in the AVO variation with saturation in the direction parallel to the fractures at all angles. For moderate angles of incidence the curves begin to separate, with the curves corresponding to the PS-waves becoming increasingly larger than for the PP-waves. The overall magnitude of the converted PS-waves is larger than that of the primary reflected PP-waves. The behaviour of the PP- and PS-wave response can be explained by equations (13) and (14) of Liu et al. (2001). The presence of fluids affects P-wave velocity more than S-wave velocity, and thus introduces an increasing/decreasing amplitude with offset for low/high impedance. However, because of the low/high impedance, the AVO terms due to fluids (given in equation (15) of Liu et al. 2001) will have a different sign from the corresponding isotropic AVO terms, and this will result in either a reduction or an increase in the sensitivity of P-wave AVO. For the PS-waves impedance contrast will always be positive and have the same sign as the anisotropy term sin2θ, increasing the sensitivity of PS-wave AVO, with the presence of an additional near-offset term further enhancing the response.
| Model | Model Rock | Vp (km/s) |
Vs (km/s) |
Density (g/cm3) |
|---|---|---|---|---|
| Table 1. Parameters used to compute reflection coefficients (Sayers and Rickett 1997). | ||||
| Model 1 | Shale | 2.73 | 1.24 | 2.35 |
| Sand | 2.02 | 1.23 | 2.13 | |
| Model 2 | Shale | 3.30 | 1.70 | 2.35 |
| Sand | 4.20 | 2.70 | 2.49 | |
Compared with the similar curves computed for the effects of saturation shown in Liu and Li (2001), we can conclude that it is difficult to differentiate the AVO effects caused by variation of pore pressure and fluid saturation from PP-waves alone. PS-waves, though not sensitive to fluid saturation, are particularly sensitive to pore pressure. So a combination of PP- and PS-waves may potentially be used to distinguish the two effects. Landrø (2001) presents an excellent example of using time-lapse AVO to differentiate pore pressure and fluid saturation in the Gullfaks field in the North Sea, where the pore pressure increased by approximately 5 to 6 MPa because of water injection. He then developed a method to estimate saturation effects and the effects of pore pressure from AVO data. He found that the amplitude behaviour of seismic data is sensitive to changes in pore pressure and saturation and that the two effects have different AVO responses. He speculates that multicomponent seismic data will probably be a complementary tool to better discriminate between various production effects for time-lapse seismic projects. Our study further supports this speculation.
Synthetic studies
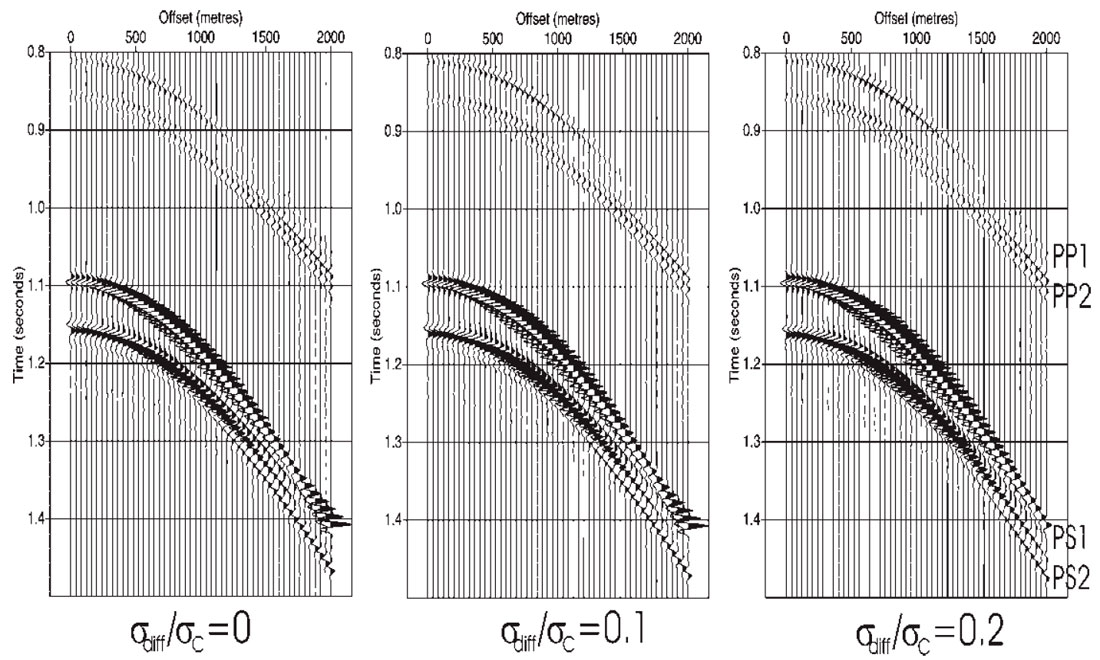
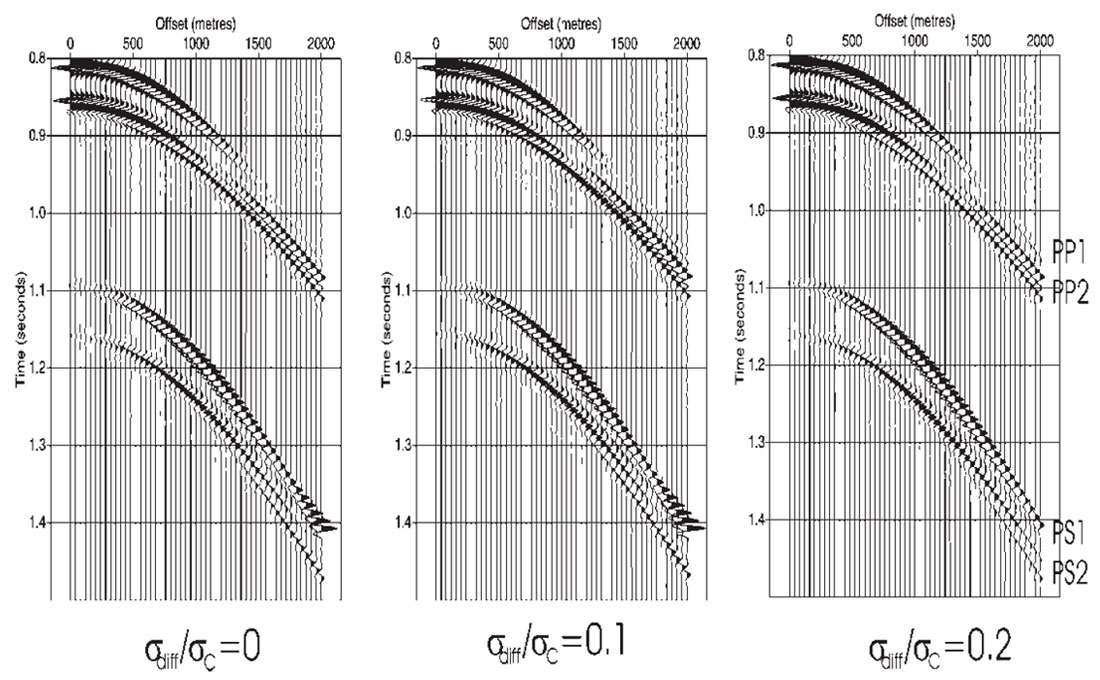
Although the reflection coefficients shown in the previous section vary with fluid pressure, a complete calculation should include the effects of geometrical spreading, transmission loss and multiple reflections. For this reason, synthetic seismograms are computed for a model with a shale/sand/shale sequence using the reflectivity method (parameters of sand and shale in Model 2 are used and listed in Table 1). The fractured sand layer is assumed to lie at a depth of 1km and has a thickness of 100m (Figure 5). We use a spread with 50 equally-spaced three-component receivers over a maximum of 2km offset and an explosive source with a 40m interval, which yields an angular coverage of approximate 45o for the incident angles and is sufficient for examining the amplitude variations.
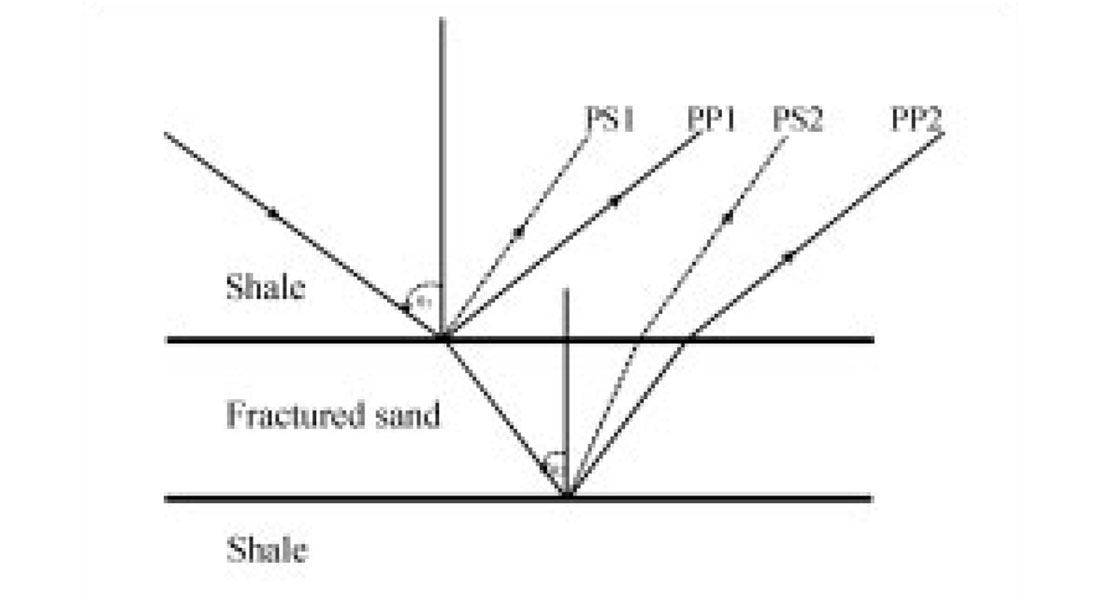
Figures 6 and 7 show horizontal and vertical components of the synthetic seismograms calculated for the model in Figure 5, each figure displaying the comparison of synthetic seismograms computed for three differential pressures. The vertical two-way travel-times for PP- and PS-reflections are between 0.8s and 0.9s for PP-waves and 1.1s and 1.2s for PS-waves, respectively (see Figure 5 for the identification of different arrivals). The amplitudes of the PP event show significant differences in amplitude variations with offset. There are also differences in amplitudes computed for fractures with different differential stresses. In contrast, the difference of AVO response for the PS event is significant and obvious, which also agrees with the previous results of reflection coefficients. Also, the amplitude of the PS event varies sharply with offset and reaches its maximum at far range offsets at about 1km to 1.5km, with incidence angle less than 30° to 40°. Note that the AVO difference can also be observed in vertical components for the PS events, but the AVO difference for the PP event cannot be seen clearly on the vertical components. This implies that AVO response relying on vertical components may lead to inaccurate results and that the emergence angle at the surface where the receivers are located has a very significant effect on the AVO response.
Conclusions
In this article, we have used the theoretical model developed by Hudson (2000) and Tod (2002) to show that the effect of an increase in the differential pressure will increase the polarization of the distribution of remaining cracks, and as a result will serve to increase the anisotropy, the total crack density will decrease, thus decreasing the anisotropy. These two competing processes explain the increase of anisotropic parameters with differential pressure to a maximum absolute value, before a decay towards zero as the differential pressure increases yet further, as the properties of the effective material approach those of the isotropic matrix - in this large pressure limit, all of the original cracks are effectively closed, so that the material resembles the uncracked isotropic matrix.
We have demonstrated that the combined use of conventional P-wave and converted-wave PS AVO approaches may offer distinct advantages in the determination of fluid pressure. AVOs are shown to be sensitive to fluids, and this is confirmed in both the results from reflection coefficients and synthetic seismograms. It appears that converted-wave PS-wave AVO retains the advantages of P-waves and S-waves for characterising fractures and fluid saturation. In a fractured clastic reservoir, PS-wave reflectivity is sensitive to both fluid pressure and the presence of fracturing. In contrast, the PP-waves AVO is suitable for gas detection but not fracturing. In addition, a relatively small offset coverage is required to reveal the AVO effects (30° to 40° incident angles). Another advantage of PS-wave AVO analysis is that it can be very useful when the acoustic impedance contrast between seal and reservoir rocks is close to zero and the average Poisson’s ratio across the interface becomes large (>0.4), as is often the case for unconsolidated clastic sediments. We conclude by emphasising our message that combined PP- and PS-waves offers an optimal approach to characterise the effects of pore pressure and to differentiate the effects of pressure and saturation.

Acknowledgements
The work was sponsored by the Natural Environment Research Council (NERC) through project GST022305, and sponsors of the Edinburgh Anisotropy Project, and is published with the approval of the Executive Director of the British Geological Survey (NERC).


Join the Conversation
Interested in starting, or contributing to a conversation about an article or issue of the RECORDER? Join our CSEG LinkedIn Group.
Share This Article