The Eastern Newfoundland offshore region has experienced a resurgence in exploration activity over recent years, spurred on by several significant petroleum discoveries in the Flemish Pass Basin, northeast and along geological trend from the world-class deposits in the Jeanne d’Arc Basin. In 2012 and 2013, PGS, TGS, and Nalcor Energy undertook a large-scale multi-client survey to acquire a network of regional long offset 2D seismic reflection and gravity profiles (22,500 km) across the East Orphan Basin, Flemish Pass Basin and Flemish Cap. The survey was designed to provide regularly sampled regional coverage over an area that experienced multiple rifting episodes with multiple orientations as part of the opening of the modern North Atlantic Ocean during the Mesozoic. Seismic interpretation was done to identify rift and post-rift sequences within the thick sedimentary basins and map their areal extent. To aid in the seismic interpretation of the top of basement beneath these megasequences, 2D forward modelling of the coincident gravity data was undertaken using the interpreted boundaries of these megasequence packages as constraints. Insights obtained from the gravity modelling were subsequently used to update the seismic interpretation. The use of these complementary geophysical datasets with an iterative approach was designed to provide greater confidence in the final seismic interpretation but also allowed for crustal-scale constraints to be generated to improve the broader tectonic understanding of the region.
Study area
The East Orphan Basin lies at the northeastern edge of thinned continental crust of the Newfoundland and Labrador margin, immediately to the northwest of the Flemish Cap (Figure 1). The basin was formed and subsequently reactivated during three main rifting episodes that occurred during the Triassic, the Late Jurassic to Early Cretaceous, and the Late Cretaceous. These rifting episodes were oriented roughly NW–SE, W–E, and SW–NE, respectively, resulting in complex faulting within the basin. The sediments of the Orphan Basin overlie basement terranes that were stitched together during the closing of the Iapetus Ocean during the Caledonian-Appalachian orogeny in Paleozoic time. The original Mesozoic opening of the basin occurred along the pre-existing basement structures and tectonic fabrics from the Caledonian-Appalachian orogeny (Shannon, 1991).
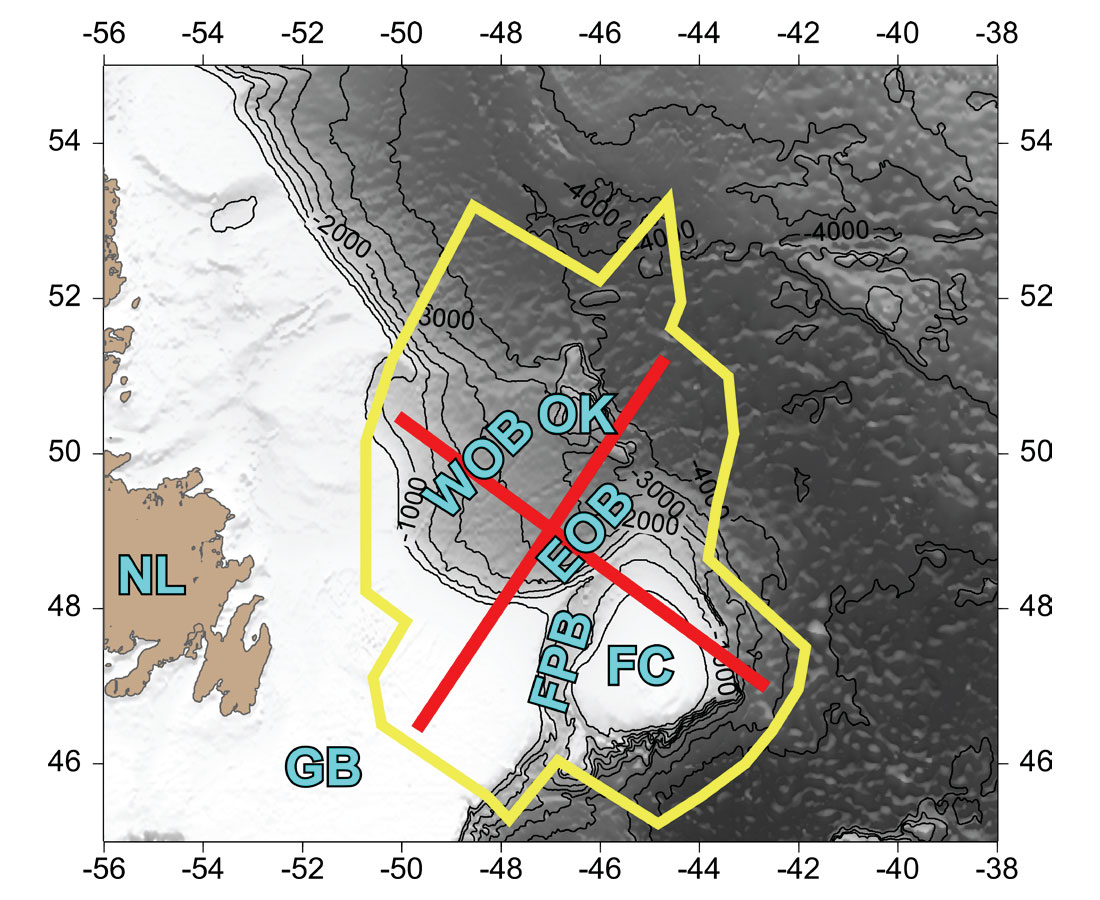
Seismic reflection surveying for petroleum exploration has been ongoing in the Orphan Basin for several decades (Smee et al. 2003). Meanwhile, targeted deeper crustal-scale seismic reflection studies have been limited to those from the Geological Survey of Canada’s Frontier Geoscience Program (FGP), specifically profiles 84-3 and 87-4 (Keen et al. 1987; Keen & de Voogd 1988; Welford et al. 2010). Profile 84-3 transected the West Orphan Basin and extended SW– NE from the Grand Banks, across the West Orphan Basin to beyond Orphan Knoll, an isolated continental fragment lying inboard of the continent–ocean boundary (Keen et al. 1987; Keen & de Voogd 1988). Subsequently, coincident wide-angle seismic reflection/ refraction surveying was conducted along this same profile and revealed that the Orphan Basin is underlain by stretched continental crust extending more than 400 km to Orphan Knoll (Chian et al. 2001).
Data acquisition
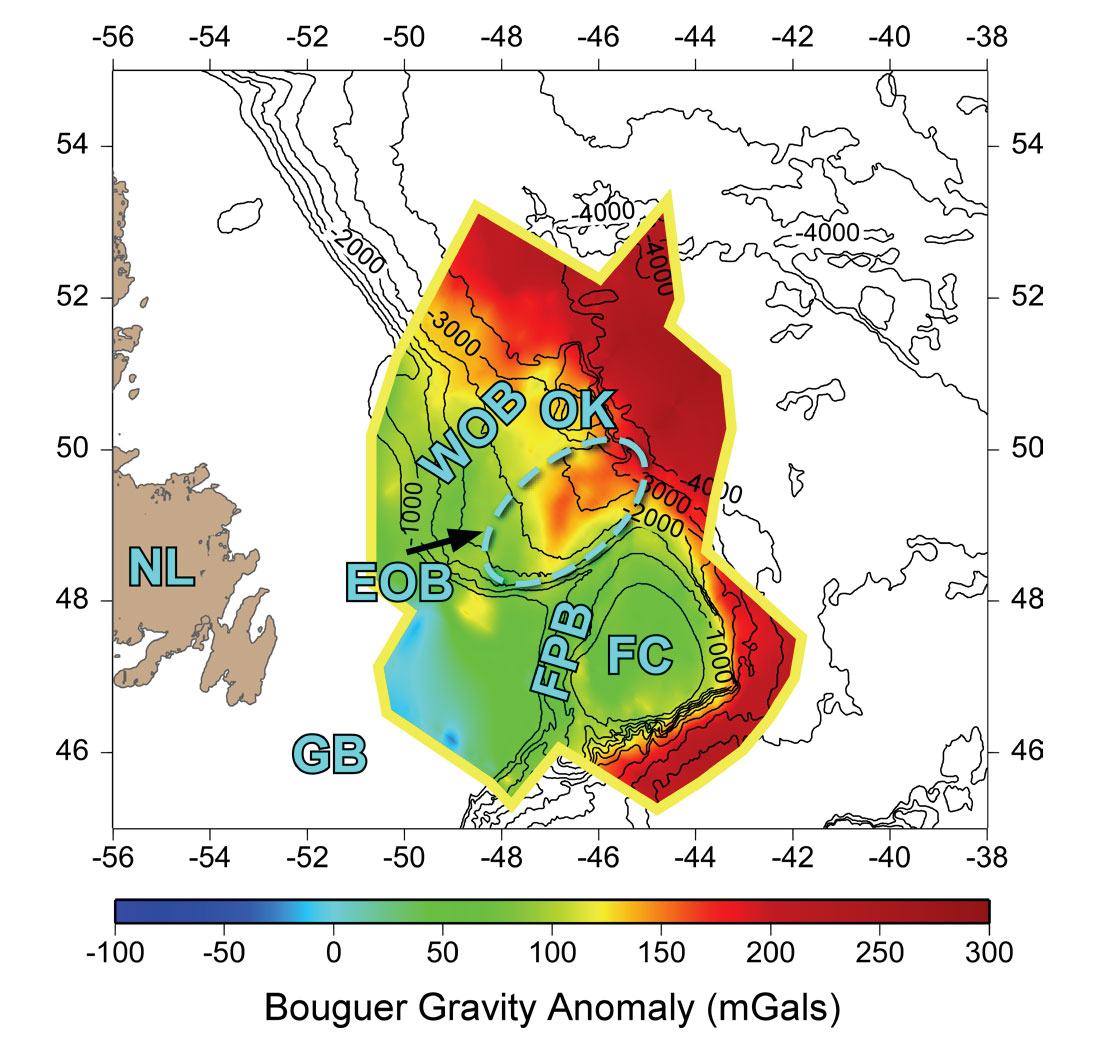
Regional long offset 2D seismic reflection and gravity profiles were acquired by PGS, TGS, and Nalcor Energy in 2012 and 2013. A total of 57 lines were acquired resulting in a total coverage of 22,500 km. Lines were oriented either NW–SE or SW–NE and varied in length from 115 to 719 km. In addition to a number of sparsely distributed regional lines, a dense concentration of seismic and gravity lines was focused on the East Orphan Basin and the Flemish Pass Basin. TGS performed the seismic reflection data processing in time and also performed the Bouguer correction of the acquired gravity data (Figure 2).
Seismic interpretation
Interpretation of the processed time sections from the seismic reflection survey was undertaken at Nalcor Energy with the goal of identifying the main boundaries that subdivided the large sedimentary basins into rift and post-rift megasequences. These boundaries corresponded to the top of basement and the top of the Cretaceous sediments. While the Base Cenozoic is easily interpreted on the seismic sections, interpreting the top of basement was complicated by the complexity of the imaged rifted structures as well as the poorer data quality at depth. Gravity modelling was thus undertaken to reduce uncertainty in the seismic basement pick.
Gravity modelling
The Bouguer gravity data over the survey area (Figure 2) generally show a regional distinction between the mildly positive gravity anomalies of the Grand Banks, Flemish Cap and Orphan Basin, and the stronger positive anomalies associated with oceanic crust of the North Atlantic Ocean. One exception to this trend lies in the East Orphan Basin where the higher positive gravity anomalies appear to extend further landward. This localized pocket of anomalously high gravity anomalies suggests the presence of an extra source of mass in the East Orphan Basin relative to the rest of Orphan Basin.
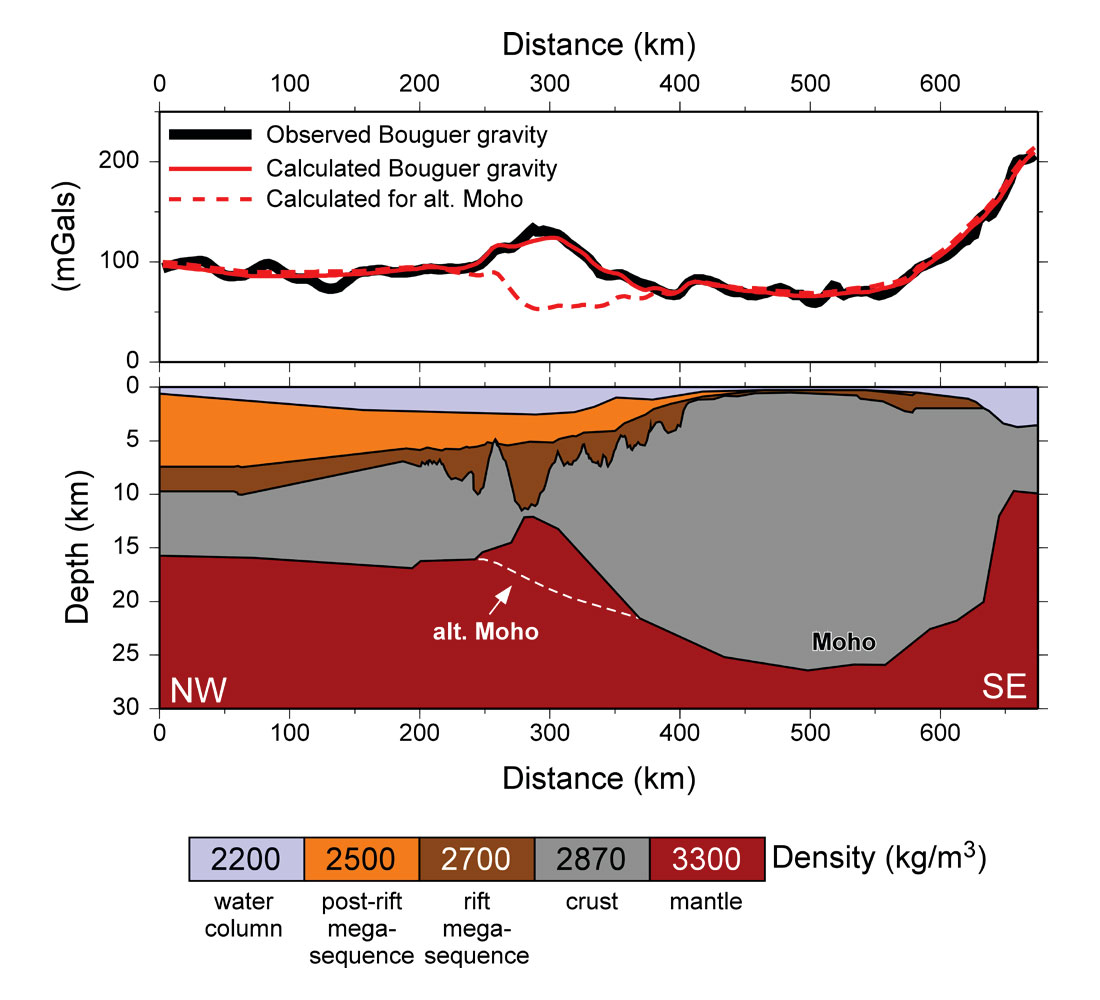
In order to construct density models based on the time processed seismic reflection sections, the interpreted time horizons were converted to depth using constant velocities for each megasequence. The velocities used in the depth conversion were 1450, 2500, and 2700 m/s for the seawater, the post-rift sequence, and the rift sequence, respectively. Once the depth of the boundaries had been determined, density models were constructed using constant densities of 2200, 2500, 2700, 2870, and 3300 kg/m3 for the seawater, post-rift sequence, rift sequence, crust, and mantle, respectively. These densities were obtained using the velocity to density conversion equation presented by Ludwig et al. (1970). As the Bouguer data were used for the modelling, the seawater density corresponded to the reference density of 2200 kg/m3 used for the Bouguer correction by TGS. A constant density of 2870 kg/m3 was assigned to the entire crust for lack of available regional density constraints. While this density assignment represents a necessary oversimplification, it is sufficient for obtaining first-order constraints on the geometry of the base of the crust.
The gravity modelling was undertaken using the GM-SYS Profile Modelling software from GeoSoft Inc. Preliminary gravity modelling was done assuming that all of the interpreted sedimentary horizons were correct and that the depth conversion placed the boundaries at their true depth. The Moho, or base of the crust, was the only part of the model that was adjusted in order to fit the gravity observations. Suspect regions were flagged wherever the crust was effectively pinched out or where no adequate fit could be achieved without altering the sedimentary interpretation. For these regions, the seismic interpretation was re-examined and, if geologically reasonable and consistent with the seismic data, adjusted to better agree with the gravity data. The density models were then updated to reflect the new seismic interpretation. Through several iterations of seismic interpretation and gravity modelling, final density models were developed for all of the seismic lines in the survey (example shown in Figure 3).
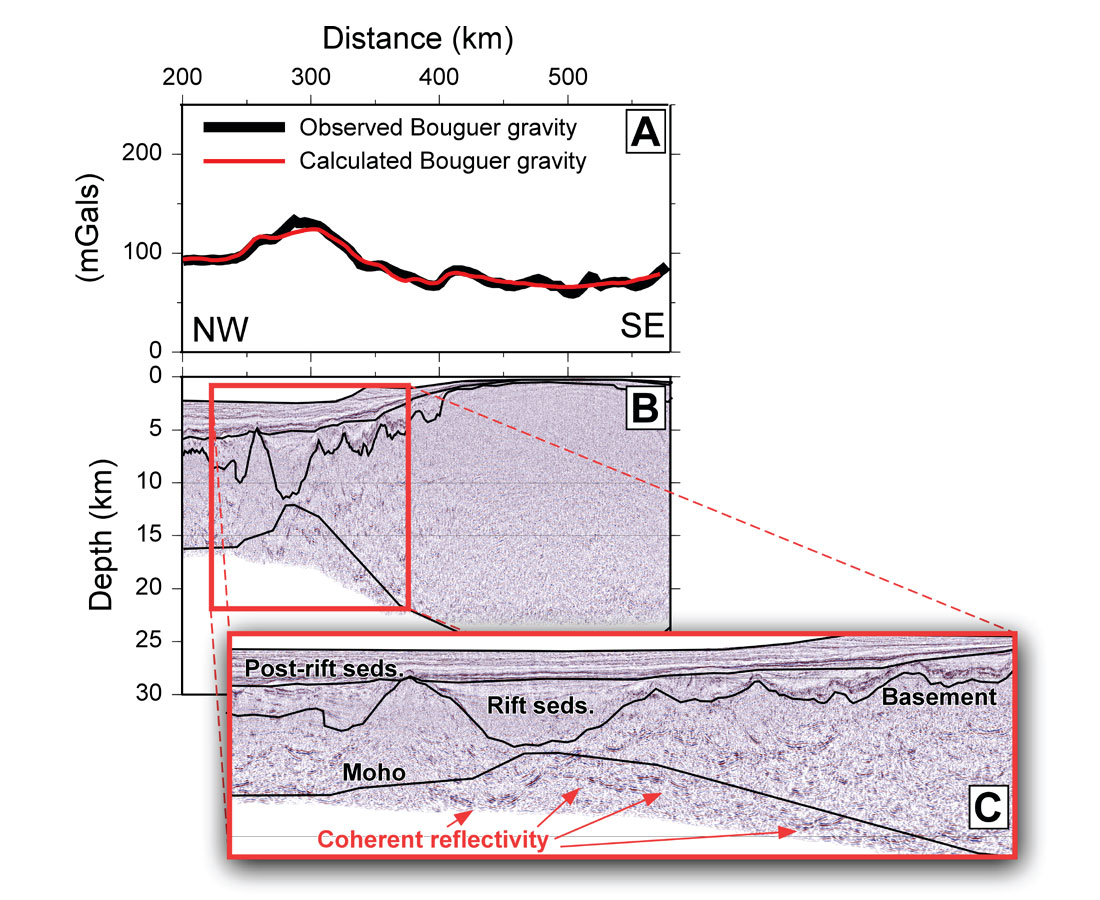
The individual final density models provide basement and Moho depth constraints across the study area. These constraints are consistent with the observed gravity and with the seismic reflection sections. In many instances, the density models revealed Moho depths that were consistent with coherent reflections on the depth converted seismic sections (Figure 4). Without the gravity modelling, these coherent reflections could have been erroneously interpreted as sedimentary or crustal structures when they likely correspond to the base of the crust.
Crustal thickness
Once the depth to basement was sufficiently constrained using the seismic reflection data and the gravity modelling, the modelled base of the crust was combined with the depth to basement in order to determine the crustal thickness across the survey area. The resulting crustal thickness map (Figure 5) reveals that Flemish Cap is on the order of 25 to 30 km thick while the Orphan Basin shows greater variability, with a thicker spine of 12 to 15 km thick crust dividing the West and East Orphan Basins, which are each less than 10 km thick.
Along many seismic lines across the East Orphan Basin, despite shallowing the basement as much as possible to allow for more high densities from the crust to contribute to gravity highs, the Moho also had to be brought up to a shallower depth to provide enough mass from the mantle into the model to satisfy the gravity observations where an anomalous positive gravity high is observed (Figures 2 and 3). Toward the northeast limit of the East Orphan Basin, several of the profiles even required two zones of mantle upwelling to reproduce the observed gravity anomalies.
By combining the modeled results from all of the individual density models, zones of hyper-extended continental crust were identified and correlated across multiple seismic lines, revealing extensive zones of hyper-extended continental crust in the East Orphan Basin (Figure 5). Such zones had been previously postulated based on derived crustal stretching values, beta, from regional constrained 3D gravity inversion work over the same area using satellite gravity data (Welford et al., 2012; Figure 6). These zones of hyper-extended crust correspond with beta values greater than 3.5, the threshold above which embrittlement of the entire crust can occur and faults can extend through the crust and lead to the serpentinization of the mantle, according to numerical modelling studies (Pérez-Gussinyé & Reston 2001; Pérez-Gussinyé et al. 2003). To date, the limited seismic refraction profiling conducted in the Orphan Basin has not revealed evidence of mantle velocities consistent with serpentinized mantle (Chian et al., 2001) but the zones of hyper-extended crust from this study have not yet been investigated using seismic refraction techniques.

The map of crustal thicknesses derived from the individual 2D forward modeled gravity lines shows a zone of hyper-extended continental crust running along the axis of the East Orphan Basin that branches into two zones toward the northeast (Figure 5). These zones and their branching character show a remarkable correlation with the locations of Cretaceous fans identified on the basis of AVO anomalies in the newly acquired seismic reflection data. These fans tend to align themselves with the northwestern limit of the hyper-extended zones and even line up with the northwestern limits of the two branches of hyper-extended crust to the northeast. This apparent spatial link between the hyper-extension of the continental crust in the East Orphan Basin and the local emplacement of Cretaceous fans may indicate that tectonics were the dominant influence on sediment deposition during this stage of rifting (Prosser, 1993). The orientation of the hyper-extended zone within the East Orphan Basin also follows the Caledonian-Appalachian orogenic trend, which may indicate that inheritance played a role in intensely focusing hyper-extension in this area (Manatschal et al., 2015).

Conclusions
Zones of hyper-extended continental crust have been identified across the East Orphan Basin using an iterative approach of seismic interpretation and 2D forward gravity modelling. The main zone of hyper-extension follows the axis of the East Orphan Basin and branches into two zones toward the northeast. The northwestern limits of these core and branched zones line up with Cretaceous fans identified on the basis of AVO anomalies, suggesting a strong tectonic influence on sediment deposition during rifting.
This study demonstrates the importance of combining seismic interpretation with gravity modelling in order to increase confidence in the seismic interpretation and ensure that the derived Earth models are consistent with all of the available geophysical information. Without the use of the gravity modelling in the East Orphan Basin, many deep reflectors that we can now recognize as crustal or from the Moho, could have been erroneously attributed to sedimentary structures. A broader understanding of the crustal implications of the seismic interpretation of sedimentary basins can provide greater insight into the tectonic and thermal evolution of a basin or an entire margin.

Acknowledgements
We would like to thank TGS and PGS for permission to show portions of the seismic reflection data.


Join the Conversation
Interested in starting, or contributing to a conversation about an article or issue of the RECORDER? Join our CSEG LinkedIn Group.
Share This Article