Abstract
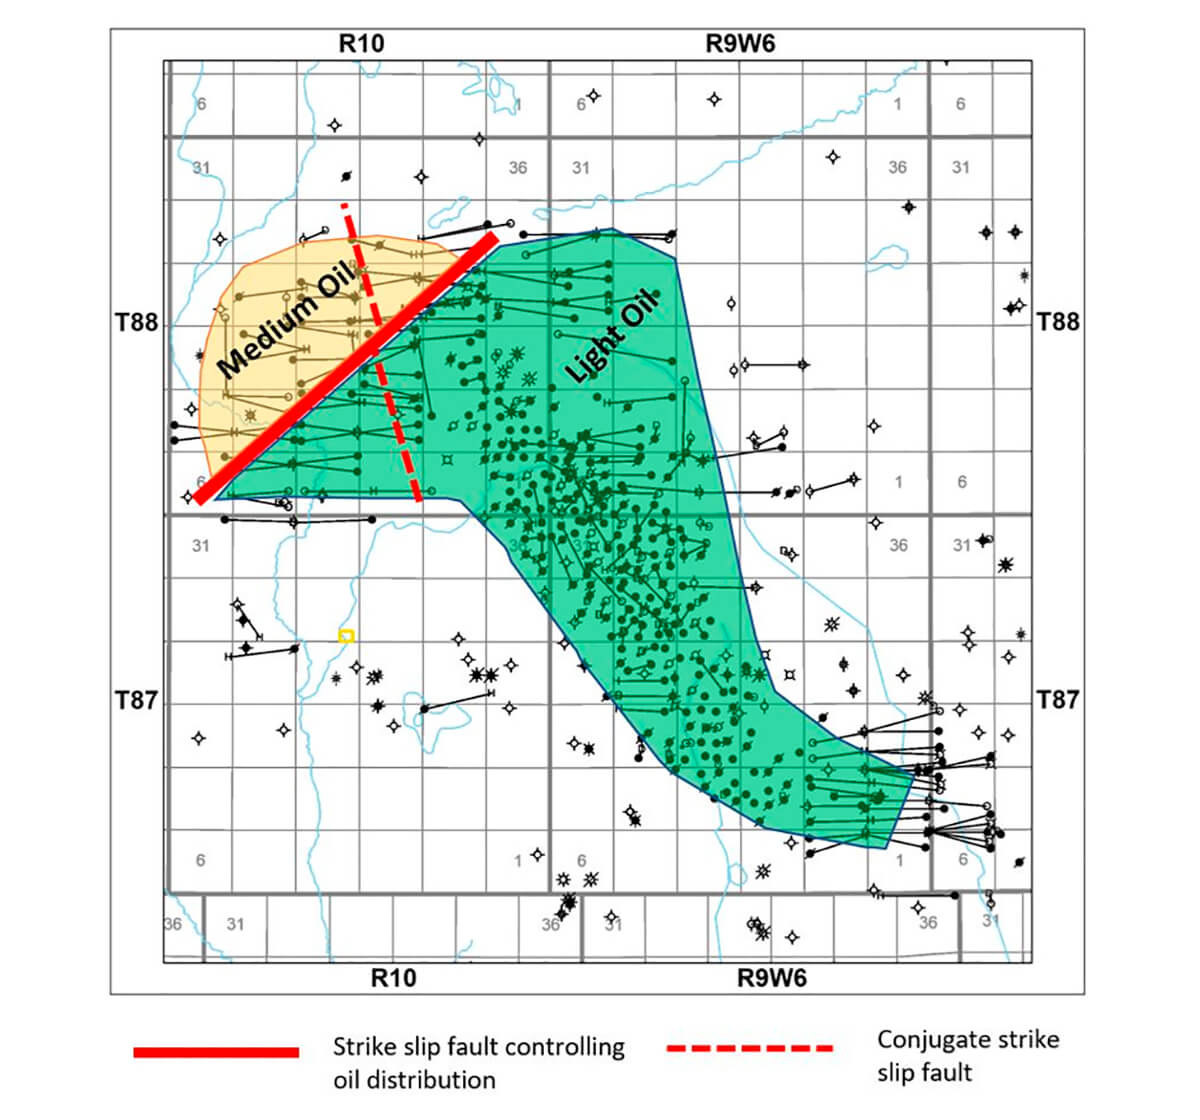
Faults have always played a major role in the trapping of hydrocarbons, usually by creating structural traps. Faults with associated vertical displacement or folding are often visible on seismic data. Strike-slip faults with no vertical displacement, on the other hand, are notoriously difficult to detect on seismic data. This article discusses a case study where strike-slip faults are identified on 3D seismic and play an important role in hydrocarbon entrapment. A number of horizontal wells were drilled on both sides of a strike-slip fault, and some were drilled through the fault face. Wells drilled through the fault face showed evidence, on strip logs, of the fault gouge. The oils produced on either side of the fault were radically different, suggesting that the strike-slip fault acted as a permeability barrier to fluid migration. We often think of faults and fault damage zones as conduits for fluid flow, but in this case the strike-slip fault is a barrier. This concept is an interesting example of the integration of 3D seismic, well site geology, geomechanics, and oil chemistry to confirm the existence of a strike-slip fault that created the unusual juxtaposition of two radically different oils. Figure 1 provides an overview of the discussion to follow. Perhaps in your career you have come across examples of unexplainable reservoir fluid differences; maybe this article will suggest an alternative explanation.
Introduction
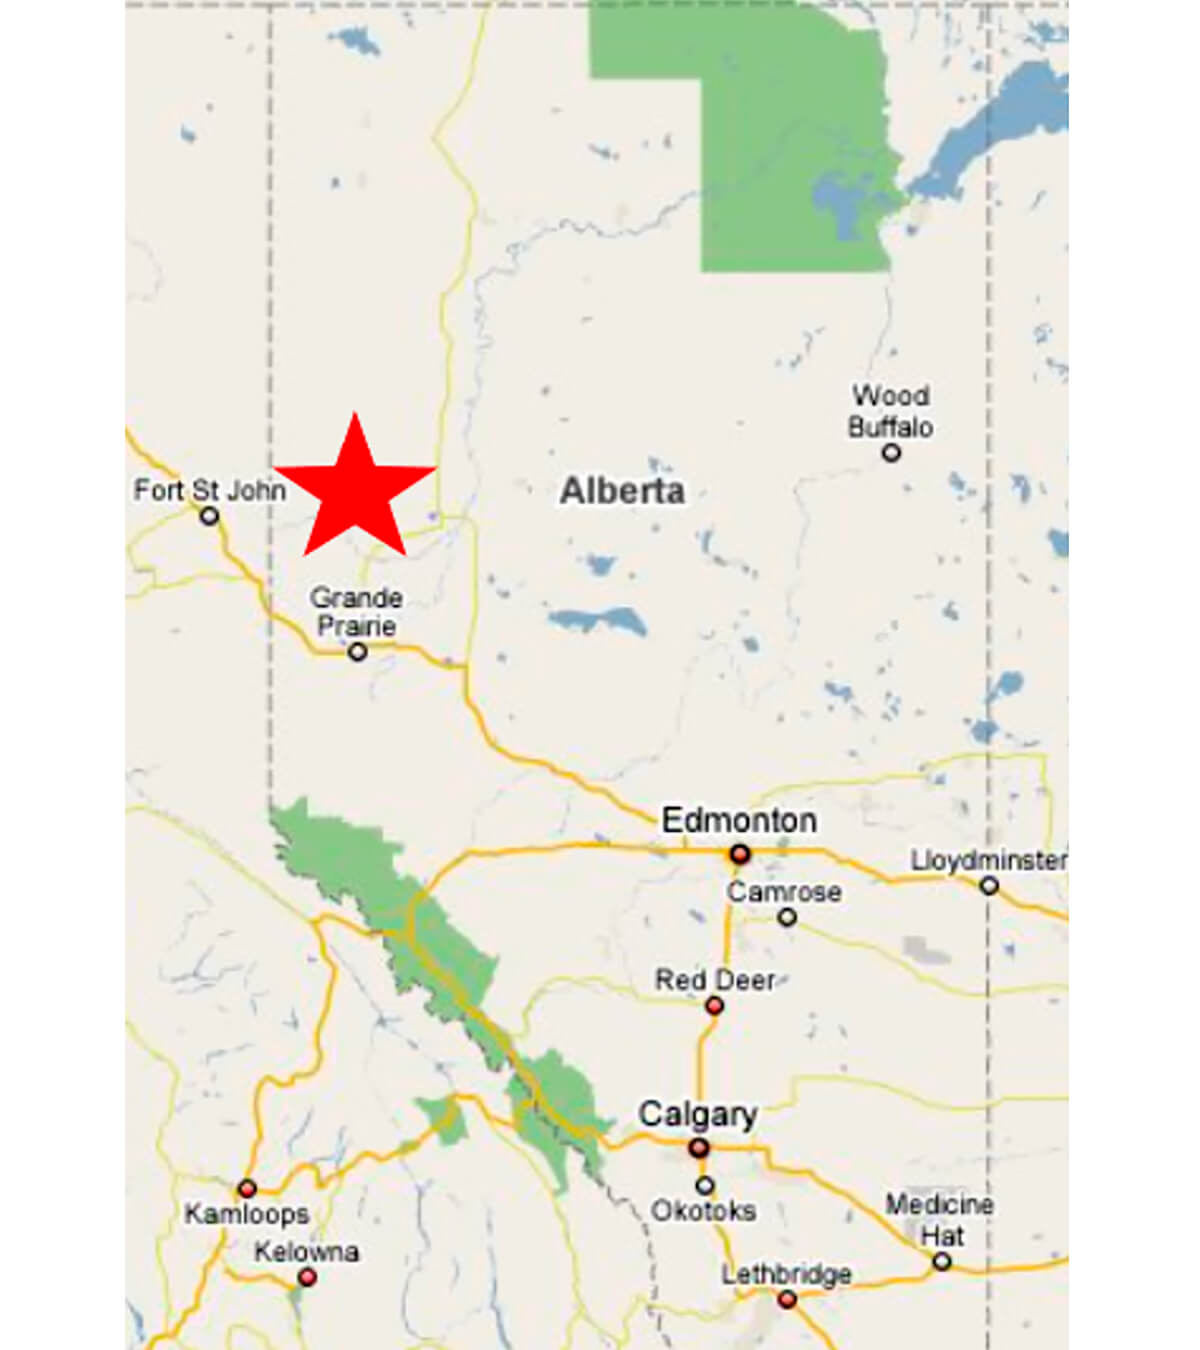
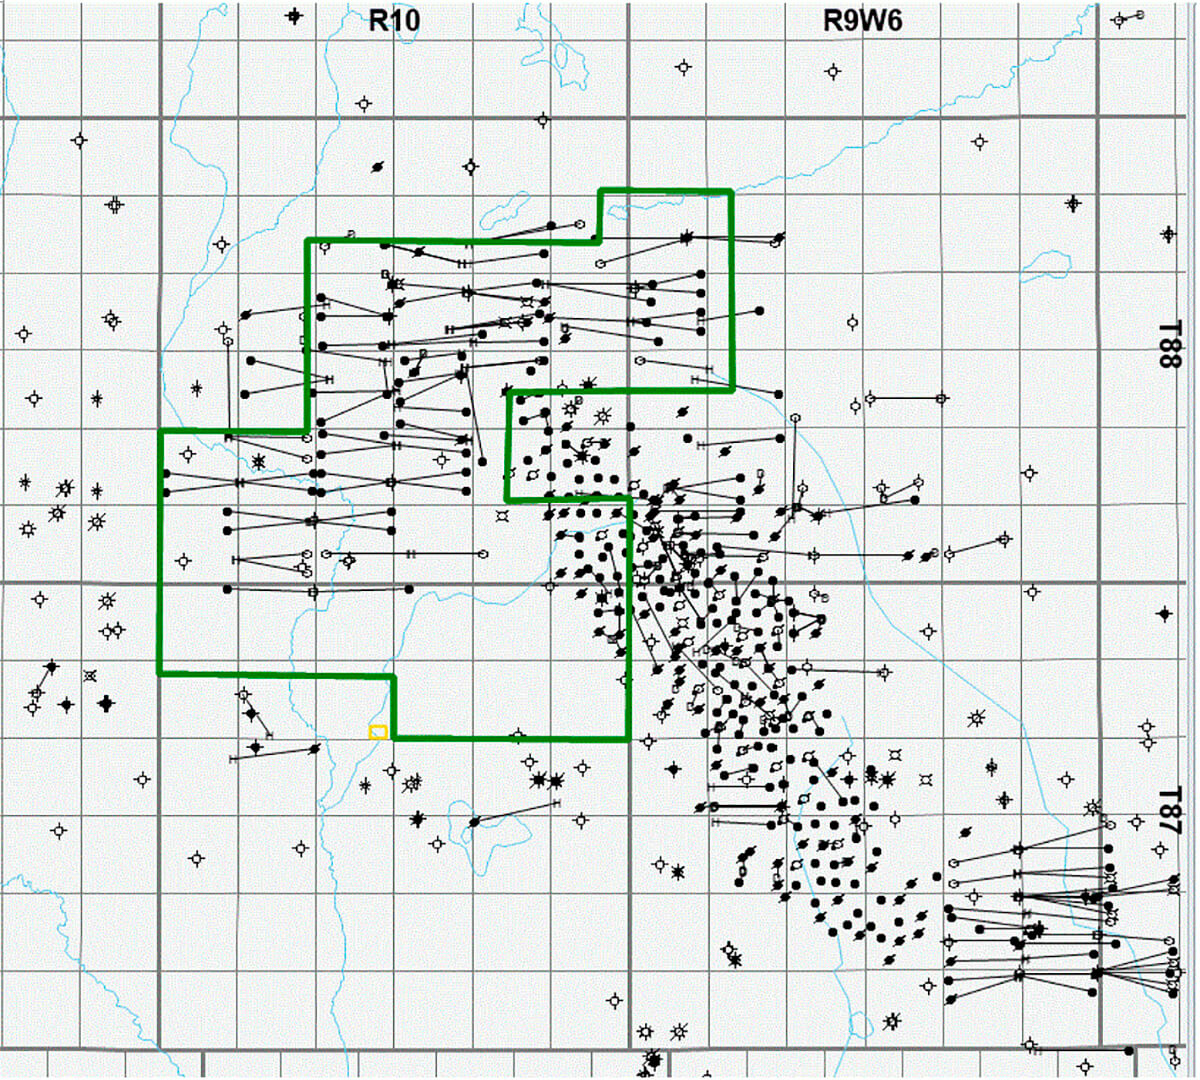
This case study is located in the Worsley area of NW Alberta, about 100 km north of Grand Prairie (see Figure 2). Oil production comes from the Triassic-aged Charlie Lake Formation. Figure 3 shows the area of interest. The pool was discovered in 1996 and was initially developed with vertical wells. All wells require hydraulic fracturing to produce, and the pool is considered a tight oil play. In 2007, Birchcliff Energy purchased the pool and focussed their drilling on pool extensions with multi-stage, hydraulically fractured horizontal wells both in the SE end and in the NW end of the existing pool. This article will focus on the NW end of the pool, where two proprietary 3Ds were acquired by Birchcliff Energy in 2011 and 2014. The merged outline of the two 3Ds is shown in the green outline in Figure 3. Even though the 3D seismic was not expected to resolve the thin sweet spot of the reservoir, an economic case was made justifying the acquisition of the 3Ds by aiding and improving the ability of the horizontal well bores to stay in zone. A number of horizontal wells were drilled before the acquisition of the 3Ds with mixed results.
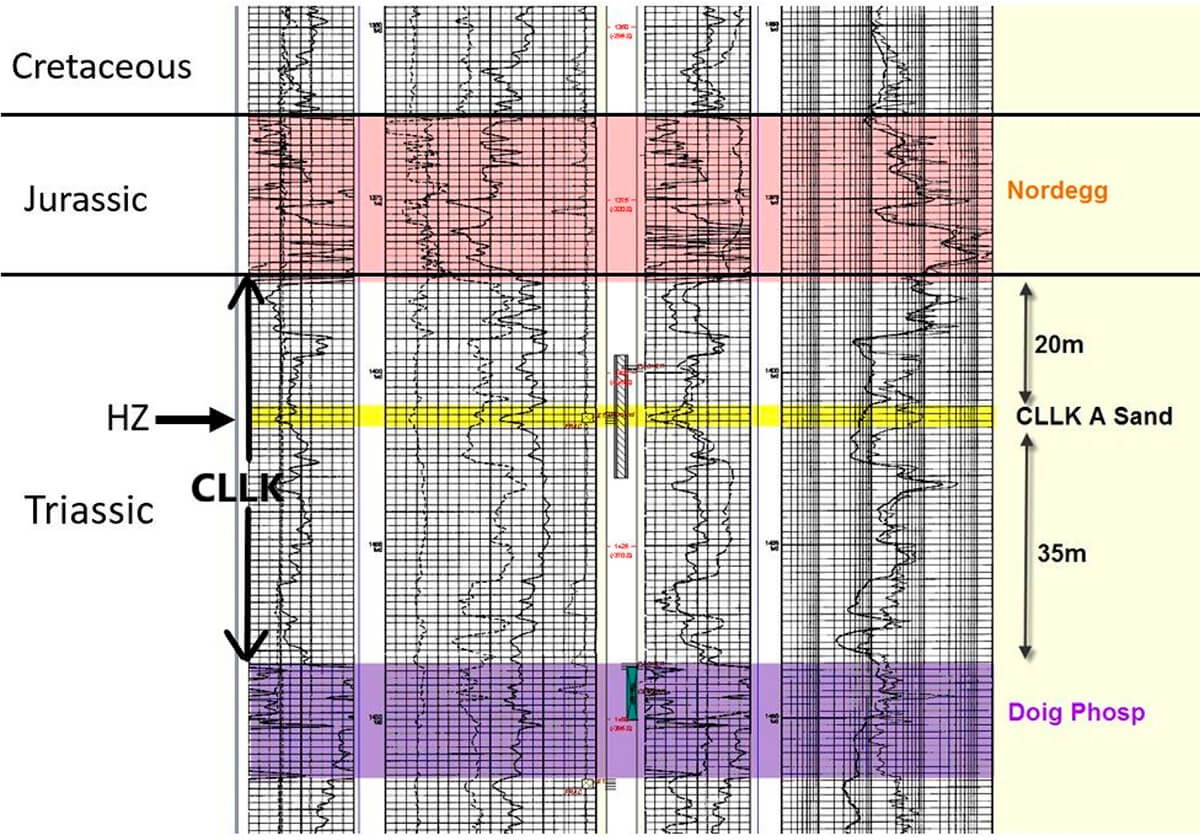
The Charlie Lake (CLLK) Formation is a bioturbated, dolomitic sandstone of about 55 m thickness (Mossop, G. and Shetsen, I., 1994). The horizontal wells in the NW end of the pool targeted the thin sand interval highlighted in yellow in Figure 4. Because the wells were hydraulically fractured, production was also expected to come from tighter intervals of the Charlie Lake above and below the yellow sand. Below the Charlie Lake is the organically rich Doig Phosphate Formation highlighted in purple. The Doig Phosphate is a well-known source rock in NW Alberta. Above the Charlie Lake (highlighted in brown in Figure 4) is the Jurassic-age Nordegg Member, also a potential source rock in NW Alberta (Riediger, C.L., 1990).
This article is not meant to be an in-depth discussion of 3D seismic attributes for fault identification, nor is it a treatise on strike-slip faults (Liao, Z. et al., 2017), but it is meant to show how the integration of straightforward 3D seismic interpretation and well site strip logs can explain the unique distribution of two different oils in the same reservoir. The first section will discuss the observations and interpretation of the 3D seismic. The second section will delve into the stress state implied by the faulting. The third section will discuss the fault damage zone or fault gouge as interpreted from the horizontal well strip logs. The fourth section will discuss the occurrence of the two different oils and our hypothesis for the explanation of the timing, migration, and trapping of these oils.
3D Seismic Observations
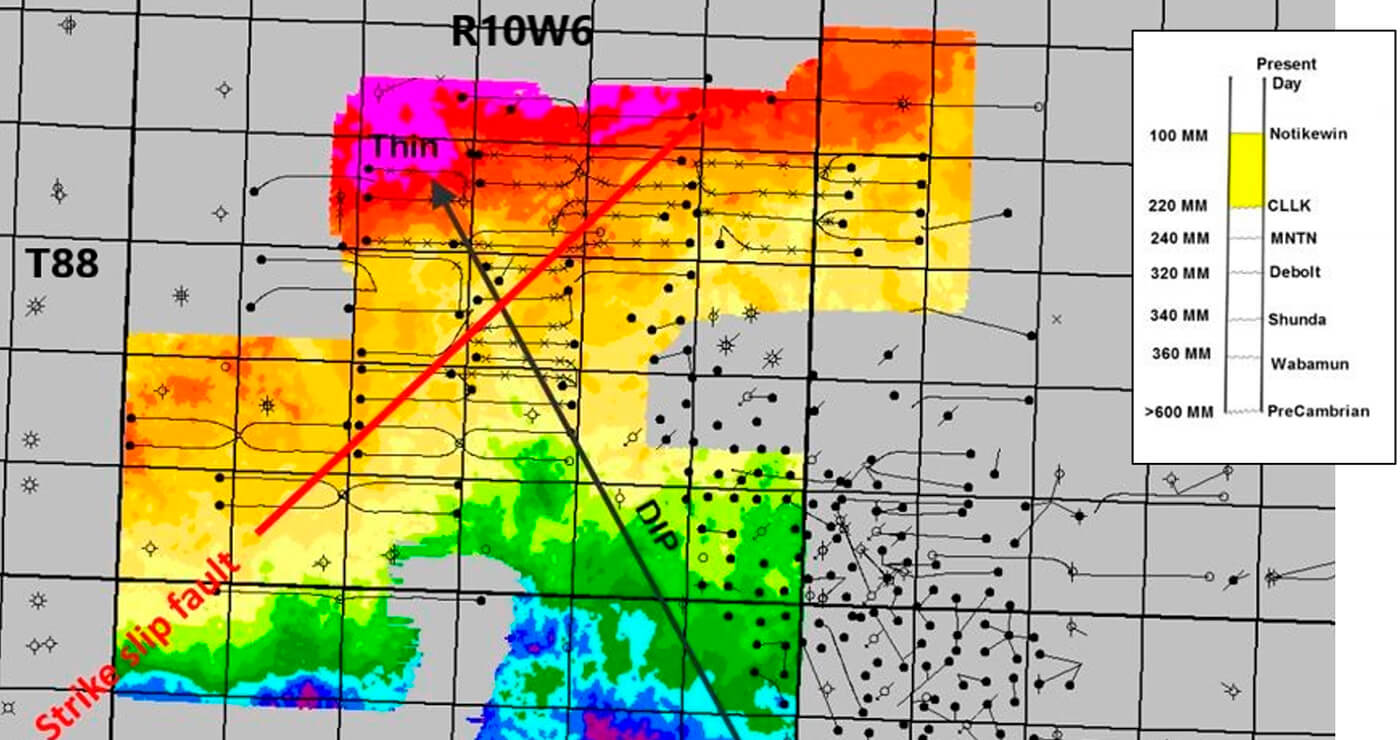
Figure 5 is a CLLK depth map generated from the 3D seismic and well control. The regional dip is down to the SW. Shown on the map in bold black is the position of the key NE-SW-trending strike-slip fault. There is no apparent vertical offset associated with this fault, and it only became obvious when looking at various seismic attributes. This is the fault that we are proposing as being responsible for the trapping of the two different oils.
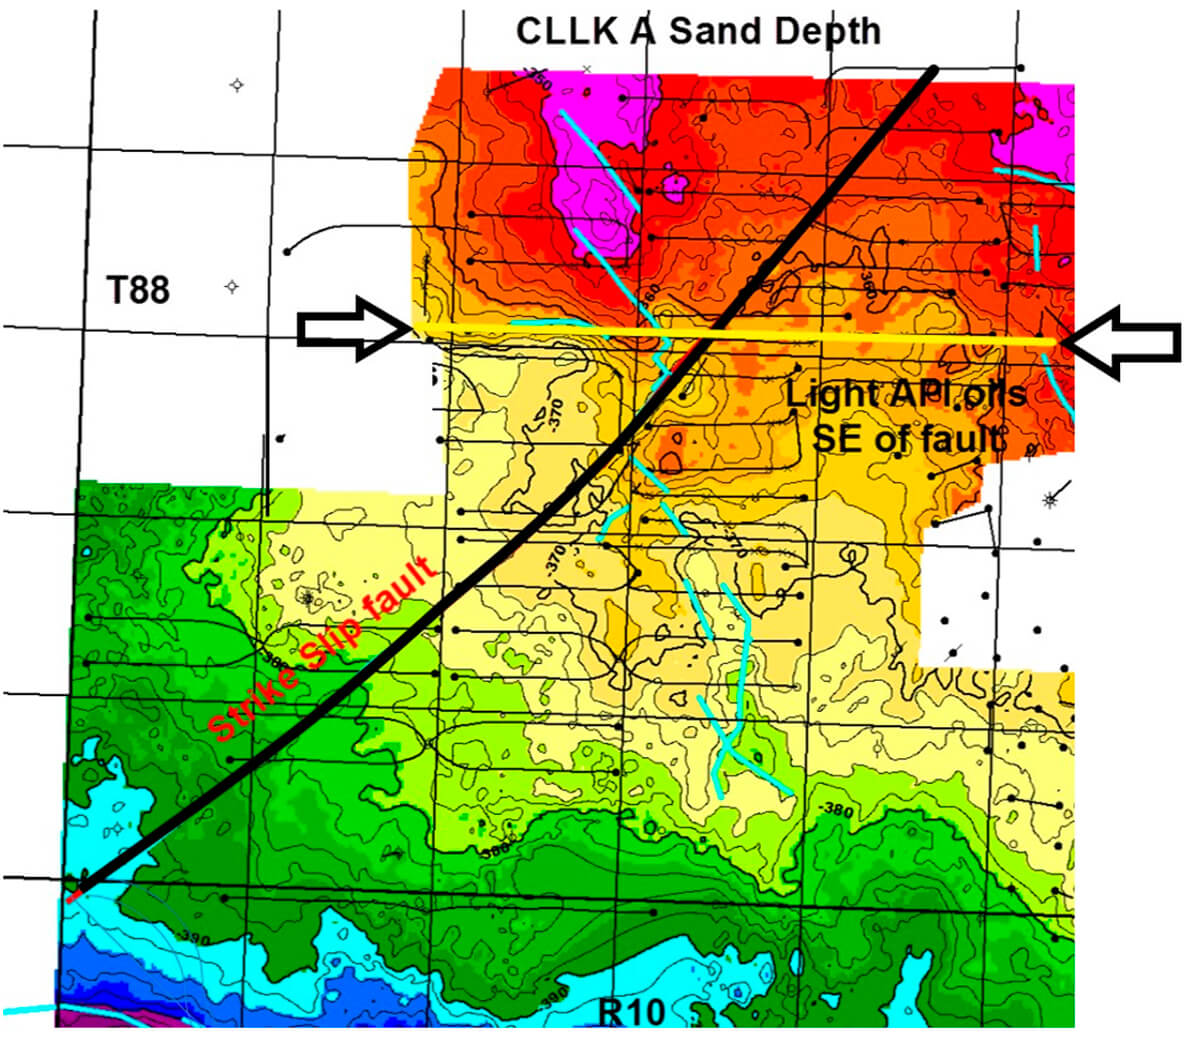
In light blue is the conjugate strike-slip fault system that runs NW-SE; this fault system does have some vertical offset and was recognized early on with the first 3D seismic survey as a strike-slip fault having associated Riedel shears. Small folds associated with the Riedel shears are present and perhaps more easily seen in Figure 6, which is a 3D visualization of the CLLK surface. Figure 7 is a time structure of the Riedel shear fault faces showing the steeply dipping en echelon nature of these faults. By convention, the strike of the Riedel shears would suggest the strike-slip fault is a right lateral strike-slip. This NW-SE-trending strike-slip fault does not appear to be a barrier to oil migration.
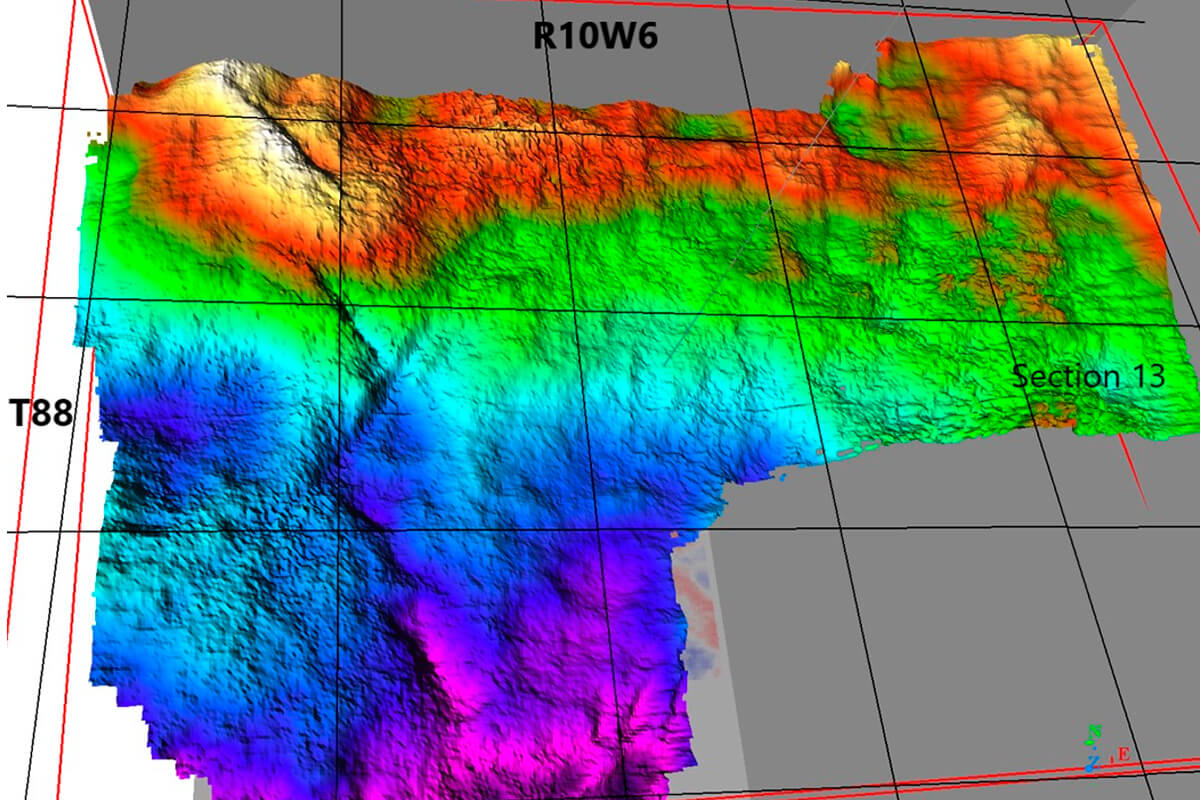
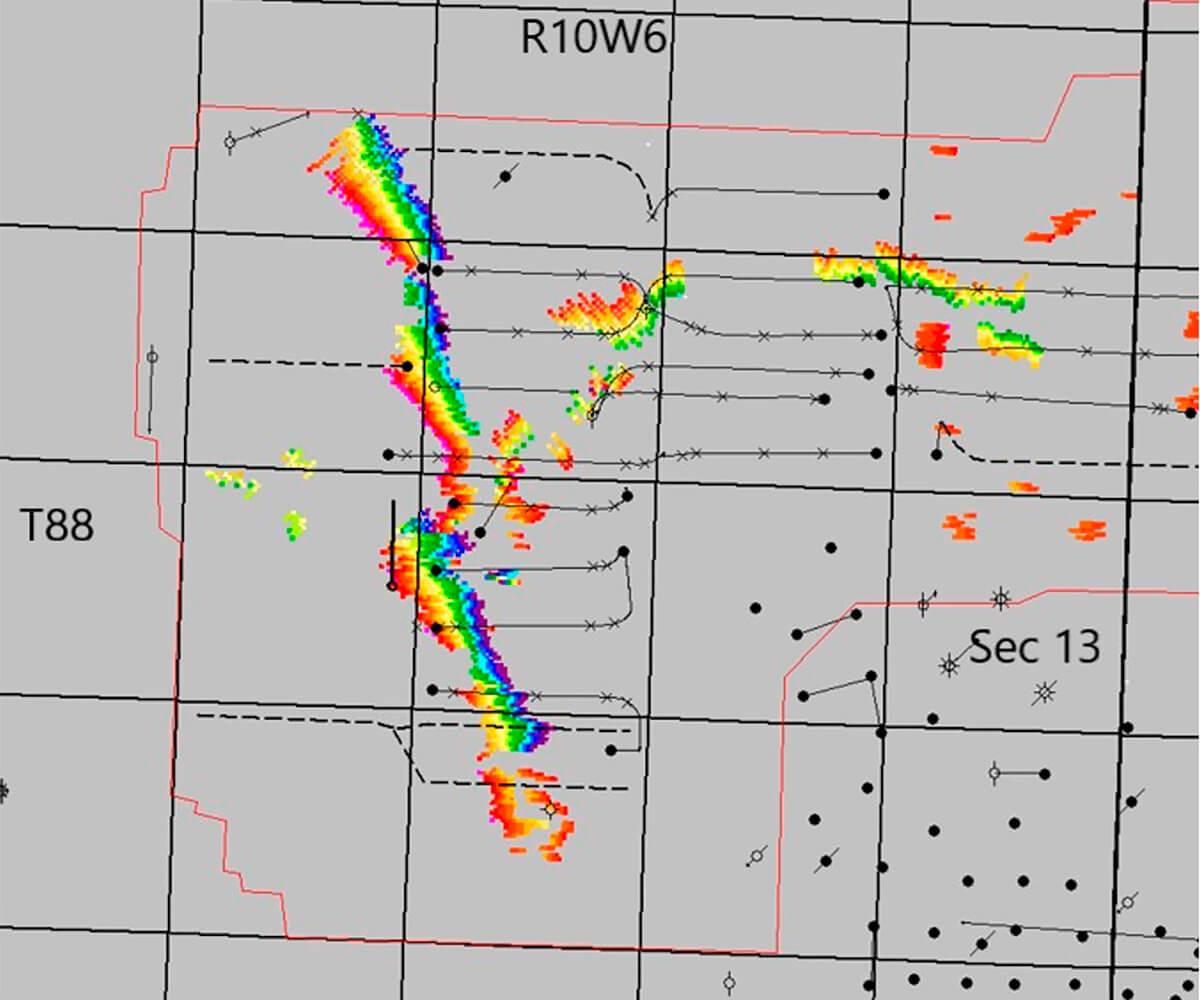
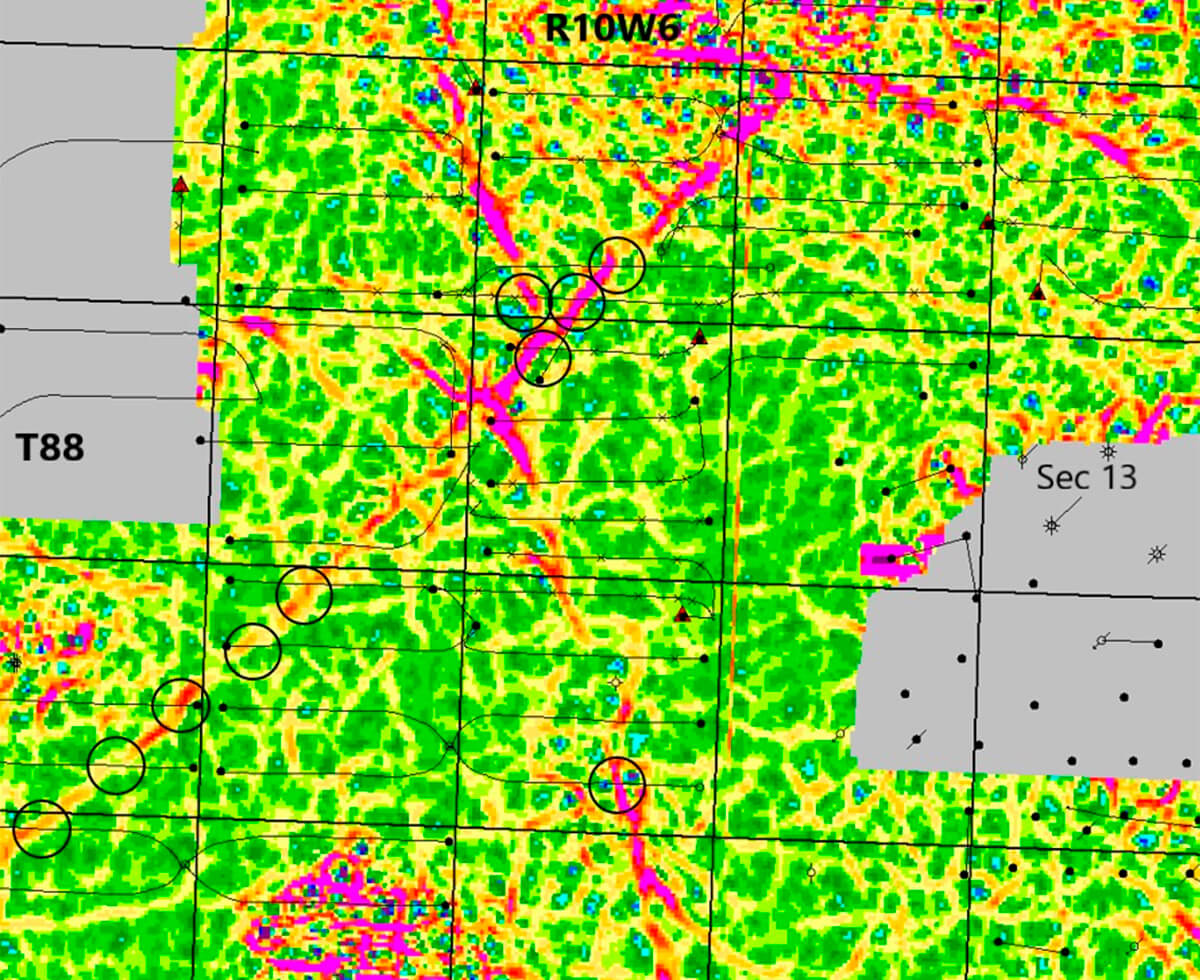
Figure 8 is an E-W line extracted from the 3D seismic following along a path shown by the yellow arrows in Figure 5. The horizontal well 1-21-88-10W6 was drilled from east to west along this line, and the strip log encountered fault gouge at two locations. The first location is at measured depth 2,280 m and is the intersection with the NE-SW strike-slip fault. The second location, at 2,750 m measured depth, is the intersection with the NW-SE strike-slip fault. The fault intersection at 2,750 m measured depth does have some vertical offset on the seismic and was recognized early on as a fault. The fault intersection at 2,280 m measured depth, however, is more subtle on seismic and was only recognized as a fault when map-based curvature attributes were applied.
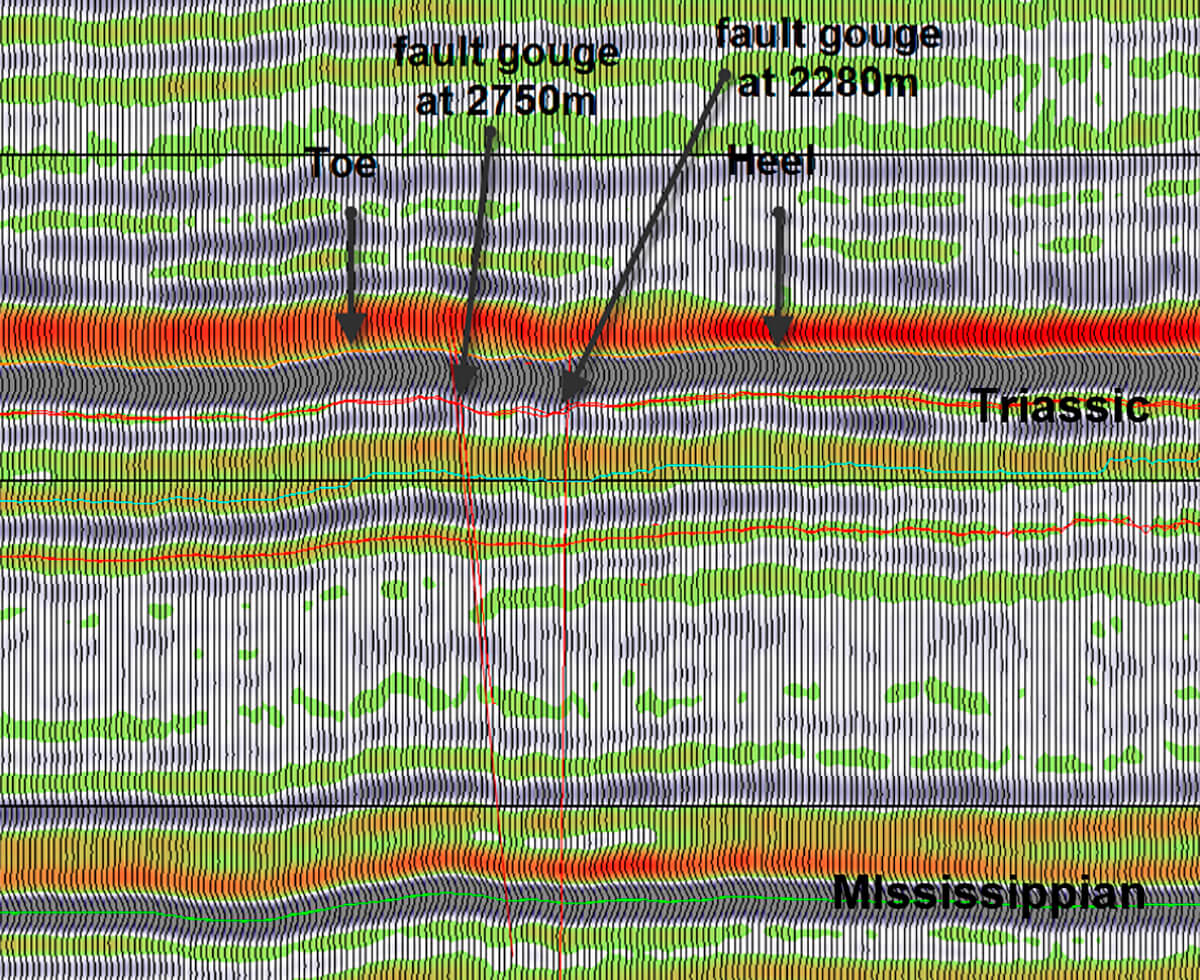
Figure 9 is the negative curvature attribute from the Charlie Lake picked horizon. Other curvature attributes and coherence were also generated with similar, if not quite as obvious, results. The NW-SE strike-slip fault and its Riedel shears are clearly seen on the negative curvature, but what is interesting is the strong NE-SW lineament that has no obvious vertical displacement. This lineament is also present at deeper horizons in the same location, suggesting a near-vertical feature. It appears that the NW-SE strike-slip fault is offset by the later NE-SW lineament by about 500m to the NE. Near-vertical dip, no vertical offset, and right-lateral movement of the earlier fault are all strong indicators that this NE-SW lineament is also a strike-slip fault.
Regional Stress Implications
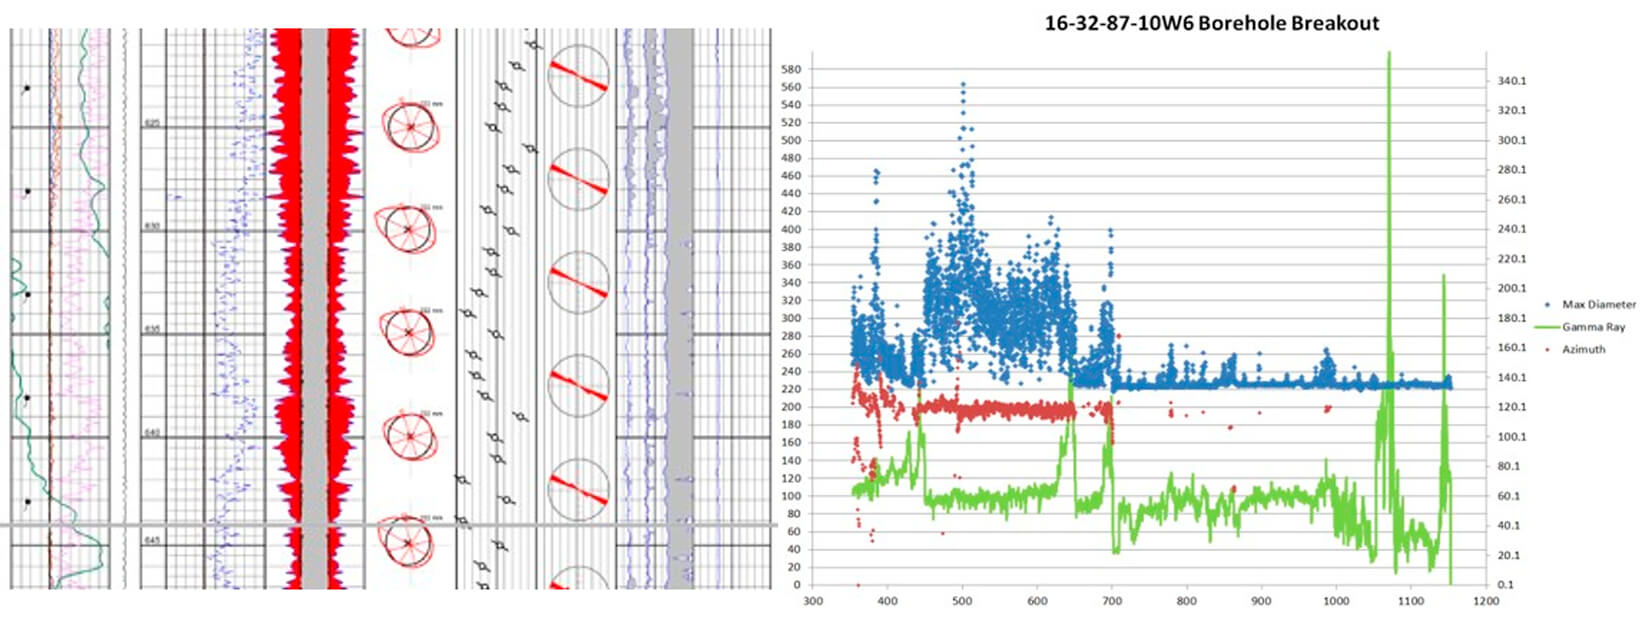
It is interesting at this point to digress somewhat and discuss the regional stresses. The Triassic in NW Alberta is recognized as having strong horizontal stress anisotropy with SHmax typically oriented 30 to 40 degrees east of north and SHmax being greater than the vertical stress, resulting in a strike-slip regime. We do have evidence of local current stress directions from looking at well bore breakout (Gough, D.I. and Bell, J.S., 1981; Zoback, M. et al., 1985) on an oriented caliper log run in the well at 16-32-87-10W6 (see Figure 10). The well bore breakout happens from close to the surface down to about 650 m depth, which is the top of the Peace River Group. Below 650 m, the rock strength is enough to resist failing. The well bore breakout (SHmin) in the younger sediments is oriented 120 degrees east of north implying that SHmax direction is perpendicular or at 30 degrees east of north, which is consistent with most observations of SHmax in NW Alberta.
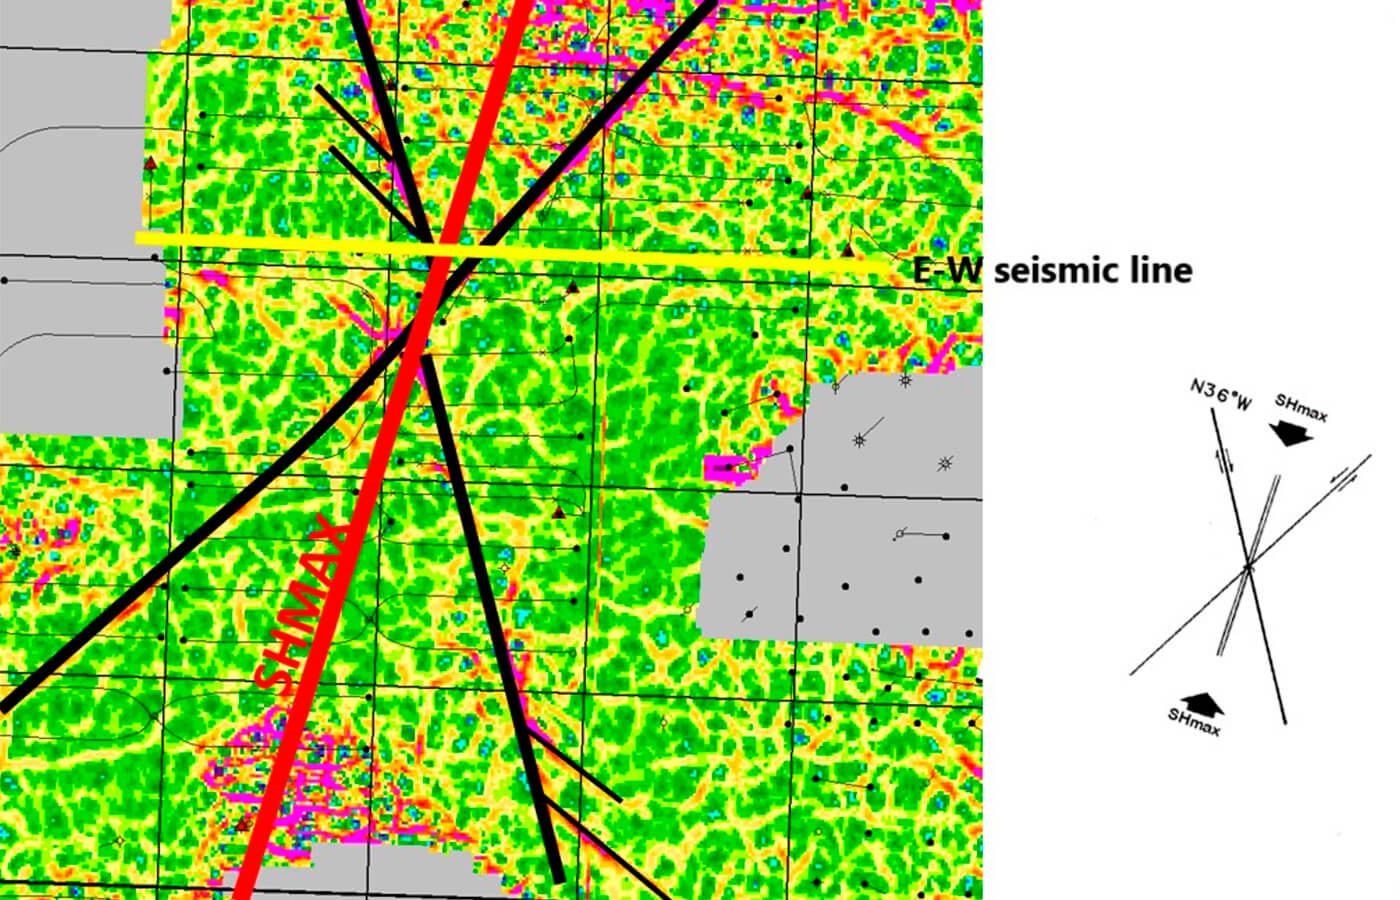
Our two strike-slip faults set up a pair of conjugate faults with the maximum stress direction (Lund Snee, J.E. and Zoback, M.D., 2019) defined as the angle bisecting the two faults as shown in Figure 11. The azimuth of SHmax as defined by the two strike-slip faults is 15 degrees east of north. There is no seismic evidence that these faults are present in the younger Cretaceous sediments, so the age of these faults is likely early Cretaceous/late Jurassic. The stress direction as derived from the conjugate fault system can then be thought of as a paleo-stress direction. Paleoreconstruction of Pangea has shown that since the Triassic/Jurassic time, Pangea has rotated about 15 degrees counter-clockwise (Torsvik et al., 2010), so that the azimuth of SHmax at the time of faulting was consistent with present day maximum stress direction of 30 degrees east of north. Additional support for the NE-SW lineament being a fault is provided by the strip logs of horizontal wells that crossed the fault.
Evidence of Fault Gouge from the Strip Logs
As can be seen in Figure 9, a number of horizontal wells crossed the NE-SW strike-slip fault. Wells towards the north were drilled before the acquisition of the seismic. As the pool was extended to the SW, a decision was made to maintain the well spacing and deliberately drill horizontal wells across the fault, knowing that there was little, if any, vertical throw across the fault. Each well had a gamma ray log, gas detector, and chip sample descriptions provided by a well-site geologist. No image logs were run in the horizontal wells. Figure 9 shows in black circles the position on the horizontal well paths where we saw evidence on the strip logs of anomalous behaviour that we are interpreting as being due to fault gouge. The positions of these fault gouge zones align precisely where the 3D seismic predicted the position of the fault.
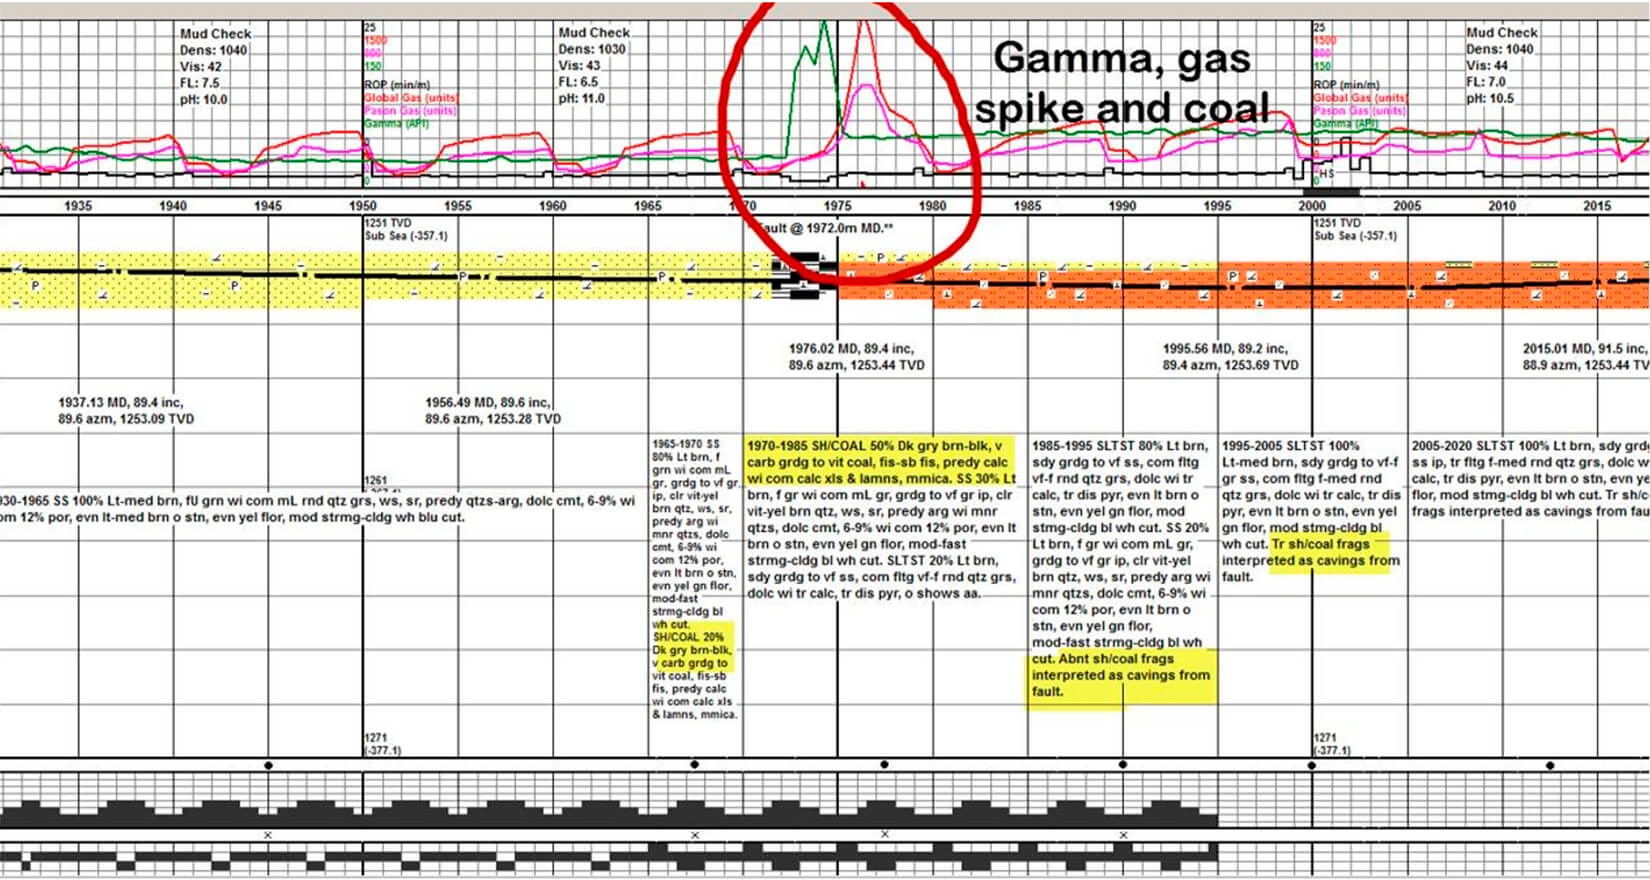
The anomalous indicators observed were one or more of the following: spikes in the gamma ray log, unusual mineralogy such as coal in the chip samples and occasional spikes in the gas detector. These anomalous zones were typically 3-5 metres long, and we are interpreting these zones as being the fault gouge created from the frictional forces present along the strike-slip face. The description of coal in these intervals is puzzling since there is no coal in the Triassic section; however, about 50 metres above the Charlie Lake are coals of the Cretaceous Mannville Formation. One hypothesis is that the Mannville coals worked their way into the weakness created by the fault face. The gamma ray typically jumped 2 to 5 times background in these anomalous zones. These jumps in the gamma response could be due to diagenetic fluids causing clay alterations or emplacement of clay minerals in the fault damage zones. Another explanation for the high gamma is that remnants of crushed Nordegg fell into the fault face, since the Nordegg has a high gamma signature. We have included three examples of strip logs from wells 12-9-88-10W6, 13-9-88-10W6, and 4-23-88-10W6. The examples below are showing only a 40 m to 60 m portion of the strip logs that include the short anomalous zones. The lateral lengths of these wells, however, were in the 1,600 m to 1,800 m range, with only these short sections showing any of the anomalous response.
Figure 12 is the strip log for 12-9-88-10W6, the green curve is the gamma ray, and it jumps from a background of about 60 to 170 units. The well-site geologist is describing coal making up 50% of the samples in this interval!
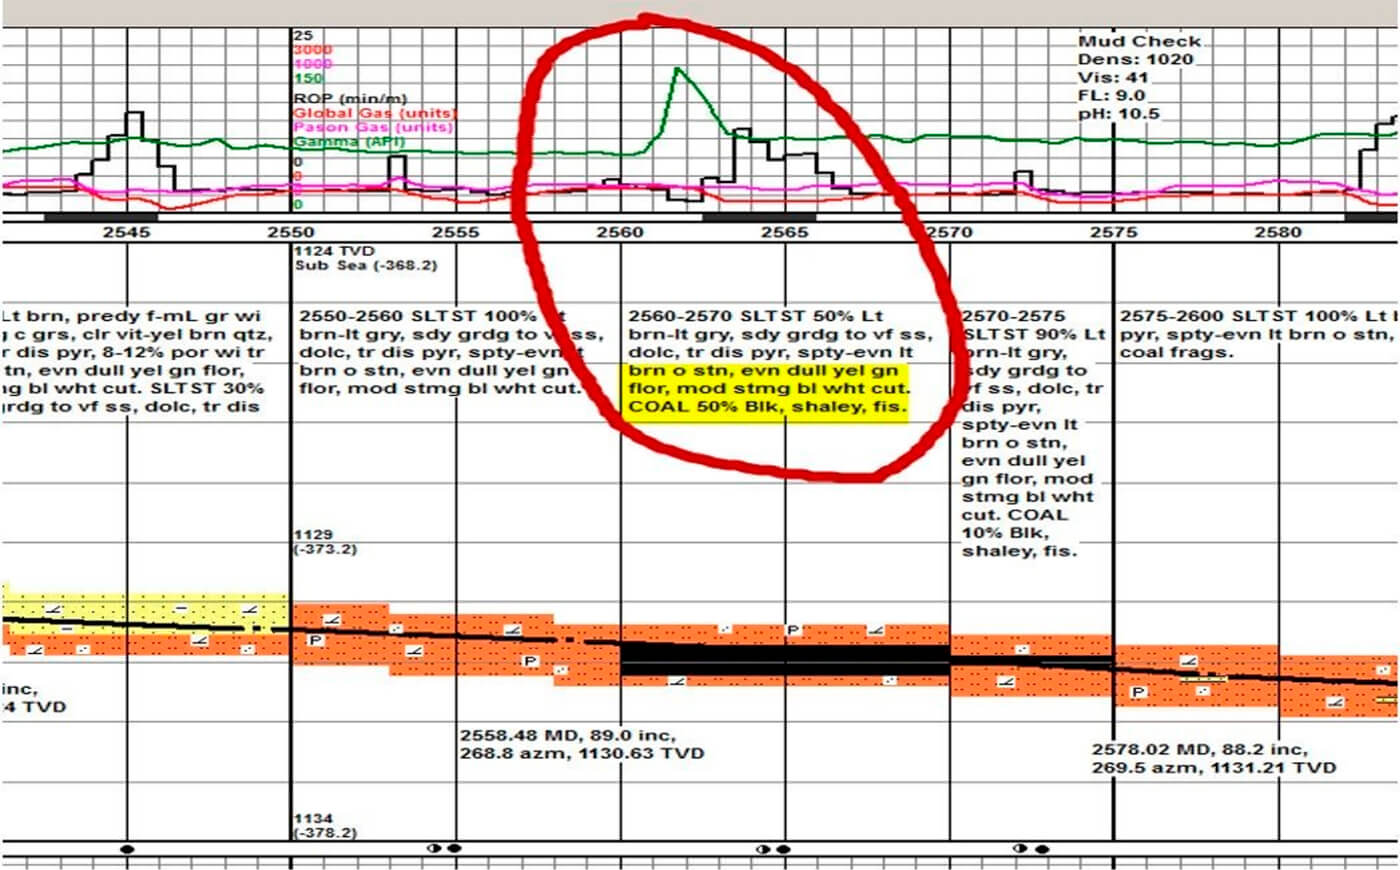
Figure 13 is the strip log for 13-9-88-10W6, again green is the gamma ray log, and it shows a dramatic jump from a background of around 50 units to almost 300 units over a very narrow range of 3 m.
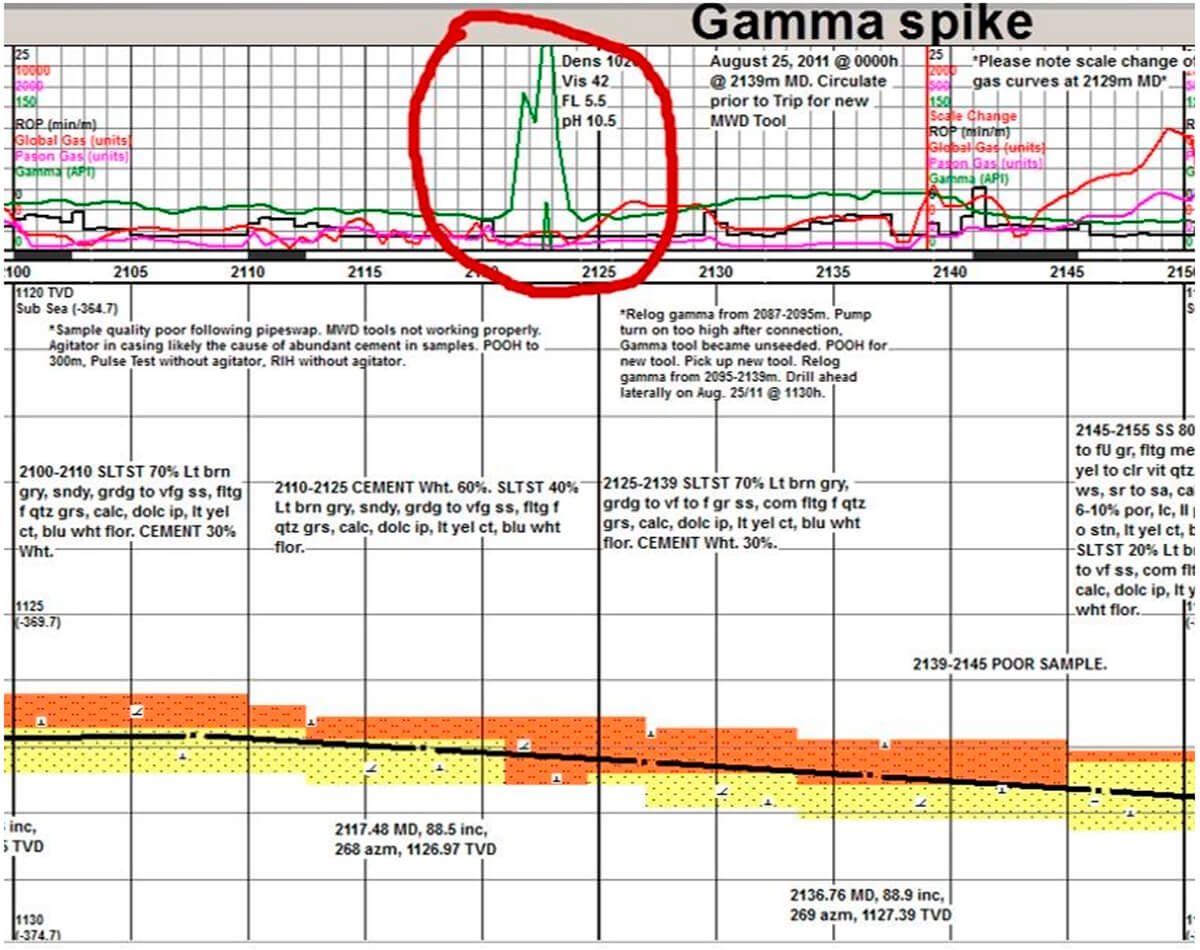
Figure 14 is the strip log for 4-23-88-10W6. At a measured depth of 1,972 m, this well exhibited a spike in the gamma ray log over a distance of 3 m, spikes in both gas detectors, and coal fragments in the chip samples.
Hydrocarbon Fluid Distribution
As more wells came on production and reservoir fluid analyses were received, it became clear that we were dealing with two different fluid systems, a medium grade crude on the north side of the strike-slip fault and a light grade crude on the south side of the strike-slip fault. Not only was the oil API different, but also viscosity, sulphur content, and H2S content of the associated gas. Table 1 lists out the differences.
| Fluid Criteria | North of Fault | South of Fault |
|---|---|---|
| Oil API | 24-28 API | 38-40 API |
| Oil Viscosity | 30-50 cp | 3-5 cp |
| Oil Sulphur content | 2% to 5% | 0.8% to 1.0% |
| H2S in assoc. gas | 0 | 1% |
Wells that straddled the fault, such as 13-9-88-10W6 and 1-21-88-10W6, had a mix of both oil types with APIs in the low- to mid-30s. In addition to 3D seismic evidence for faulting and horizontal strip log evidence for faulting, we also had different reservoir fluids on either side of the fault, which suggests that the fault was an impermeable barrier to oil migration.
We were curious about the origins of these two different oil types. A couple of explanations considered were that they were of the same source, but the medium grade oil was a degraded version of the lighter oil; or the two oils were from different source rocks. To help answer that question, we engaged Gushor Inc. (now owned by Schlumberger), a company specializing in reservoir fluid analysis. Gushor conducted Gas Chromatography-Mass Spectrometry (GC-MS) on representative samples of the two oils. They found that the two oils had significant differences in various compound ratios; for reference some are listed below in Table 2.
| Compound ratios | Medium API oil | High API oil |
|---|---|---|
| Pr/Ph | 0.73 | 1.04 |
| Ts/(Ts+Tm) | 0.22 | 0.56 |
| DBT/P | 2.72 | 1.31 |
| C29H/C30H | 1.13 | 0.60 |
| MDR | 1.62 | 3.54 |
The conclusion from the Gushor report was that the two oils were distinctly different and from different sources. The medium API oils were from an immature, carbonate-rich source that matched well with the Gordondale (Nordegg) template oil. The lighter API oils were from a more thermally mature clastic source. Our interpretation, then, is that the medium grade oils found on the north side of the fault are from a local Nordegg source, which directly overlies the Charlie Lake Formation, while the light grade oils found on the south side of the fault are likely sourced from the Doig Phosphate, but have migrated in from the deeper part of the basin (Riediger, C.L., 1990).
Model for Hydrocarbon Emplacement
So how do we get two different oils on either side of a strike-slip fault when the azimuth of the strike-slip fault is the same as current dip? What we know is that the dip of the basin has not always stayed the same. One way to look at earlier basin configurations is to look at isopachs or isochrons. A depth map or time structure map gives the current present-day dip, but an isopach or isochron represents the basin configuration at the time of the younger formation. For example, Figure 15 is a Notikewin-to-Charlie Lake isochron map. This map represents the structure of the Charlie Lake at the time of Notikewin deposition. The Notikewin Formation is of Albian age, or about 100 million years old. In terms of geological time, the interval between the Notikewin and Charlie Lake represents about 120 million years. The Albian age is commonly thought of as the time of hydrocarbon generation for Triassic source rocks in NW Alberta. What the Notikewin-to-Charlie Lake isochron in Figure 15 shows is that the dip of the Charlie Lake at Notikewin time was not down to the SW but down to the SE!
The hypothesis for hydrocarbon emplacement is that Doig Phosphate oils were generated downdip during the Albian (Notikewin) time and migrated updip into the Charlie Lake until encountering the NE-SW strike-slip fault and then were trapped by the impermeable nature of the fault gouge along the strike-slip fault face. These are the mature high API oils that are found on the SE side of the fault. At a later unknown time, less mature medium API Nordegg oils were locally generated and migrated into the Charlie Lake on the NW side of the strike-slip fault. The result is the distribution of the two oils on either side of the NE-SW strike-slip fault as first shown in Figure 1.
Conclusions
The Triassic of NW Alberta is recognized as being in an anisotropic stress regime where the max stress is one of the horizontal stresses and the intermediate stress is the vertical stress resulting in a strike-slip faulting regime. This article presents strong evidence from 3D seismic, horizontal well gamma ray logs, horizontal well gas detectors, and horizontal well drill chip samples for a strike-slip fault system that was instrumental in trapping two different oils. Having the corroboration of independent evidence makes a compelling case for the presence of this strike-slip fault.

Acknowledgements
This case study was based on work done while at Birchcliff Energy Ltd. The integration of various data sets could not have happened without the dedication of other team members. Specifically, I would like to thank geologists Brenda Pearson and Dave Christensen, engineer and team lead Perry Billard, production engineer Dwayne Spelay and field foreman Darrin McLarty. I would like to thank Birchcliff Energy Ltd., as owners of the proprietary 3D seismic, for giving their permission to show the seismic images. Both Birchcliff Energy Ltd. and Enercapita Energy Ltd. (the current owners of the Worsley CLLK LL pool) have authorized the publication of this article.


Join the Conversation
Interested in starting, or contributing to a conversation about an article or issue of the RECORDER? Join our CSEG LinkedIn Group.
Share This Article