Abstract
Hunting for Ni-Cu-PGE ore bodies is no easy task, especially in the harsh conditions at the Nunavik Nickel Project in Nunavik, northern Quebec. As the near-surface deposits are found, better tools and sound geological understanding are needed to find deeper deposits. As part of Canadian Royalties’ exploration routine, multiple physical rock properties are measured and analysed to augment magnetic, electromagnetic and reflection seismic survey results and improve discrimination between volcano-sedimentary host rocks, Ni-Cu-PGE bearing mafic / ultramafic intrusions and mineralised lenses. Globally, the geophysical signatures of these three vary significantly throughout the property and survey configuration and parameters have been optimized accordingly. High-resolution magnetics allows detection of mineralised peridotite intrusions, while non-magnetic ones, pyroxenitic and/or gabbroic, can be mapped as local breaks through the volcano-sedimentary large-scale magnetic folded pattern. At depth, an intrusion’s footwall can be inferred from unconstrained 3D magnetic susceptibility inversion iso-contours. Ground and downhole electromagnetics (EM) are key surveys for direct detection of semi-massive to massive Ni-Cu-PGE lenses. Delineation between ore-lenses and graphitic- and/or pyrrhotite-rich sediments is challenging but can be achieved by optimizing the moving loop’s size and the borehole EM loop’s location, and combining this with B-Field measurements at low repetition rates. Conductivity models calculated for each area of interest, combined with known geology and magnetic inversion, provide an efficient geoscientific 3D model for pinpointing potential embayment, structural traps and ultimately, Ni-Cu-PGE lenses. Recently, reflection seismic was added to Canadian Royalties’ exploration program to support and speed up the mapping process at both the deposits and district scale. Seismic sections provide complementary information from the first 100 meters to greater depths, and are extremely useful to better understand the global geological setting. The Nunavik Nickel case study is a good example of how the integration of geology and geophysics can lead to exploration success.
Geological Setting
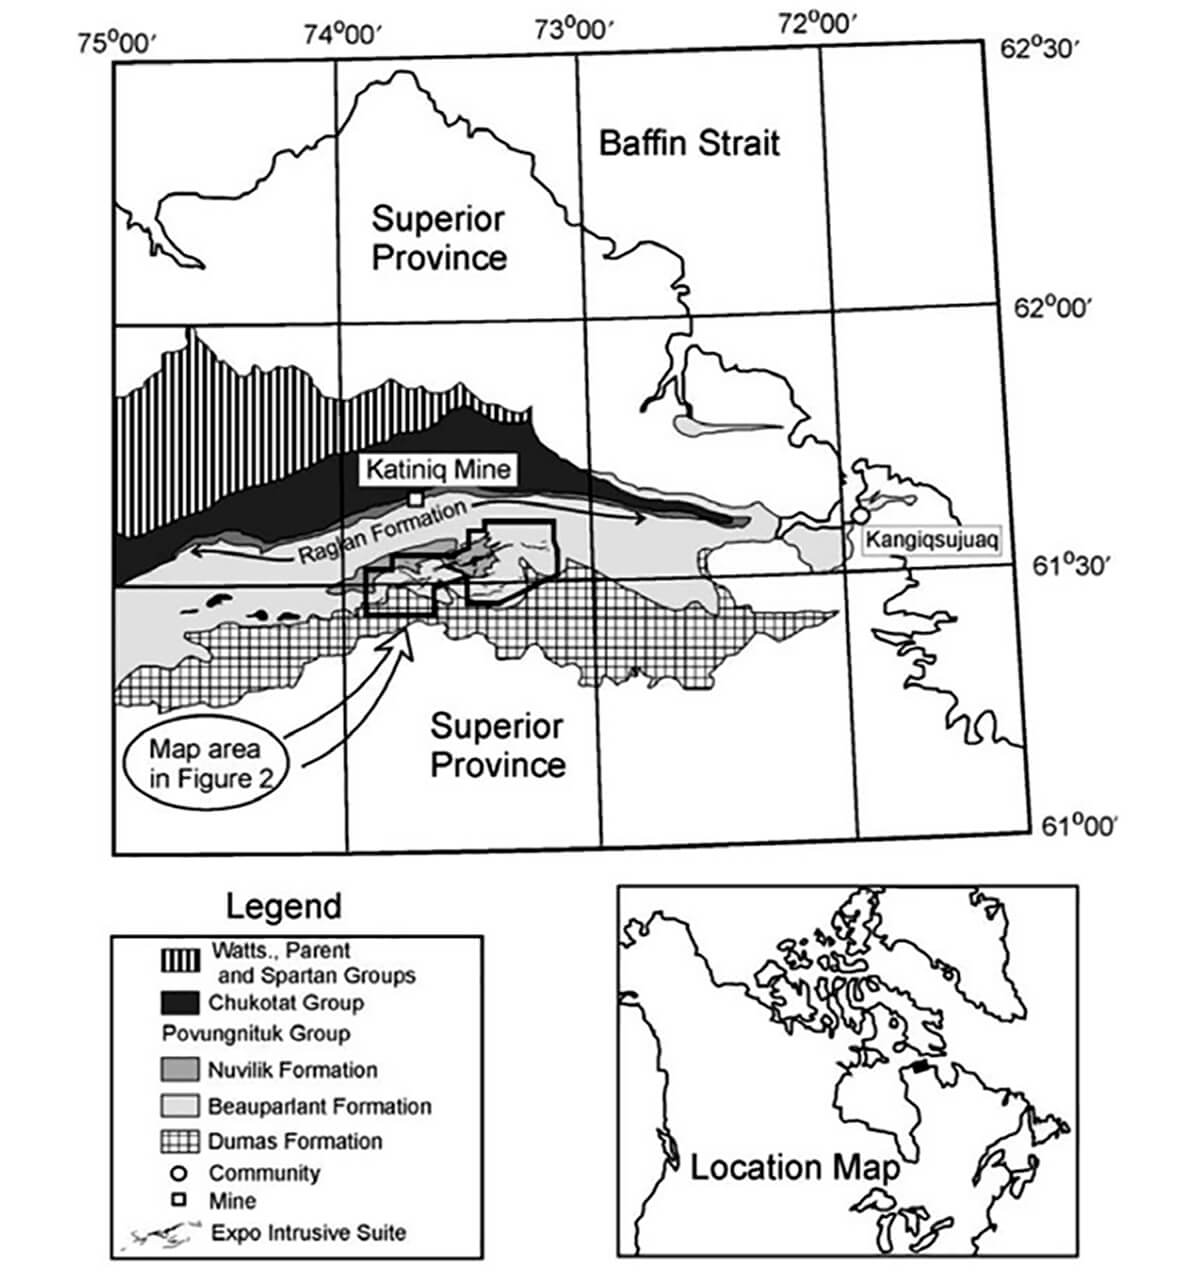
The Canadian Royalties Nunavik Nickel Property (NNP) sits in the Cape Smith Belt of northern Quebec, well known for its numerous Ni-Cu-PGE deposits and mines (e.g. Glencore’s Katiniq mine and Orford Mining’s Frontier zone) (Figure 1). This property covers a large group of mineral rights of approximately 870 km2 and is located 80 km west from the village of Kangiqsuajuaq (previously known as Wakeham Bay) and 140 km south of Salluit, in Nunavik, QC. The center of the property is at latitude 61°32’N and longitude 73°28’W, well within the permafrost southern boundary, in polar tundra. Active operations at Nunavik Nickel include two open pits (Expo and Mequillon) and one underground mine (Allammaq).
Magmatic Ni-Cu-PGE deposits originate from the segregation and concentration of immiscible droplets of liquid sulfide from mafic or ultramafic magma. Sulfide saturation requires additional sulphur to interact with the magma and enrich the sulphide liquid. Ultimately, precipitation in restricted areas is key to locally accumulating a significant concentration and volume to generate an ore body (Naldrett, 1999).
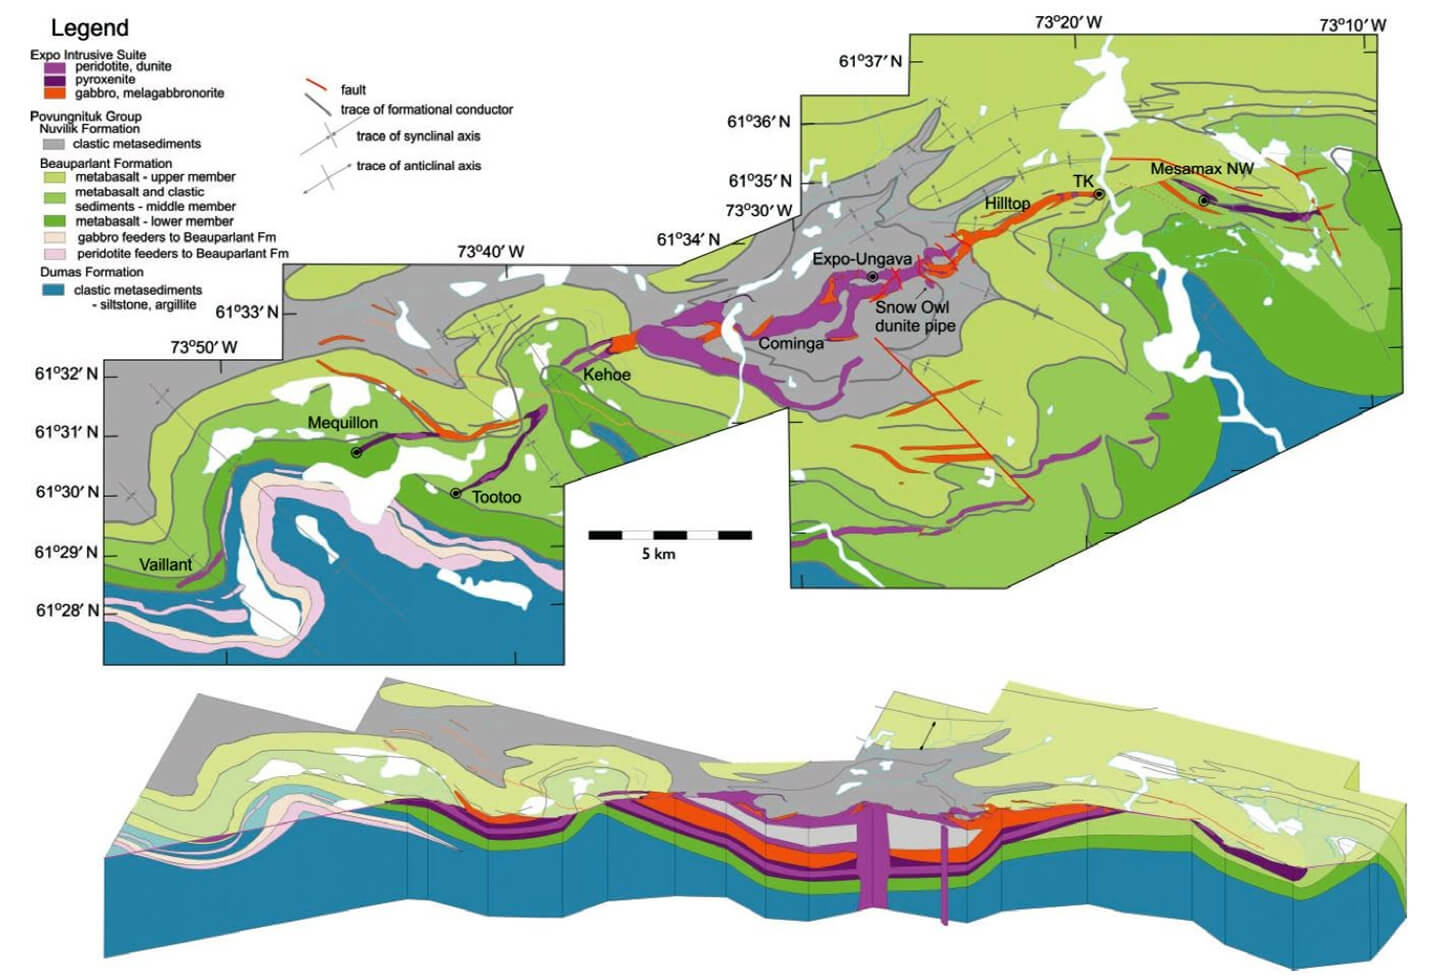
Ore bodies over the Nunavik Nickel property are associated with mafic and ultramafic blade-shaped dyke intrusions related to the Expo Intrusive Suite. These magmatic flows cross-cut a vast formation of sediments and volcanics, known as the Povungnituk Group, where they assimilated extra sulfur and had them precipitate as Ni-Cu-PGE rich lenses at their base. Locally, the Povungnituk Group consists of three recognized formations, in ascending order: the Dumas, the Beauparlant and the Nuvilik Formations, composed of basalt, greywacke and graphitic argillite, all lying unconformably on the Achaean basement (Mungall, 2007). Outcrops and magnetic data suggest that the multi-flow intrusive event was very turbulent (Figure 2).
Physical Rock Properties
Having a good understanding of the physical properties of an exploration target, its host rock, and the surrounding geological units, is key to interpreting and optimizing geophysical surveys. An excellent review of Ni-Cu-PGE physical rock properties is presented by King (2007). In addition, governmental geological associations worldwide, such as the Geological Survey of Canada (GSC), have recently published well-documented databases accessible on the Web (https://geoscan.nrcan.gc.ca/starweb/geoscan/servlet.starweb?path=geoscan/downloade.web&search1=R=313389).
Magnetic susceptibility
Magmatic Ni-Cu ore bodies at Nunavik Nickel, like most similar deposits, are mainly composed of pyrrhotite (Fe1-xS) and varying amounts of chalcopyrite (CuFeS2) and pentlandite ((Fe,Ni)9S8). From a geophysical point of view, these minerals are indistinguishable, and their global signatures will mostly depend on their texture (i.e. disseminated, net-textured, semi-massive, in veins or massive). It is important to mention that pyrrhotite, in its dominant form at Nunavik Nickel, is magnetic. Consequently, Ni-Cu lenses of significant size may generate a direct signature on airborne, ground or borehole magnetic surveys. However, the most distinct magnetic signatures when exploring for magmatic Ni-Cu deposits will be the ultramafic intrusives. The more metamorphosed these ultramafic units become, the richer in serpentine and magnetite they are. The ultramafics in this study show signs of green-schist metamorphism at most (Liu et al, 2016).
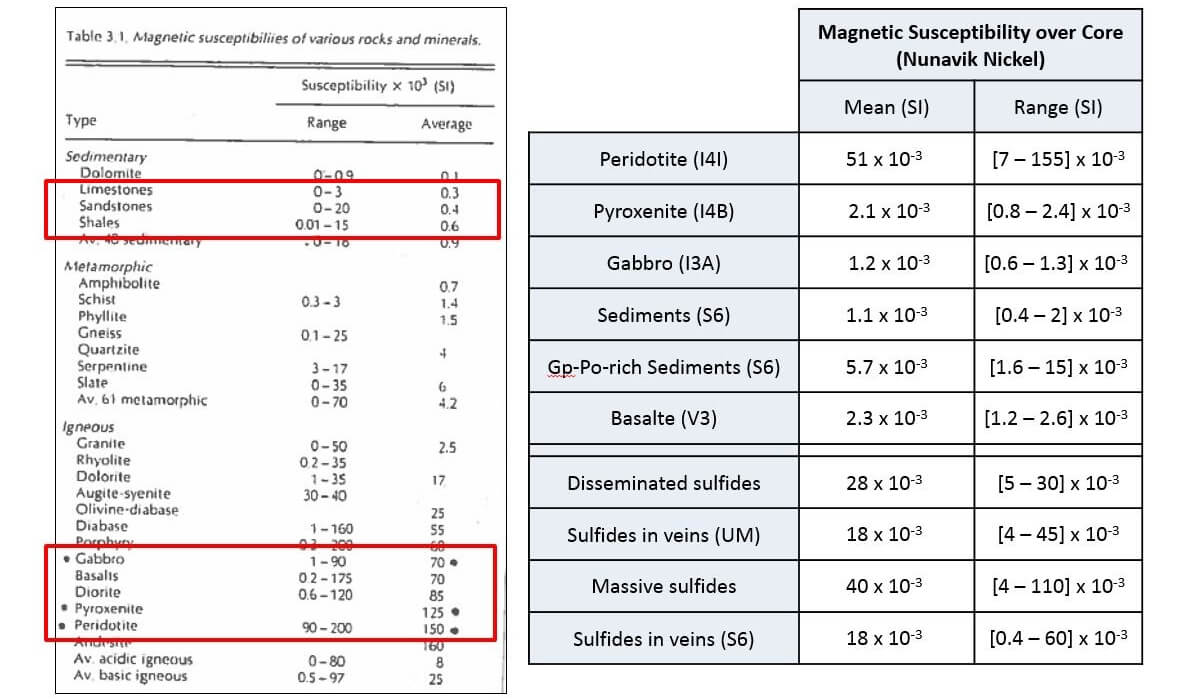
Magnetic maps are widely used to assist geological mapping at different scales, i.e. from the deposit scale to the regional one. Magnetic susceptibility measurements of each lithology and mineralised zone are key to the understanding of the detected signatures and enhancement of the geological interpretation. Typical values for various rock types and minerals can be easily found in the literature. Nevertheless, measuring physical rock properties throughout an exploration property is definitely the best way to acquire more accurate information. This is especially crucial, as metamorphism greatly affects physical rock properties. Table 1 presents results from the Canadian Royalties’ property, compared against historical published values. The peridotite unit is by far the most magnetically susceptible lithology, followed by the sediments rich in pyrrhotite veins. Pyroxenite and gabbro susceptibilities are less than what is reported in Telford’s chart. The averages presented below include measurements from all samples collected throughout the property. Ultimately, it is more representative to compute statistics at the deposit scale, no matter which physical property is being studied.
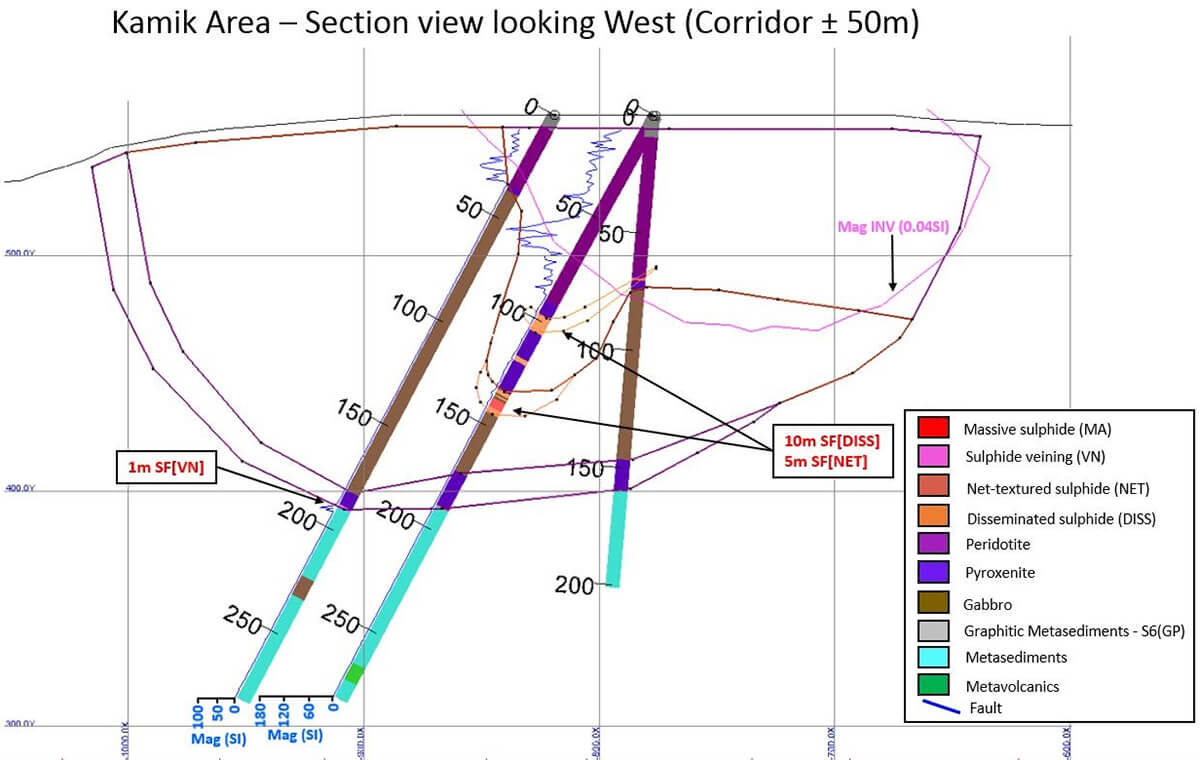
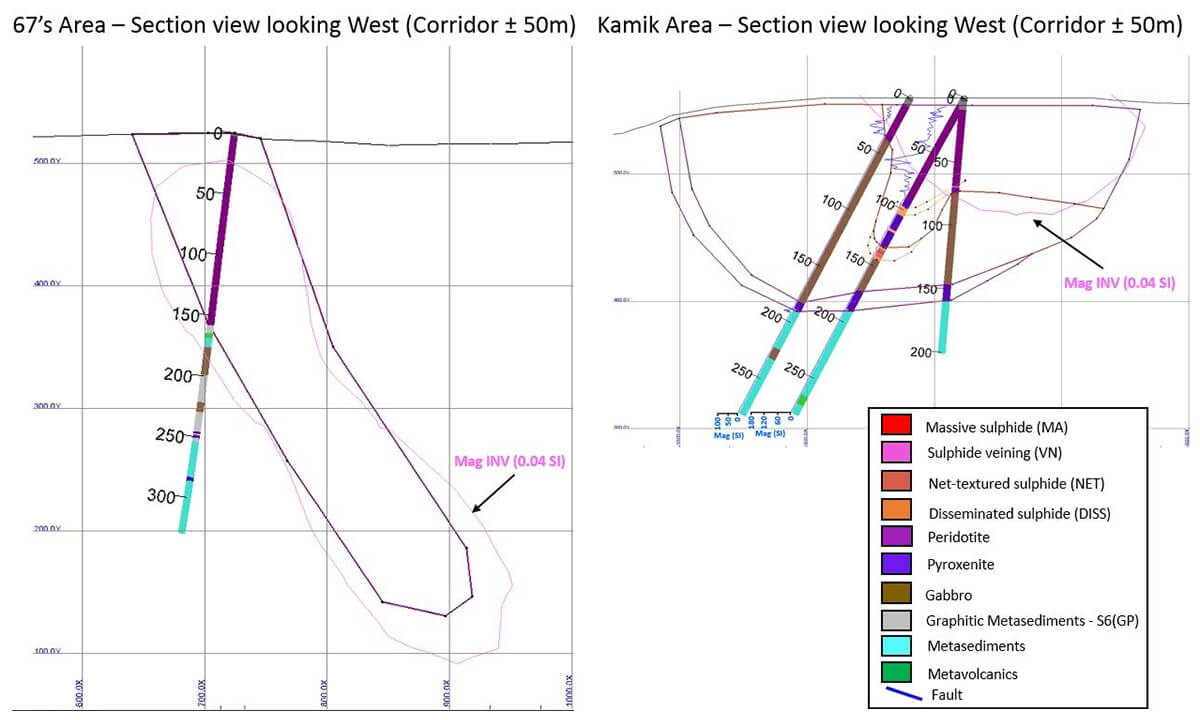
At Nunavik Nickel, magnetic susceptibilities and all other physical rock properties are collected from drilled core during geological logging, using a commercial handheld instrument. In-situ measurements would yield more accurate results, but the permafrost environment limits downhole operations to a very short period. Figure 3 shows a geological section from a drilling section in the Kamik area, with its corresponding magnetic susceptibility profile.
EM conductivity
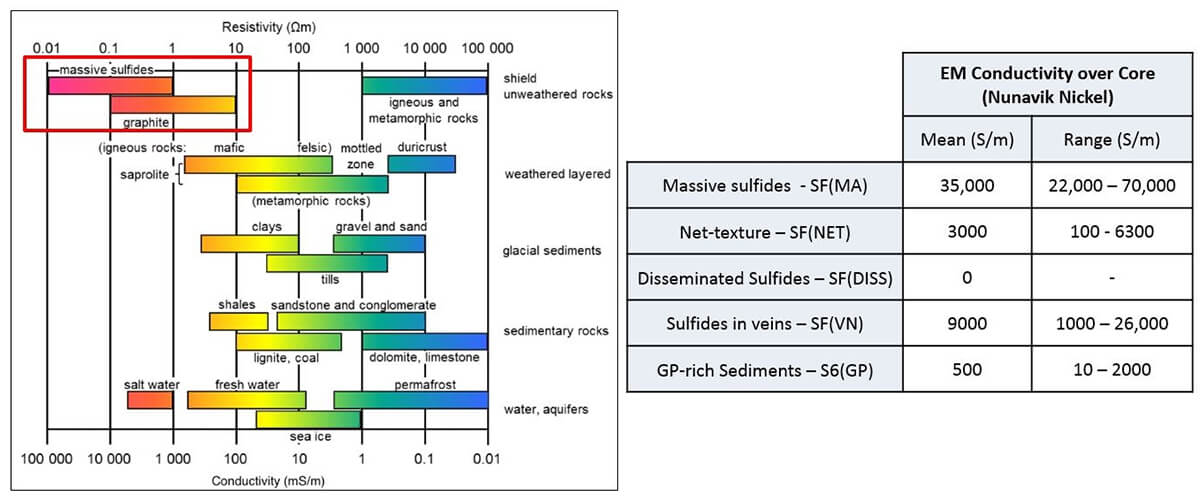
Another valuable physical rock property being measured as part of the standard logging routine is the electrical conductivity, or capability of a given rock or mineral to conduct electrical currents. Ni-Cu-PGE deposits, like most base-metal ore bodies, are very good conductors, mostly due to their high content of pyrrhotite (Osmond et al., 2002). Pentlandite and chalcopyrite are also very conductive minerals, but their quantity is generally lesser and their contribution to the assemblage’s EM conductivity may be limited. Ultimately, the intensity of the EM conductivity is related to the sulfide textures and connectivity throughout the mineralized zone. Table 2 presents a comparison between theoretical values and results from the Nunavik Nickel project. As expected, massive sulfides and veining represent the most conductive textures. Net-textured and graphitic sediments are characterized by a weaker EM conductivity. Note that veining texture includes pyrrhotite-rich sediments, as well.
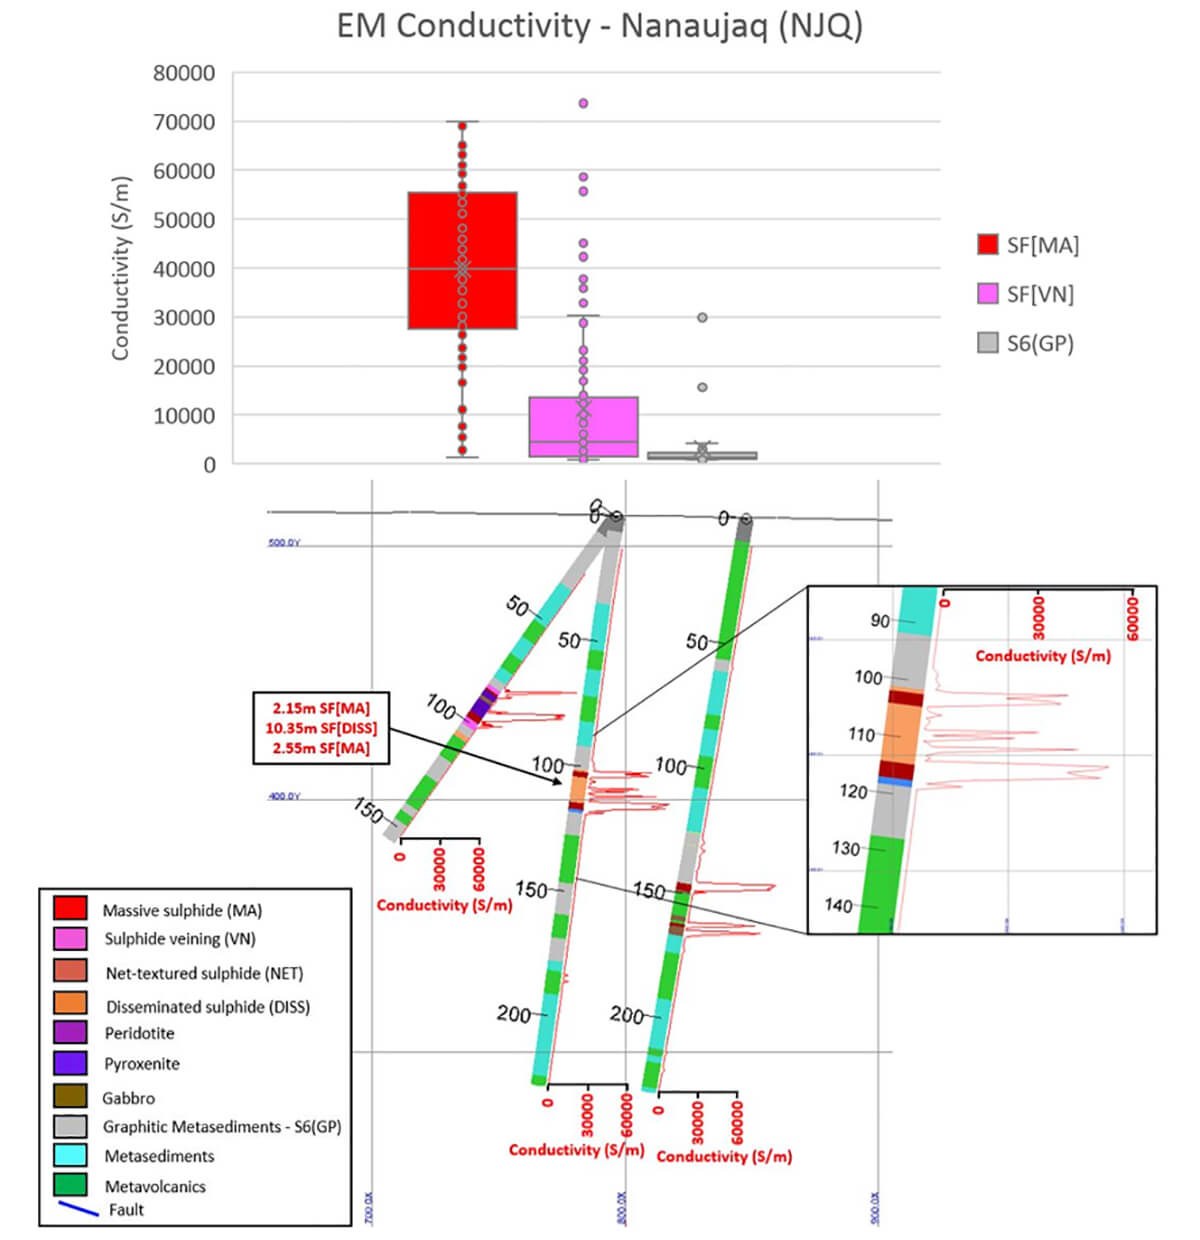
At Nunavik Nickel, magmatic Ni-Cu-PGE bearing mafic and ultramafic intrusions are cross-cutting a vast volcano-sedimentary basin, characterised by regional scale graphitic-rich horizons and un-economic iron formation horizons. Those sediments or formational conductors often include pyrrhotite-rich veining networks extending hundreds of meters. Given their size and conductance, the EM signatures of the pyrrhotite-rich sediments are significant and will mask ore bodies whose dimensions are much smaller. Discrimination between conductors of interest (ore bodies) and false positives (pyrrhotite-rich sediments) is challenging. Being able to scale the conductivity of each of them will provide a certain support to interpreting their source, especially from borehole EM surveys. Figure 4 presents a rare example of a mineralized intersection where sediments, veining and massive sulfides have distinct electrical conductivities.
Acoustic Impedance
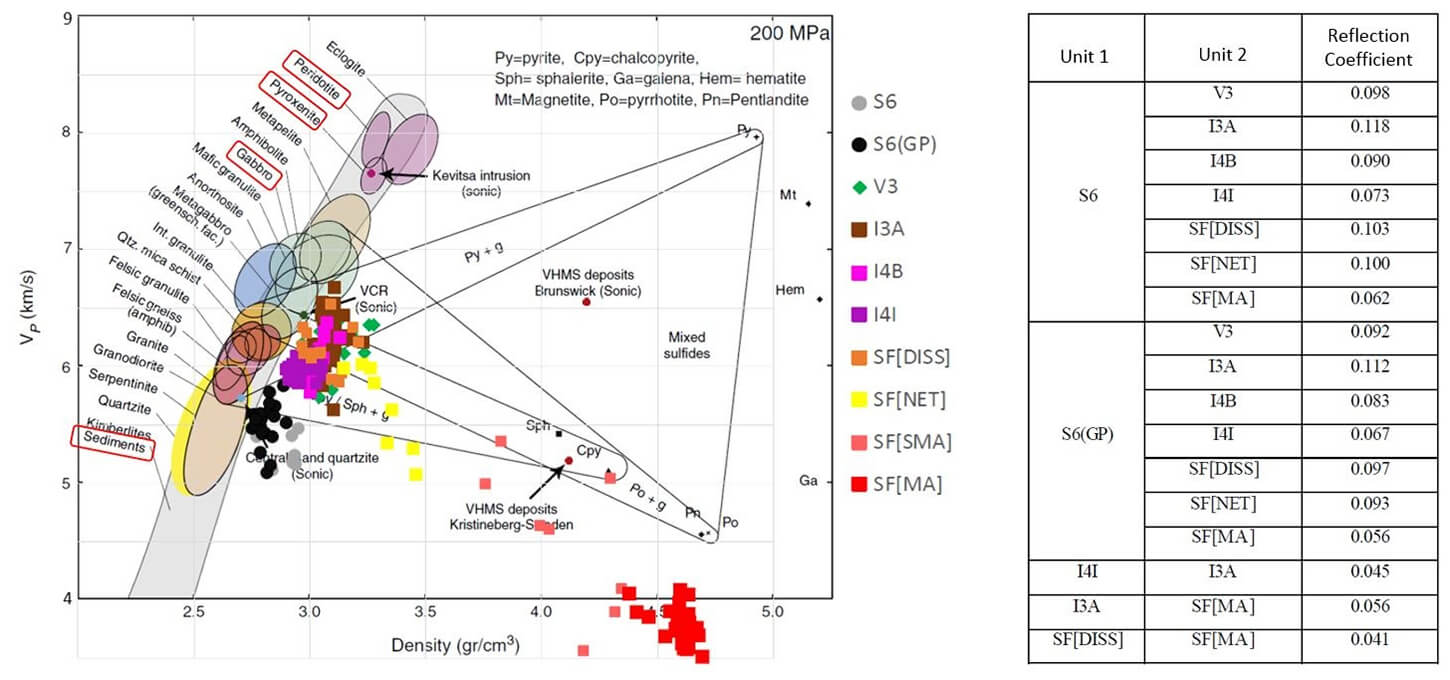
The last physical rock property discussed in this paper is acoustic impedance, the product of P-wave velocity and density. Yet again, these measurements have been carried out on core samples. In this case, samples were shipped to the Earth Science Department of Laval University for thorough measurements. The main interest for measuring the acoustic impedance of representative rock samples is to determine, through reflection coefficients, if given geological contacts are likely to generate seismic reflectors. Therefore, these rock property measurements are mainly useful to design and interpret reflection seismic sections. Salisbury et al. (1996) and Duff et al. (2012) suggest that reflection coefficients should be greater than 0.06 to produce detectable reflectors. For future discussion, resulting reflection coefficients above 0.04 at Nunavik Nickel are listed in Table 3. Results from P-wave velocity and density measurements show that the rocks classified as peridotite and pyroxenite have been greatly affected by metamorphism. Those lithologies show quite lower P-wave velocity values than expected. This is due to the high content of serpentine in the rock samples. As seen on the Nafe-Drake curve, serpentinite is quite low on the broad spectrum of published values. This proves to be challenging, as those lower P-wave velocity values result in lower acoustic impedance, and thus lower reflection coefficients with host rocks and mineralisation. It is believed that in-situ measurements would yield higher P-wave velocity and density values than those measured from core, since micro-fractures would be closed or non-existent. However, as the reflection coefficient is a ratio between two acoustic impedances, the resulting coefficient would not be much different than values from in-situ measurements (Salisbury et al., 1996). The P-wave velocities estimated from prestack time migrated gathers can also be used to guide the seismic interpretation. These dip-independent interval velocities can be compared against the known velocities of the geological formations and therefore suggest the origin of certain reflections. In addition, near surface velocities derived from the refraction model can help constrain the location and extent of the geological units.
Magnetics
Recently, 50 m line spacing heliborne magnetic surveys with a ground clearance of 30 m have been carried out throughout the property. Given the highly deformed nature of the ore-bearing ultramafic intrusives at Nunavik Nickel, this resolution offers a suitable level of detail to map the favorable horizons. Each change in direction, lineament offsets and/or discordant subtle magnetic anomalies brings valuable possible indicators towards the discovery of a new ore body. Furthermore, magnetics will reveal the regional scale structures of the Povungnituk Formation, in which lie the ore-bearing Expo Suite Intrusive. Indeed, thin and long magnetic lineaments of moderate intensity, originating from the pyrrhotite-rich sediments, are visible throughout the property. Figure 5 presents a portion of the Nunavik Nickel property where two magnetic domains can be discriminated.
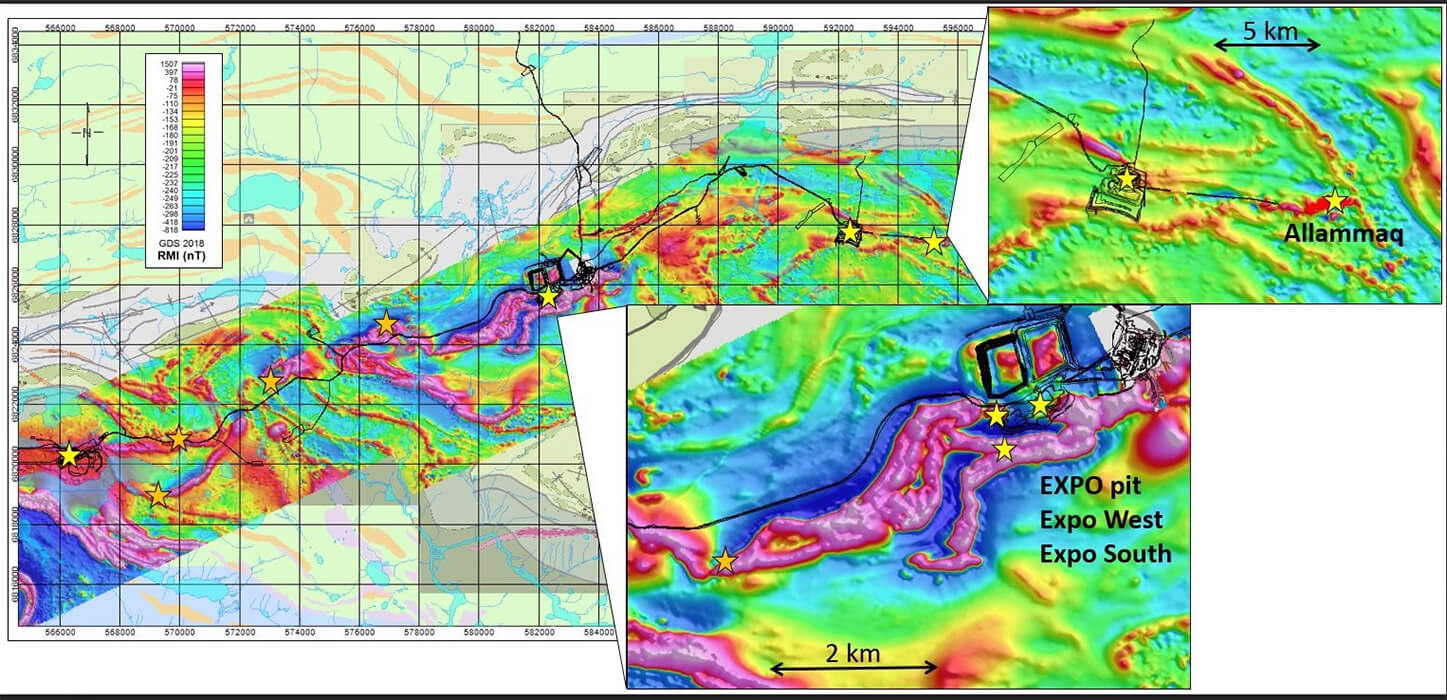
At Nunavik Nickel, near the Expo open pit and for most of the Western portion of the property, the ore-bearing ultramafic intrusives are associated with very strong magnetic signatures, reaching 3,000 nT. It is interesting to point out that, as a result of mining, the two tailings north of the pit are now significantly magnetic. On the other end, over the eastern portion of the property, the sedimentary basin becomes the main source of magnetic responses and the Expo Suite intrusive, hosting in this area the Mesamax and the Allammaq mines, are invisible. This is not the result of erosion. The key horizon still outcrops there, but geological mapping and drilling confirm that its composition is less ferromagnesian (i.e. pyroxenitic and/or gabbroic). As a result, exploration over this huge area cannot be supported by direct magnetic-highs mapping. The strategy there is to look for the breaks in the large-scale sedimentary magnetic folds, as these discontinuities can represent non-magnetic cross-cutting intrusions.
An unconstrained magnetic inversion of the high-resolution magnetic survey has been performed in order to map the ultramafic intrusive footwalls, where lie the massive sulfide lenses (Watts, 1997 & Osmond et al., 2002). From the magnetic susceptibility measurement database of a given area, a suitable magnetic iso-contour is selected, using geology to guide the intrusion’s lower contacts. This methodology has been successful at Nunavik Nickel so far, especially over the western portion of the property, where the intrusions are obviously strongly magnetic (Figure 6). Ultimately, geologically-constrained magnetic inversions of certain areas will be performed in order to enhance magnetic models, especially where dealing with buried ultramafic horizons, stacked intrusives and/or complex geological settings.
Electromagnetics
Electromagnetic surveys are very efficient for direct detection of metallic lenses. As opposed to Volcanogenic Massive Sulfide (VMS) deposits, Ni-Cu-PGE lenses are generally limited in size and will average roughly 100 m x 200 m x 20 m (Naldrett, 1999). Their small size and proximity to regional-scale conductive sediments makes a moving-loop ground EM configuration the best survey choice. The absence of trees in Nunavik makes this type of EM survey easier to carry out, especially in the winter season. This configuration increases the odds of collecting station readings for which sediments are null-coupled, while sulfide lenses are well coupled with the loop’s primary field. In the past, loop configurations have been intensively tested over known deposits of varying depths-to-top. The impact on sulfide lens detectability was validated using many different sizes of single-turn and multi-turn loops, using varying currents.
In addition, to fully capture the secondary EM field of the ore deposits, which are often submerged with background conductors, it is key to survey at very low repetition rates, such as 0.25 Hz, using a B-Field sensor (West et al., 1991). For this reason, ground EM surveys will play a significant role in detecting Ni-Cu-PGE lenses that are likely to be missed by airborne systems. Superconductive QUantum Interference Devices (SQUID) are excellent low-noise sensors, especially those capable of measuring simultaneously the three orthogonal components of ground EM decay. Indeed, the Y-component of the secondary EM field provides valuable information to delineate the location of small and/or disrupted conductors.
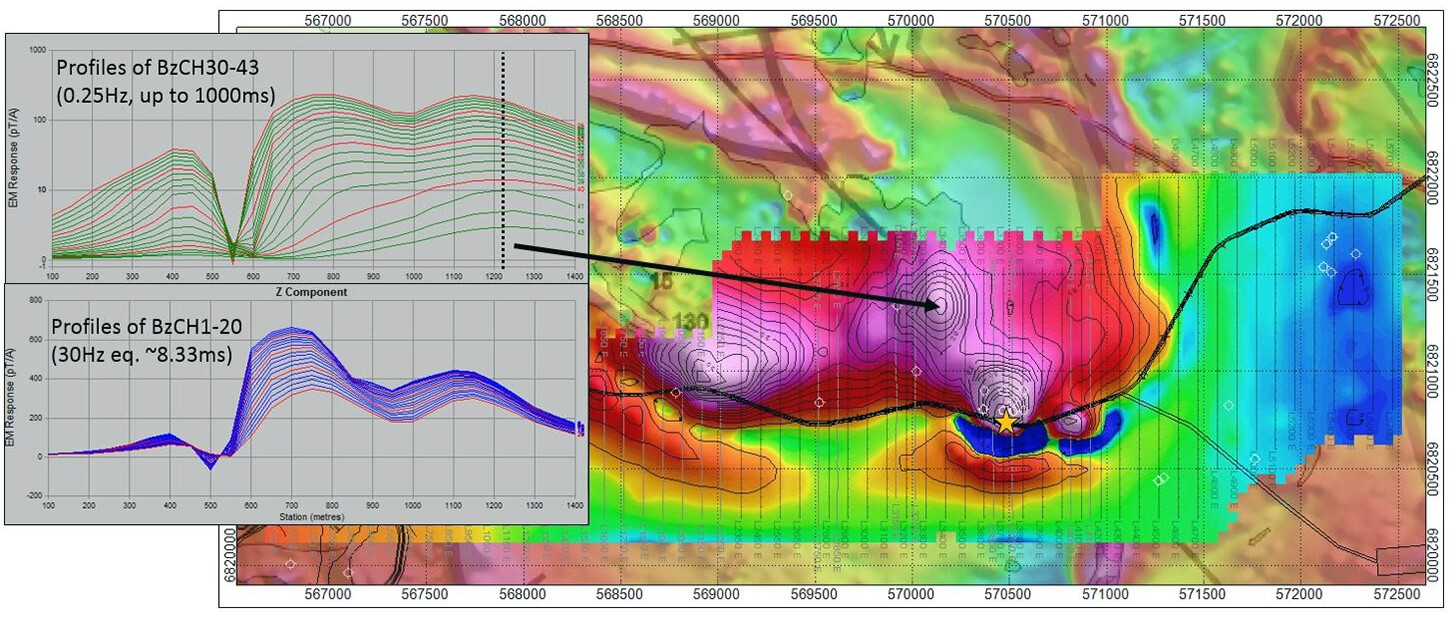
A ground EM example of the detection of a very good conductor at the late stage of secondary decay is presented in Figure 7. A large, distinct single peak anomalous signature can be interpreted on time gates 41 to 43. This signature is blind from 0 to 500 ms after the turn-off time. Unfortunately, this promising target, thought to be massive sulphides associated with the continuation at depth of an ultramafic intrusion, was explained by 50 m of graphitic-argillite. Also visible on this figure is a similar EM anomaly to the SE, on the road and identified by a star. This EM signature corresponds to a massive sulfide lens and adds evidence to the challenge of EM interpretation at Nunavik Nickel.
Alongside ground EM, borehole EM (BHEM) surveys are carried out in most of the exploration drillholes at Nunavik Nickel, and within some of the deposits’ definition-phase. There is no need to explain how powerful BHEM is for detecting and moving towards missed conductors (off-hole anomalies) and also to validate if the drillhole hit the border or the center of a horizon of interconnected sulfides. In order to maximise the BHEM results, each drillhole is surveyed twice. A first-pass is carried out with the transmitting loop laid out to generate a vertical EM field over the target. A second-pass of BHEM is then performed using a transmitting loop that is offset, in order to couple the target with a horizontal primary field. This methodology has proven to be very efficient to delineate mineralised zones of complex geometry. Also, to explore for an ore deposit’s lateral extensions, it is often best to change the location of the transmitting loop over the inferred ore extent and away from the known mineralized zone, in order to provide optimal maximum EM coupling of the primary field with the area of interest. Figure 8 shows an interesting BHEM result inside a drillhole located below one of Canadian Royalties’ open pit mines. The off-hole signature associated with the ore body was modelled and yielded a 200 m x 150 m thin plate of 4,000 S. This EM plate was then used as a targeting guide. Surveying nearby economic ore deposits is indeed a very handy way to “calibrate” and prioritise targets.
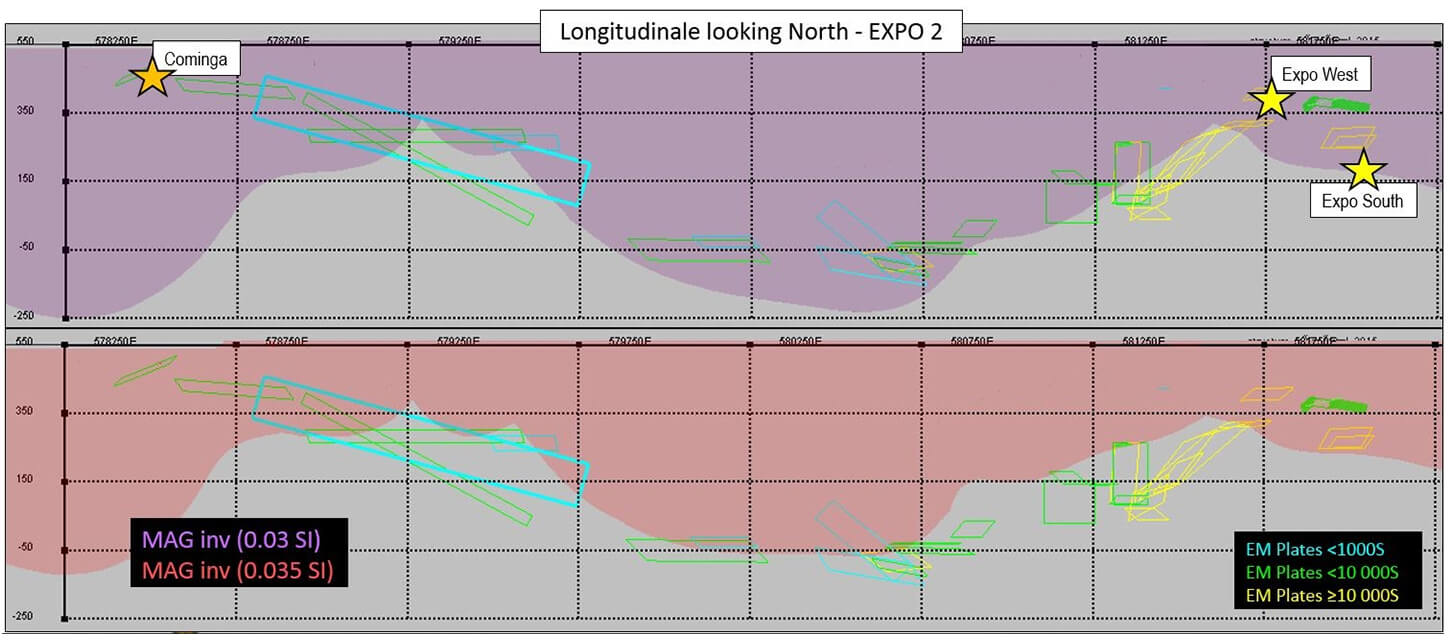
To enhance interpretation and targeting, numerical modelling of ground EM survey results is performed systematically. To generate a conductivity model of an exploration area, 3D EM inversion software are available as well, but have not yet been fully tested with Nunavik Nickel data. Ultimately, a handful of conductors will be detected at Nunavik Nickel and efficient targeting will rely on a good understanding of the corresponding geology and indications of structural traps. Targeting becomes most efficient when magnetics and electromagnetics results are combined. Figure 9 shows the longitudinal of a mineralised ultramafic intrusion whose footwall thickness varies significantly from west (Cominga showing) to east (Expo West, Expo South deposits).
Reflection Seismic
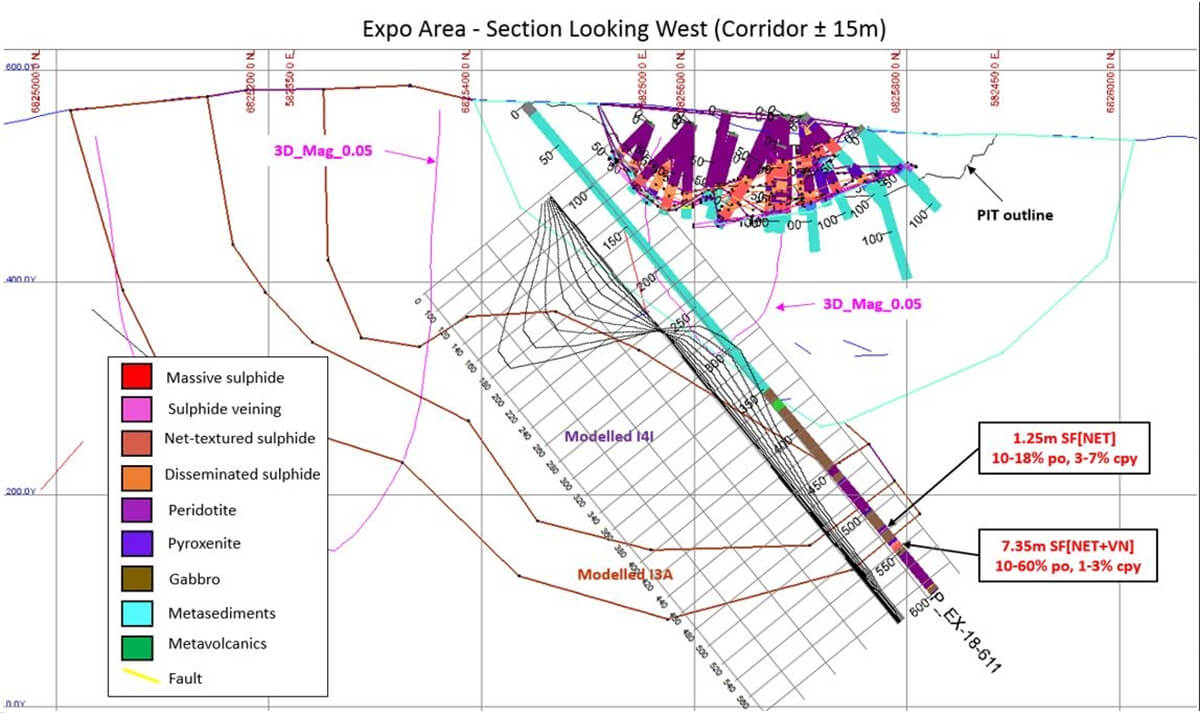
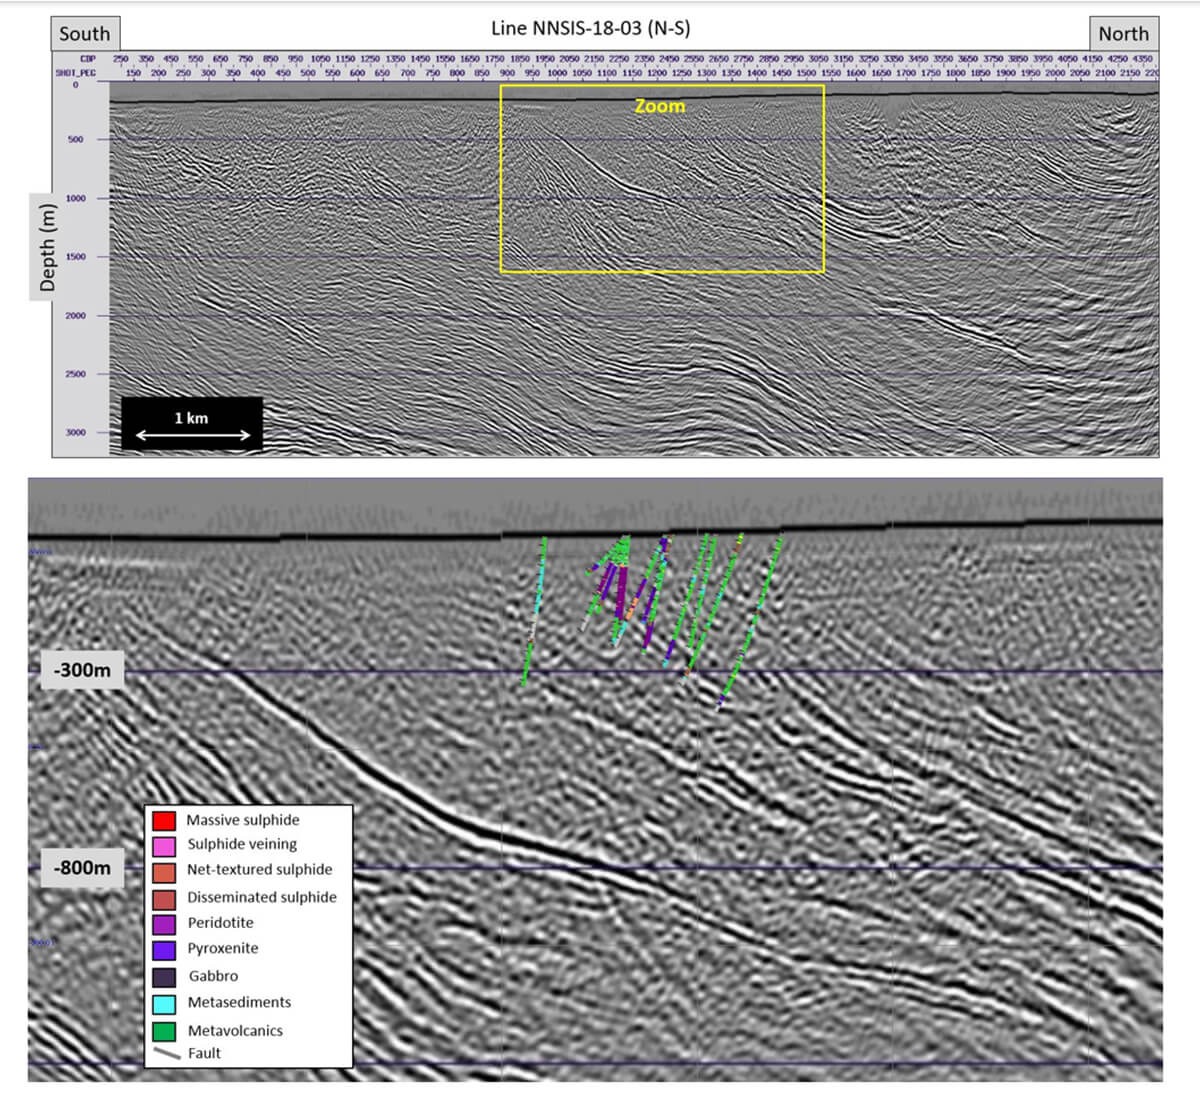
2D reflection seismic surveying was carried out over the Nunavik Nickel project in 2018 and 2019 with the objectives of supporting geological mapping from the near-surface to 1000 m depth, enhancing drilling targeting, and speeding up the discovery process. The preliminary test-survey allowed for validating the presence of reflectors at shallow depths, evaluating the impact of permafrost and soil type over results, and testing the mapping performance of the survey over known geology. Figure 10 shows one of the resulting sections compared against drilling results. Geological contacts between basalt and the ultramafic intrusion yield distinct reflectors. The sediment-to-basalt transitions also coincide well with seismic anomalies.
The geological setting at Nunavik Nickel can be characterized as a 3D environment with a high density of discontinuities and folds throughout the property, for both the host volcano-sedimentary basin and the Expo Suite intrusive. To balance between capturing the lateral geological variability and acquiring data over a wide portion of the property, the 2D seismic lines were positioned at regular intervals, perpendicular to the ultramafic intrusions and over key areas. Tie-lines were also included in the coverage to enhance delineation of reflectors and global interpretation.
The seismic program was implemented in two phases: an initial seismic survey was performed using tight receiver spacing to ensure that coherent noise could be filtered and that near-surface reflections could be imaged. Then, once the first seismic line had been processed and analyzed, optimal acquisition parameters were established and used in a more extensive seismic survey, in a subsequent phase. Even though this approach required mobilizing the seismic crew twice, it ensured that high quality seismic data could be acquired rapidly, and reduced the acquisition cost significantly. The most challenging aspect of the seismic program has been the preparation of winter roads to allow the Vibroseis trucks to travel along the seismic profile. Even with good access, the Vibroseis trucks required the assistance of large bulldozers to help them climb hills and areas of deep snow. The 50,000 lb Vibroseis source allowed seismic acquisition to proceed, even when the wind was blowing, and around mine infrastructure, where higher cultural noise levels were encountered.
Drilling results over reflectors confirmed that contacts between “Basalt (V3) and Pyroxenite (I4B)” and “Basalt and Gabbro (I3A)” yield clear reflectors. The corresponding reflection coefficients from the lab results for these two are in the range of 0.02. Lateral extension, dip and contact texture greatly influences the capability of producing reflections, but it appears that at Nunavik Nickel, the proposed minimum limit of 0.06 was too pessimistic.
Conclusions
Geophysics has proven to be a powerful tool for geological mapping and direct ore detection on the Nunavik Nickel property. While magnetics is very handy to outline the peridotite intrusions over the western half, the challenge increases in sectors where the ore-bearing intrusions contain less magnetite. In addition, even if they are good electromagnetic conductors, Ni-Cu-PGE deposits can easily be missed, not only because they tend to be of limited size and variable geometry, but also because they are masked by regional scale graphitic-rich sediments filled with veinlets of massive pyrrhotite.
Not many mining companies have included reflection seismic in their exploration programs. The results at Nunavik Nickel are very positive. This property is huge and drilling for new resources takes time, especially in the cold, remote, and very challenging tundra environment. After just a few weeks’ effort, reflection seismic has illuminated strong amplitude anomalies associated with key geological contacts, otherwise invisible, and this has already led the way to some exciting new discoveries.

Acknowledgements
The authors wish to thank Canadian Royalties Inc. for their permission to publish these results. They also wish to express their gratitude to the reviewers for their significant contribution. They also acknowledge the valuable help of Prof. Christian Dupuis (Laval University). The seismic data processing benefited from the experience of Mario Vecchi at Velseis. In addition, the authors would like to acknowledge the key role of their geophysical exploration partners over the past year: Discovery International Geophysics, Echo Seismic, Instrumentation GDD, Geo Data Solutions, Geophysical Intrumentation Group of Laval University, and Mira Geoscience.
Related Reading


Join the Conversation
Interested in starting, or contributing to a conversation about an article or issue of the RECORDER? Join our CSEG LinkedIn Group.
Share This Article