Why.. programming? (begin)
The word ‘Program’ (Wiktionary, 2006) derived from Ancient Greek πρόγραμμα (prógramma, “a written public notice, an edict”), from the verb προγράφω (prográphō, πρό (pró, “before”) + γράφω (gráphō, “I write”)). ‘If I write before’, I should have already planned and thought what to write. Programming is conceptually related to an idea or project which needs to be developed and usually it consists of a list of things or instructions to follow in a more or less rigid order. There could not be any form of project planning without first programming it.
In the field of geoscience, in the context of a research project or scientific investigation, we often have to deal with problems and endeavor to find the best solutions. By means of programming, we can structure and run simple or complicated models, and are able to check for potential or unexpected errors by querying results at key intermediate steps. The ability to program can be an invaluable tool for a geophysicist (or geoscientist), holding considerable promise to research results.
Knowing a programming language
To become proficient in a programming language, mastering the syntax is of primary importance. Even though the philosophy of most programming languages is more or less the same, the syntax of the language, which enables a specific command to be executed is generally different. Some structures or modules are common in any programming language. For example, the for-loop is an important control statement that allows a sequence of instructions to be executed repeatedly; it is present in most languages, however both its syntax and architecture can vary significantly. A simple for-loop program for computing the factorial of a given number N, N! = N*(N-1)*(N-2)*...*1, is hereafter shown in Fortran and C languages, respectively:
a) Fortran:
Program Factorial

implicit none

integer fact,N,I

write(*,*)'N = '

read(*,*) N

fact=1

if (N.ge.0) then

   do 100 I=1,N

   fact=fact*I

100    continue

   write(*,*)'N factorial is: ',fact

else

   write(*,*)'N must be positive!'

endif

stop

end
b) C:
/* Program Factorial */
#include <stdio.h>

int main()

{
int n, c;

int fact = 1;

printf ("N - ");

scanf("%d", &n);

if (n < 0)

   printf("N must be positive!");

else

{

   for(c=1;c <=n;c++)

{

     fact*=c;

}

printf("N factorial is: %d",fact);

}

return 0;

}
These two programs work correctly only if the input number is positive and integer (if
Another example is the redirection input/ output, which permits the user to pass external data as argument to the program, and to save variables from the program environment to a file. Users should also be familiar with toolboxes or libraries of subroutines or functions that allow the user, for instance, to interact with the program, like a dialog box that gathers input. Interactive modules are also available in combination with specific functions to visualize and manipulate the results of the program.
The case of Rayleigh waves
I am presenting an interesting case of an application of programming in geoscience by means of functions inspired by the movie “San Andreas”. This blockbuster is an attempt to stage the story of the ‘Big one’, a series of large earthquakes supposed to strike California and ultimately cause its separation from the continent. The San Andreas fault is the existing demarcation line between the two large tectonic plates, Pacific and North American, that move in a strike slip domain in opposite directions. There are many scenes of damage and total destruction; however before these tragic scenes, the director focused intelligently on a significant detail, namely the presence of surface waves like the Rayleigh waves that propagate on the ground for a time interval of ~ 5-10 seconds. Rayleigh waves are generated by mode conversion and coupling of body waves (P and SV waves) at the interface with the free surface and they can form long dispersive train of coherent energy. These waves represent a serious issue for constructions and facilities, since they are characterized by an elliptical polarization, adding to the ground motion elliptical pulses analogue to the sea waves. Rayleigh waves have been recognized as a significant source of increased damage during large earthquakes, partly because of their constructive interference with the incoming body waves, generating the well-known damage “belt effect” (Kawase, 1996, Graves et al., 1998).
Contrary to the case of P, SV, SH, and Love waves, which are characterized by linear polarization with an ideal ellipticity of 0, Rayleigh waves have elliptical polarization (ellipticity different from 0). The polarization of a seismic wave is the study of the propagation direction and its corresponding energy distribution. This concept is the basis for many practical applications in geophysics, engineering seismology, and reservoir characterization. In the aforementioned case of the Rayleigh waves, generation at the free surface requires the combination of two wave components linearly polarized, oscillating simultaneously in two orthogonal directions, the radial direction on the horizontal plane and the vertical direction. A necessary condition for the generation of a Rayleigh wave is the phase difference between the two ground motion components, upon which depends its ellipticity (René et al., 1986).
Feasibility in setting up a Rayleigh Explorer
With knowledge of the basic elements to generate a Rayleigh wave, my objective is to construct a model of a Rayleigh wave polarization in time, using Matlab®. A good starting point is to define a model with ideal propagation condition: for example we could assume that waves propagate in a half homogeneous space at a constant velocity, in which case the ground motion components could be represented by means of harmonic signals (like sine or cosine). The assumed initial condition might be a considerable simplification and not corresponding to reality; however, it can be very helpful in visualizing and understanding the modeled phenomenon. The basic ingredients for constructing this Rayleigh wave model are two harmonic signals, linearly polarized, oscillating at the same time in two orthogonal directions (horizontal and vertical) and characterized by a phase difference.
The first part of the accompanying program ‘Rayleigh_Explorer’ allows the user to input parameters interactively with a GUI (Graphical User Interface) by means of the Matlab function inputdlg. The required parameters are passed to the function as a string argument; some default values are also preassigned with a string. The key commands are:
prompt = {'t_0','t_1','dt','A_1','f_1 (Hz)','Phase_1','A_2', ...

   'f_2 (Hz)','Phase_2'}; defaultanswer={'0','10','0.01','2','7','0','3','7','60'};

answer=inputdlg(prompt,prompt_title,numlines,

   defaultanswer,options);
The function inputdlg creates a variable called answer, which is used as argument by the custom function ‘Harmonics’, hereafter listed, to build two sine curves in the time domain, characterized by the amplitude, frequency, and phase values previously assigned:
function [t,S_1,S_2] = Harmonics(answer);

% Usage [t,S_1,S_2] = Harmonics(answer);

A = str2double(answer); t = (A(1):A(3):A(2));

S_1 = A(4).*sind(2*pi*A(5).*t-A(6)); S_2 = A(7).*sind(2*pi*A(8).*t-A(9));
The resulting harmonics are combined to generate the polarization ellipse, using a plotting function (Hunstig, 2013) from the Matlab File Exchange. Both the harmonics and the ellipse are colored according to the time value using another function from the Matlab File Exchange (Niccoli, 2010), with commands like:
h = colormapline(S_1new,S_2new,t_new,pmkmp(128,'linearl'));
The full ‘Rayleigh_Explorer’ code listing is available at github.com/CSEG/programming.
The plot produced by the program ‘Rayleigh_Explorer’ is shown in Figure 1, with the two harmonic signals at the top and the ellipse at the bottom. The shape of the polarization ellipse is strongly dependent upon the input phase difference and frequency, and not all the combinations of parameters will result in one. If the phase difference is equal to 0, no ellipse will be produced, just a straight line, hint of a linear polarization with slope A2/A1, where A1 and A2 are the maximum amplitudes of the two harmonics. A1 = A2 will result in circular polarization, which is not typical of Rayleigh waves. Also large differences in the frequency of the two sine waves will affect the polarization of the combined wave with abrupt changes. The latter scenario can be considered quite unlikely since the two components that form a Rayleigh wave should be more or less coherent in frequency value. As a practical implication, the efficacy of the proposed model has to be constrained by the physical nature of the phenomenon. With the default time vector, a good range of values for frequency would be from 7 to 10 Hz, with a recommended phase difference spanning -60 to -90 and 60 to 90 degrees. For Rayleigh arrival models in lower frequencies the time vector has to be extended, otherwise only partial ellipses will be produced.
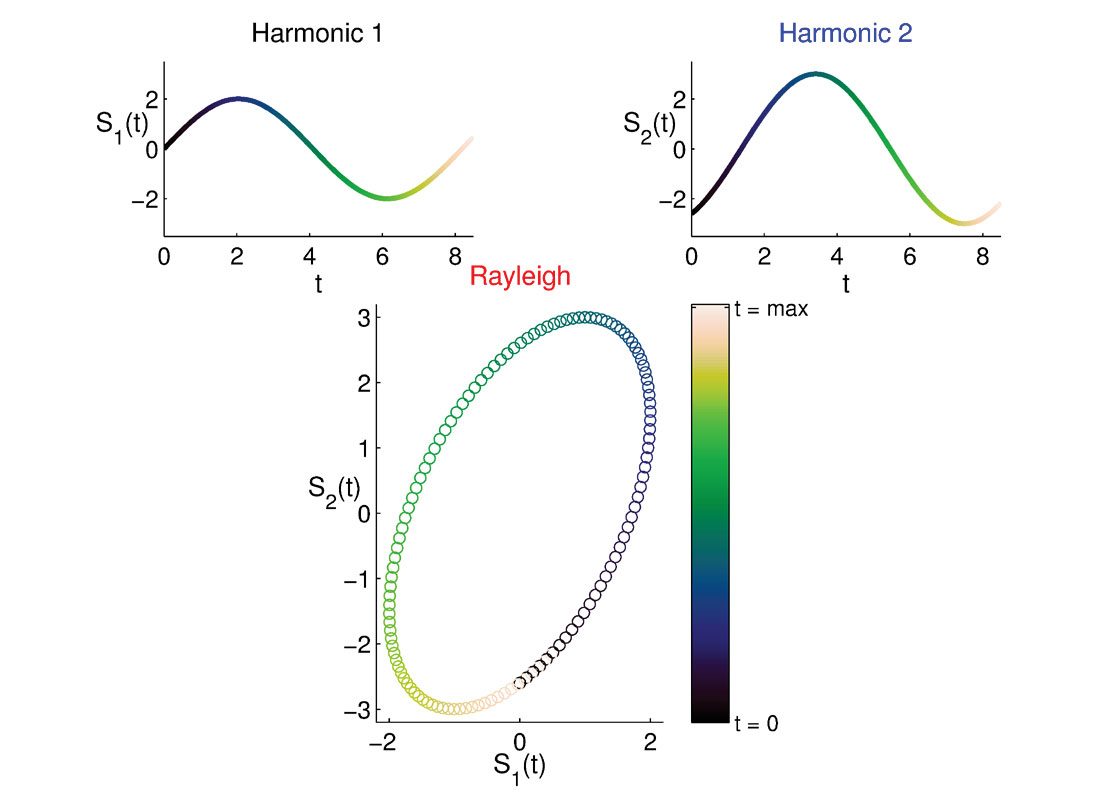
Results obtained with the aforementioned program are useful to understand the physics and polarization of Rayleigh waves. I encourage readers to experiment with the program and to modify the default parameters. For example, assuming constant frequency every time the program is run, for a phase difference equal to 0 degrees a straight line will be produced, which means linear polarization. However, increasing progressively the phase difference, we start building the Rayleigh wave “plumping it up” by increasing its ellipticity and changing its inclination up to the maximum value of 90 degrees, resulting in a vertical polarization of the Rayleigh. Values of A1 lower than A2 will determine an ellipse mainly polarized on the horizontal direction (A1) while the opposite case will produce a Rayleigh wave mainly polarized on the vertical direction (A2). The sign of the phase difference denotes the rotation direction of the ground motion, and by convention if the phase difference is positive the polarization is retrograde (counterclockwise rotation) and vice versa (René et al., 1986). The retrograde rotation of the ellipse is clear in Figure 1, since the color intensity increases in time (with hue cycling from black to dark blue, green, light green, yellow, and finally white).
Showing Rayleigh waves propagation
The presented ‘Rayleigh_Explorer’ program is useful for understanding how a Rayleigh wave is generated and its main polarization characteristics. My second objective is to write a program to visualize its real ground motion as it propagates on a free surface. This new program, called ‘Rayleigh_wav’ is also available at github.com/CSEG/programming and it recalls a new function ‘Harmonics_t’, which is similar in structure to the previously defined ‘Harmonics’.
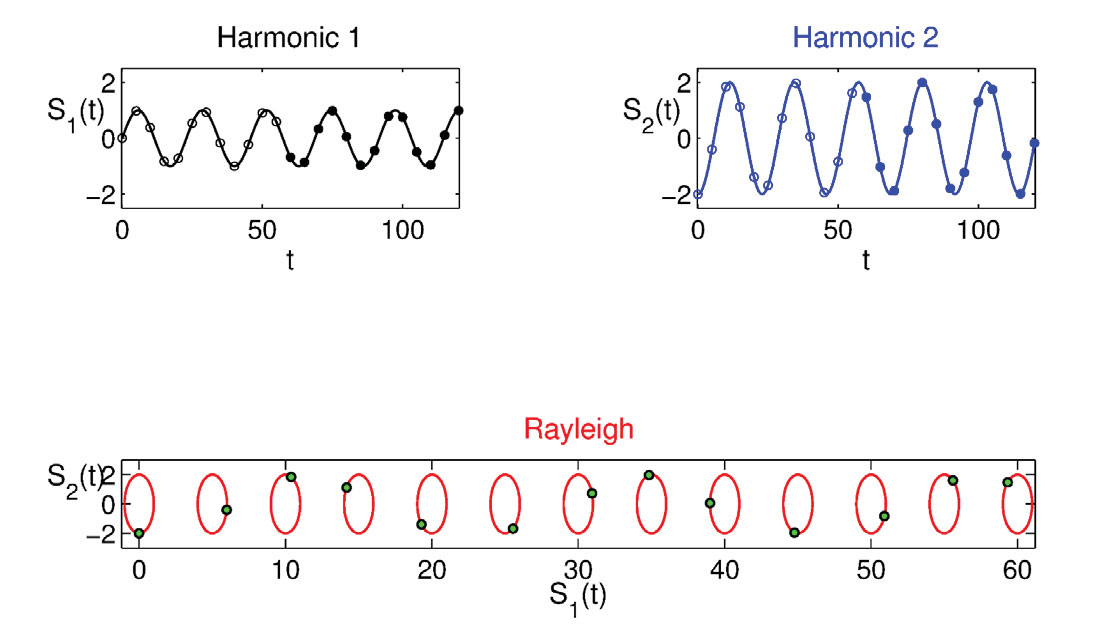
Figure 2 shows the result of the program output. At the top, the two harmonics are plotted in time moving at a specific time rate, which can be modified by user (the default value is 5 seconds). At the bottom the coupling of these two harmonics in time defines a sequence of ellipses moving at the same rate. In addition, the start and end time of the two harmonics is highlighted respectively with circles and filled dots (black for the first and blue for the second harmonic). The corresponding motion of the start time is marked on the ellipse sequence with green filled dots. Figure 2 visualizes the Rayleigh wave motion, demonstrating its similarity to sea wave motion. As with the previous program, not all the combinations of input parameters will produce a complete polarization ellipse, however for all the parameter combinations that do, the resulting wave will be much similar to those propagating on the sea surface.
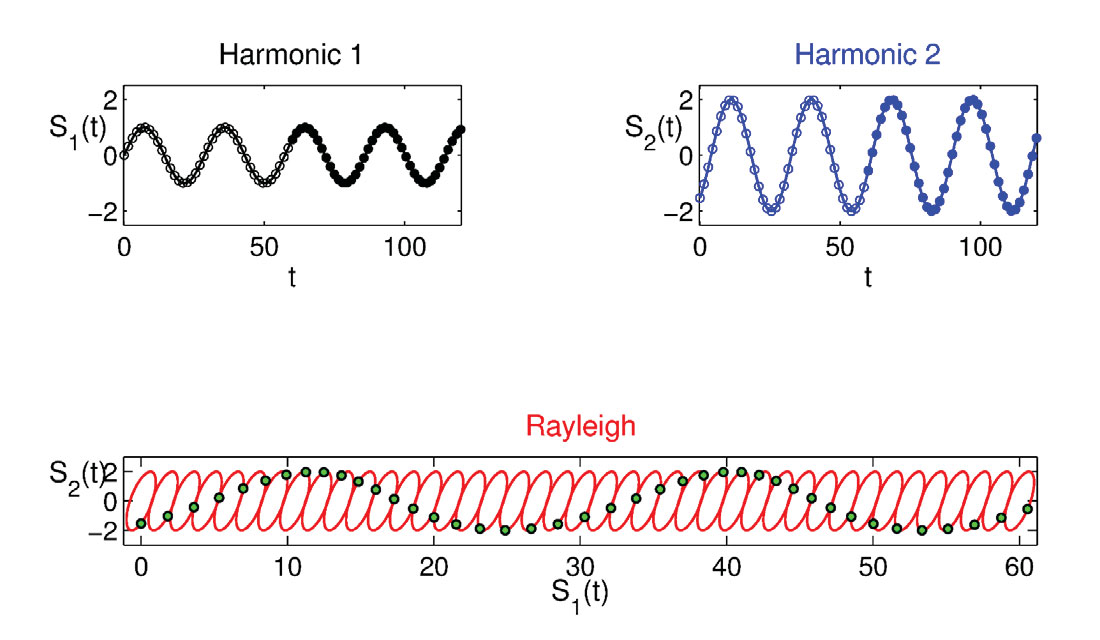
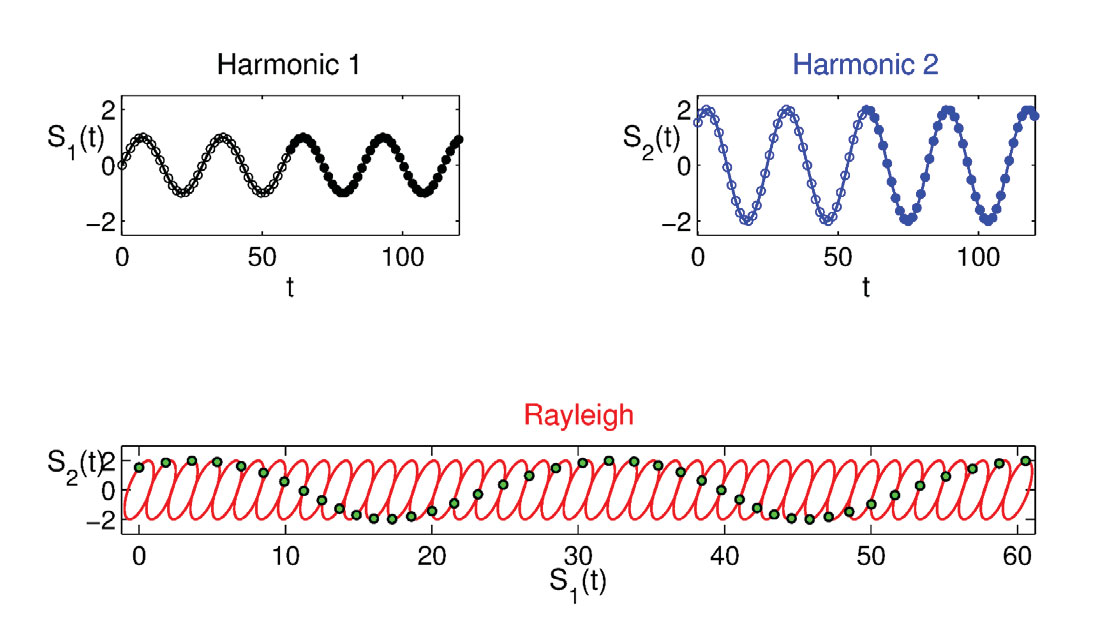
Figures 3 and 4 are similar to Figure 2 and contribute to strengthening the understanding of this Rayleigh model. Both are obtained modifying the input parameters, lowering the frequency (2.0 Hz) and the time interval of the wave progression (1.5 seconds). However the phase difference, 50 (Figure 3) and -50 (Figure 4) degrees discriminates between a clear counterclockwise, (retrograde polarization, Figure 3), and a clockwise motion (prograde polarization, Figure 4). These models are fully consistent with the physics of the Rayleigh waves propagating in a half homogeneous space and the convention of the rotation direction.
Why... programming? (end)
I tested the feasibility of a ‘Rayleigh_Explorer’ using Matlab programming language to understand the main polarization characteristics of Rayleigh waves and how they are generated. These waves have been interpreted as a source of increased damage during large earthquakes, since they perturb the ground producing oscillations at the free surface that are similar to sea waves. I then demonstrated how we can build a robust model of a Rayleigh waves propagating in time on a free surface.
These examples showcase how mastering the tools accessible by learning a programming language (Matlab, Python, etc.) allows for the planning and building of a solid model of a physical phenomenon, and to visualize and understand it.
Get the code
The full Matlab code used in this article is available on GitHub at https://github.com/CSEG/Programming and licensed under BSD terms, https://opensource.org/licenses/BSD-2-Clause.

Acknowledgements
I wish to thank Matteo Niccoli and Fereidoon Vasheghani for their constructive comments and suggestions.


Join the Conversation
Interested in starting, or contributing to a conversation about an article or issue of the RECORDER? Join our CSEG LinkedIn Group.
Share This Article