Abstract
Azimuthal Amplitude Versus Offset is a new seismic method that is gaining popularity amongst those investigating fractured reservoirs. It is also known as AVAZ for Amplitude Versus Angle and aZimuth, AVOA for Amplitude Versus Offset and Azimuth and AzAVO. This paper will use the term AVAZ.
The AVAZ method is examined using examples to determine whether it is providing valid information about the fractures at existing wells. It is tested in reservoir characterization to see if it helps to predict the production rates of new wells. This is followed by a discussion of how AVAZ can be used in structural interpretation.
Introduction
The AVAZ method can be used to identify the presence of fractures between well locations using wide-azimuth 3D seismic data (e.g. Gray and Head, 2000, Hall et al, 2000, Gray et al, 2002). Fractures are defined as cracks in rock that typically have apertures of a few millimeters or less. They usually show little or no displacement along their faces, i.e. they are not faults. As the fractures are so much smaller than a seismic wave, which is typically tens of meters in length, the AVAZ method is only capable of detecting the cumulative effect of swarms of aligned fractures and not individual fractures. Further, these fractures must be close to vertical. Fortunately, these conditions frequently exist for fractured reservoirs.
In the mid 1990’s, it began to be shown that there are measurable differences in the seismic AVO responses parallel and perpendicular to fractures, (e.g. Lynn et al 1996, Mallick et al, 1998, and MacBeth et al, 1997), suggesting that AVAZ would be a viable technology. In the late 1990’s, AVAZ began to be used on 3D datasets and quickly provided evidence of its importance (e.g. Gray et al, 1999). Early work showed that the AVAZ signal is detectable in 3D seismic, (e.g. Gray et al, 1999, Hall et al, 2000, Jenner, 2001, and Gray et al, 2002). It has also been shown that AVAZ results correlate to known geology, (e.g. Gray and Head, 2000, Gray et al, 2002). Here, examples are examined to validate that the seismic AVAZ attribute does indeed provide additional useful information about the fractures in a reservoir.
Following a brief discussion of the AVAZ method, this paper examines some short case histories in which seismic AVAZ has been used in reservoirs where geologic information is available to check and to calibrate the AVAZ response. The first example is from Manderson Field in Wyoming, a Permian age carbonate reservoir (Gray and Head, 2000). The second is from the Pinedale Anticline Field, Wyoming, which is a Cretaceous tight sandstone reservoir that developed in a braided stream environment (Gray et al, 2003). After establishing the validity of the AVAZ method, the question is asked: How can geologists contribute to the interpretation of these data? To answer this, the AVAZ analysis of the Narraway Anticline Field in western Alberta, Canada is used. The Narraway Anticline reservoirs of interest are Cretaceous tight beach sandstones, (Todorovic-Marinic et al, 2004).
Method
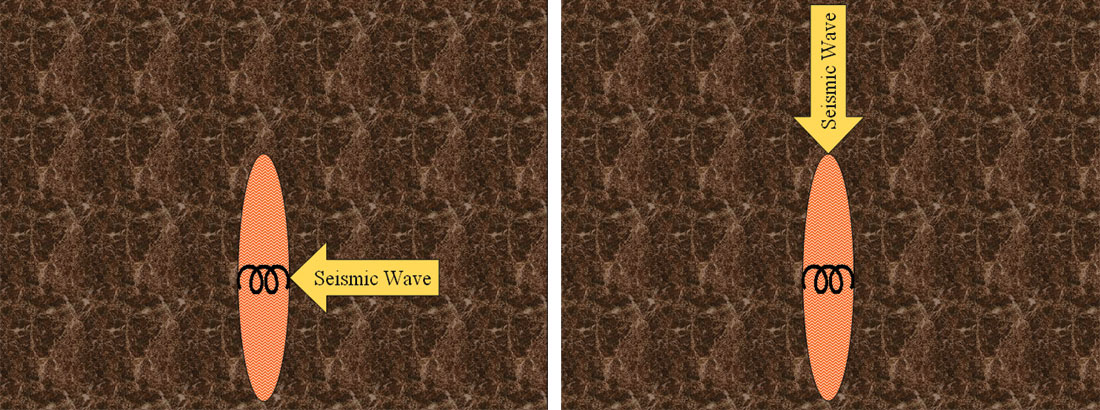
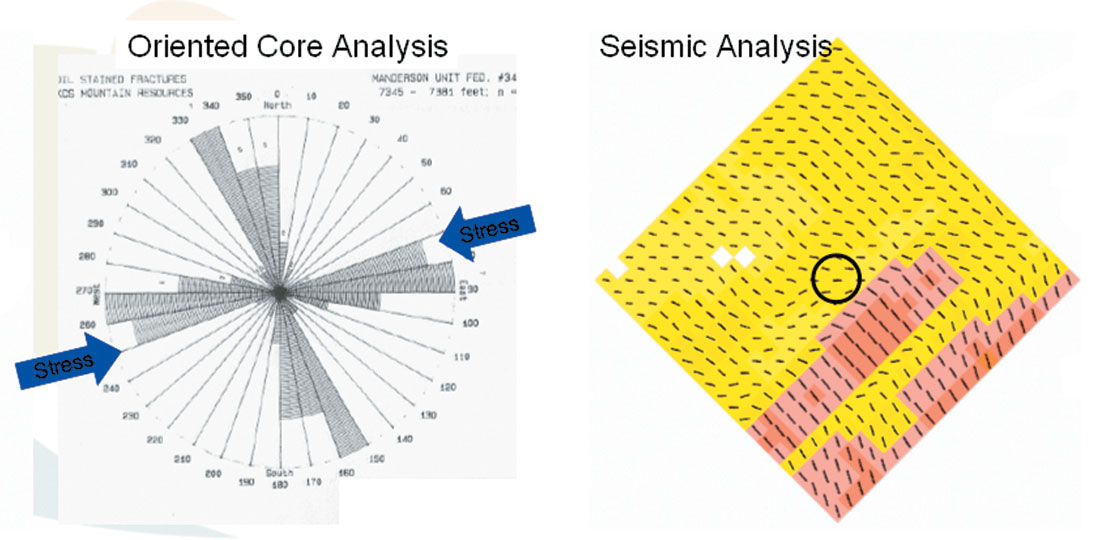
After making some assumptions, AVAZ can be shown to be representative of Thomsen’s (1995) crack density measurement (Lynn et al, 1996). AVAZ takes advantage of the fact that fractured rocks perpendicular to the fractures are weaker, and therefore more compliant, than fractured rocks parallel to the fractures. Fluid-filled fractures respond somewhat like a spring to the seismic wave as it passes across them (Figure 1a). Typically, for this spring-like phenomenon to be significant, the seismic wave must hit the fractured layer at a significant angle from the vertical. The seismic wave traveling parallel to the fractures does not encounter this spring-like behavior (Figure 1b) to the same degree. Thus, the seismic waves striking the reservoir from different directions see different rock properties when the reservoir rock contains fluid-filled fractures. The AVAZ method measures the magnitude and direction of these differences in rock properties, which is known as seismic anisotropy.
The AVAZ technique requires wide-azimuth 3D seismic data. Differences in AVO responses from 2D lines over known fractured reservoirs can be an indicator that the AVAZ technique will work, but no differences do not necessarily mean that there are no fractures; the 2D lines could simply be oblique to the fracture set. The AVAZ technique can frequently be applied to existing 3D seismic datasets. This is especially true for land surveys in North America where data has been acquired with wide azimuths for many years. Because the key factor for the applicability of AVAZ is the azimuthal coverage, most AVAZ studies to date have been done using land surveys with the exception of a few using Ocean- Bottom Cables (OBC), (e.g. Hall et al, 2000 and Roberts et al, 2001). Typical marine streamer surveys are not candidates for AVAZ analysis as they usually have narrow azimuth geometries. The primary requirement is that some of the seismic waves hit the reservoir at a sufficient angle from the vertical. In order to receive resolvable signal, this should be at least 30º in the inline direction. This is generally the case in modern surveys and is usually achieved if the maximum shot-receiver offset is equal to the depth of the target reservoir. For example, for a target at 9000 ft, the maximum shot-receiver offset should be at least 9000 ft. The wide azimuth requirement for AVAZ necessitates that some seismic waves must hit the reservoir at a sufficient angle in the cross-line direction. Using a surface-fitting AVAZ technique where an equation relates the seismic amplitudes to angle and azimuth (e.g. Rüger, 1996) allows some relaxation of the requirements in the cross-line direction, provided that the inline offset allows for angles of at least 30°. Satisfactory results have been achieved when the cross-line maximum offset allows the seismic wave to strike the reservoir at 20° or greater using a surface-fitting AVAZ algorithm. The higher this angle range in the seismic data, the better the signal-to-noise ratio will be in the AVAZ results, provided that the assumptions of the method are met.
The assumptions typically used in modern AVAZ analysis are the following:
- Small contrasts in elastic parameters, P-wave velocity, S-wave velocity and density, between the reservoir and the surrounding rock.
- Weak seismic anisotropy (Thomsen, 1986).
- The reservoir behaves as an Horizontally Transverse Isotropic (HTI) medium, i.e. the reservoir contains a single set of aligned, vertical, penny-shaped cracks.
- The seismic wave strikes the reservoir at small incidence angles (<35°) from the vertical.
- The azimuth of the seismic wave at the reflection point is the same as the shot-receiver azimuth.
Practically, AVAZ seems to work in the following situations:
- The seismic anisotropy is caused by fluid-filled fractures, i.e. filled with brine, oil or gas.
- There is a single fracture set. This can come about in two ways:
- There is a single set of aligned vertical fractures within one seismic superbin (approx. 100x100 m2).
- There are multiple fracture sets under the influence of a stress field where the maximum horizontal stress field is significantly stronger than the minimum horizontal stress.
- There is a fracture set that is near vertical (>65°).
- The fractures are connected (Maultzsch et al, 2002).
In order to measure an AVAZ response, there must be some coherent signal from the reservoir. Where there is signal continuity, the AVAZ technique works well (Soto Aguila et al, 2003). If the signal is incoherent, then the rocks are probably so broken up that another seismic measurement, such as signal continuity, will give more insight into the fracture distribution.
Strong acquisition footprint can be a significant contributor to difficulty in understanding the AVAZ result. The acquisition footprint is an imprint of the surface geometry of shots and receivers on the seismic data. It is most easily observed as linear amplitude anomalies parallel to the acquisition geometry in timeslices of the seismic dataset. Footprints can occur when shot and/or receiver line spacings are not suitable for the target reservoir. Improper acquisition for the target reservoir can lead to AVAZ responses showing acquisition footprints that overwhelm the AVAZ response. Prescreening of every 3D dataset for footprint and the maximum incident angles in the inline and crossline directions to ensure that they are suitable for AVAZ is relatively simple and quick. This prescreening rejects those datasets that are unsuitable for AVAZ analysis early on. The field has several wells with cumulative production in excess of original oil-in-place estimates. Low matrix porosity, production history and strong pressure support in these wells suggest that oil is produced from a fracture system with significant lateral connectivity. A wide-azimuth 3D seismic survey was shot in 1996 to improve structural definition of the reservoir. Three oriented core analyses, acquired between 1996 and 1998 within the 3D-survey area, are available for comparison. Analysis of fractures in the cores shows varied and multiple fracture orientations at all these wells.
Figure 2a shows the fracture strikes estimated from the seismic data around the location of Well 43-33, which is the most prolific well in the field. Having produced one million barrels of oil since 1953, it continues to produce with strong pressure support to this day. AVAZ analysis was performed on a half-mile square around the well location. The results show a very complex fracture pattern. The fractures estimated using AVAZ are compared to an analogue found in an outcrop of fractured Liassic limestone from the coast of Wales (Figure 2b). Interestingly, the pattern of fracturing seen in the Liassic limestone is very similar to the fracturing estimated around Well 43 33. Therefore, this analogue may be a useful guide for interpretation of these complex AVAZ results. The complicated fracturing seen in this small outcrop provides confidence that the complex fracture patterns indicated by the AVAZ fracture analysis technique at Manderson Field do indeed occur naturally. A small fault runs from the bottom left to the top right of the photograph of the outcrop. Fractures curl into the fault at the top of the photograph and fractures abut against the fault at near right angles near the center of the photograph. Similar patterns can be seen in the lower half of the fracture analysis around Well 43-33 (Figure 2a). Auzias et al (1997) suggest that this complex fracturing in the Liassic limestone is due to a second stress field applied to already fractured or faulted rock. In the case of the Phosphoria reservoir in Figure 2a, the fractures shown by the AVAZ analysis would therefore suggest that small-scale faults were already present when the rocks around Well 43-33 were last stressed. Suggestions of some of these pre-existing but sub-seismic scale faults can also be seen in the results of the fracture analysis in Figure 2a to the south of the well location where the fracture strike changes abruptly. These fractures curl southeastwards into what can now be interpreted as a fault. To the south of this interpreted fault, the fractures abut against it at right angles. This is conspicuously similar to the photograph of fractures around a fault in the Liassic limestone shown in Figure 2b.
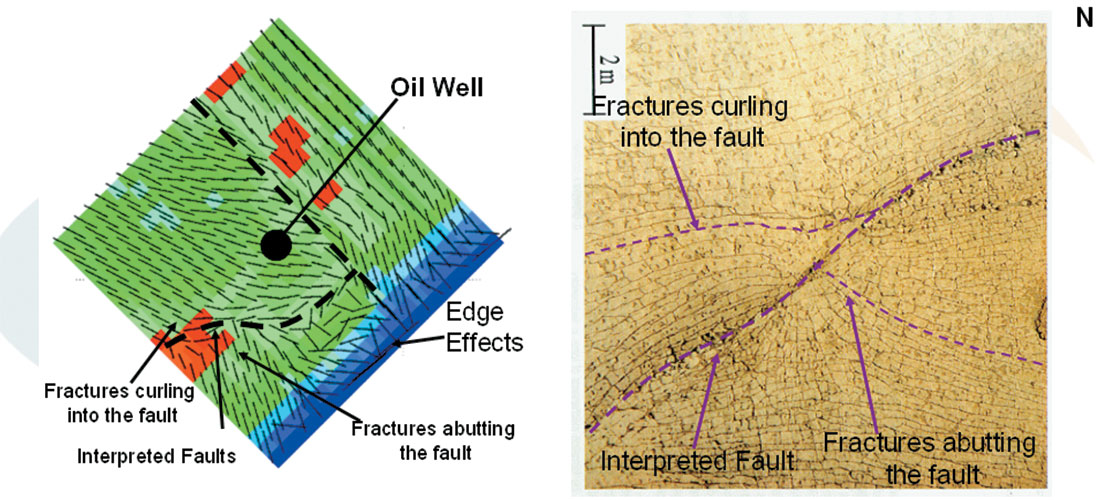
Taking this analogy further, a fault can also be interpreted to the northeast of the well location. The top of the anticline is to the northeast of this location and it plunges to the northwest. Therefore, if these faults are sealing, a fault trap exists within a few hundred feet of this well location. In addition, the fractures indicated to the west of the well location are some of the largest indicated by AVAZ in the field and could be a delivery system allowing downdip oil to be drained by this well. Thus, through interpretation of the AVAZ results, a reasonable explanation for the prolific production at this well has been described.
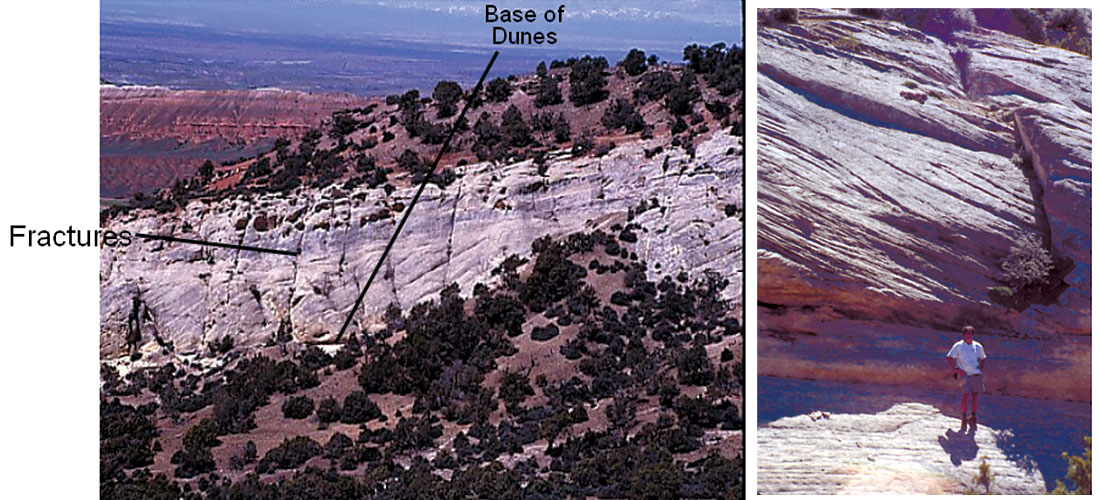
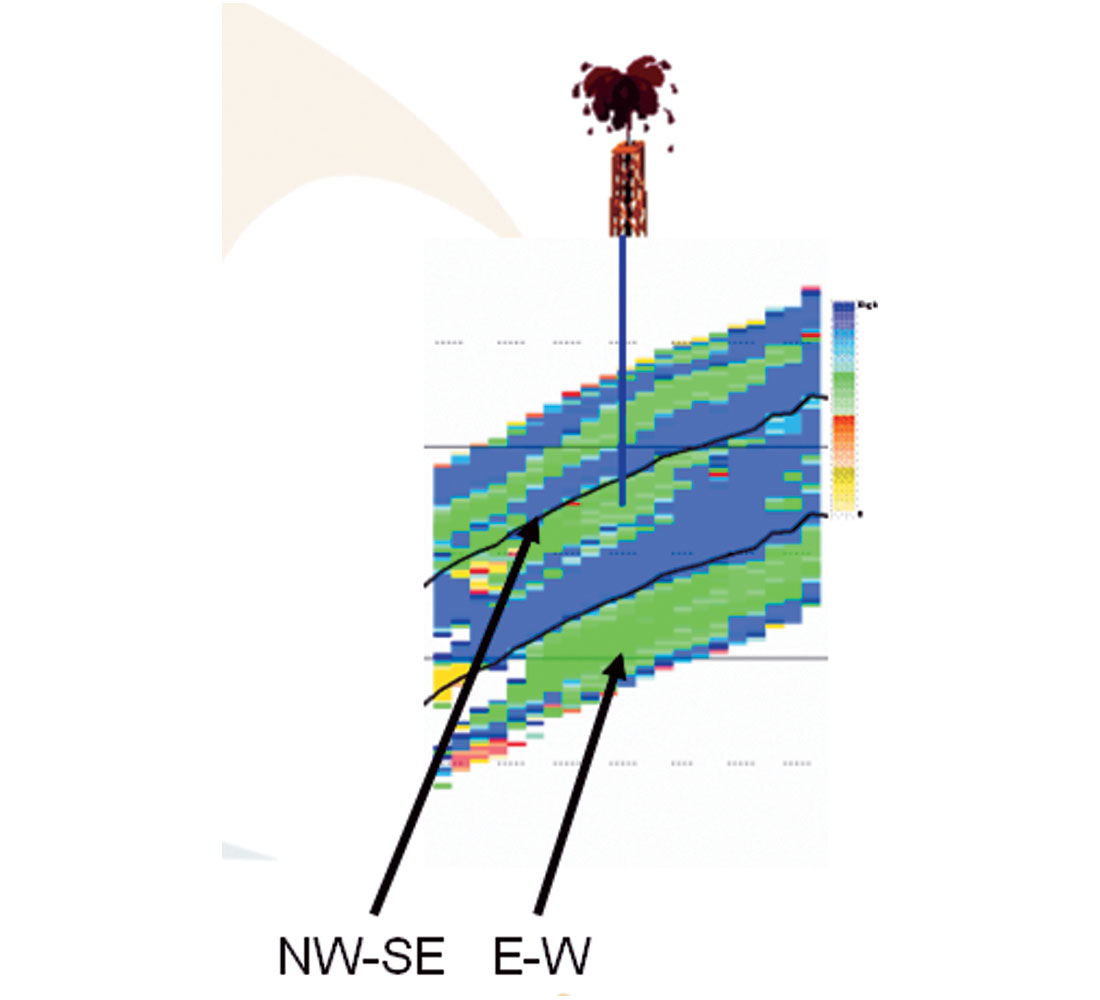
Figure 3a shows outcrop of the Tensleep Formation at Zeisman Dome 10 miles southeast of the Manderson Field. Here, the Tensleep consists of a dolomitic sand dune sequence. This formation, at the base of the dunes (Figure 3b), is a mechanically weak rock that is much more susceptible to erosion than the rocks above and below it. As a result, this thin interval forms a mechanical boundary within the Tensleep that does not allow fractures to pass through it as can be seen in Figure 3b. The AVAZ analysis at Manderson suggests that fracturing is very complex and it appears to be formation dependent. LaPointe (1999) observed that the fractures here in the Tensleep are of different orientation than most of the rest of the fractures observed in outcrops of other formations. In these outcrops, most of the fractures are oriented NW-SE, while the fractures in the Tensleep strike E-W. Figure 3b shows that even large fractures in the Tensleep do not cross formation boundaries. The AVAZ analysis of the Tensleep formation at a depth of about 7000 ft (Figure 4) is consistent with LaPointe’s observations. It suggests that the fractures within the Tensleep at Manderson Field consistently strike E-W, while a large proportion of the fractures in the other formations strike NW-SE. The AVAZ also indicates that the fracturing is formation dependent, with a sharp change from NW-SE to EW striking fractures at the top of the Tensleep and then back again to a NW-SE strike at its base. Thus, there is a good indication, from outcrop, that the seismic AVAZ fracture analysis is detecting the correct orientation of the fractures.
Within the area of the 3D seismic survey, three oriented core analyses were preformed to characterize fractures. These core analyses are compared to the results derived from the AVAZ fracture analysis to confirm the AVAZ results. Issues in core orientation analysis could result in error bars of up to 30º in the fracture strike. The AVAZ seismic strike measurements are accurate to within ±11° for this survey.
Core analysis for Well 34-18 shows two predominant orientations of open fractures at 85º and 160º (Figure 5a). By comparison, the seismic fracture analysis estimates the strike of open fractures at this location to be 90º (Figure 5b), very close to the 85º orientation observed in the well. Moreover, this well is an excellent gas producer with moderate values of fracture density observed in both the seismic and the core analysis (Figure 7 – middle point). Examination of the fracture strike estimated using AVAZ around this well suggests that two flow paths may be converging at this location. This may be the reason this well produces at a high rate.
Core analysis for Well 42-24 (Figure 6a) indicates 17 fractures, all but one of which is cemented or closed, i.e. this rock in effect has no open fractures. The seismic fracture analysis estimate also indicates that there are no open fractures at this well location (Figure 6b), consistent both with the well observations (Figure 6a) and the theory used to develop this technique (Thomsen, 1995). In addition, after testing no reservoir fluids, this well was plugged and abandoned two days after drilling. Therefore, it can be concluded that this well and the area around it effectively have no open fractures. The potential for dry holes such as this to be avoided is greater if seismic fracture analysis is done prior to drilling.
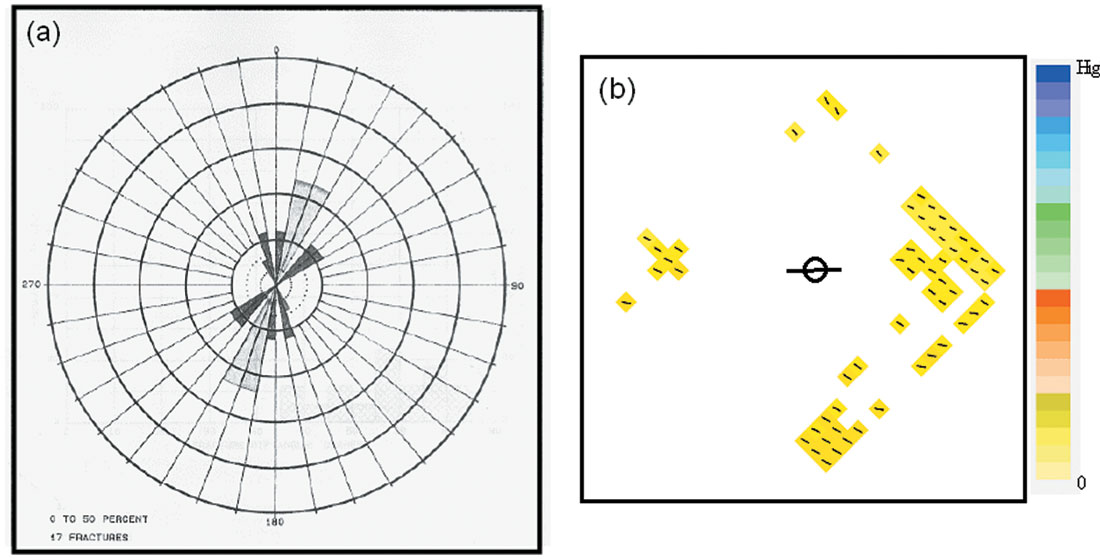
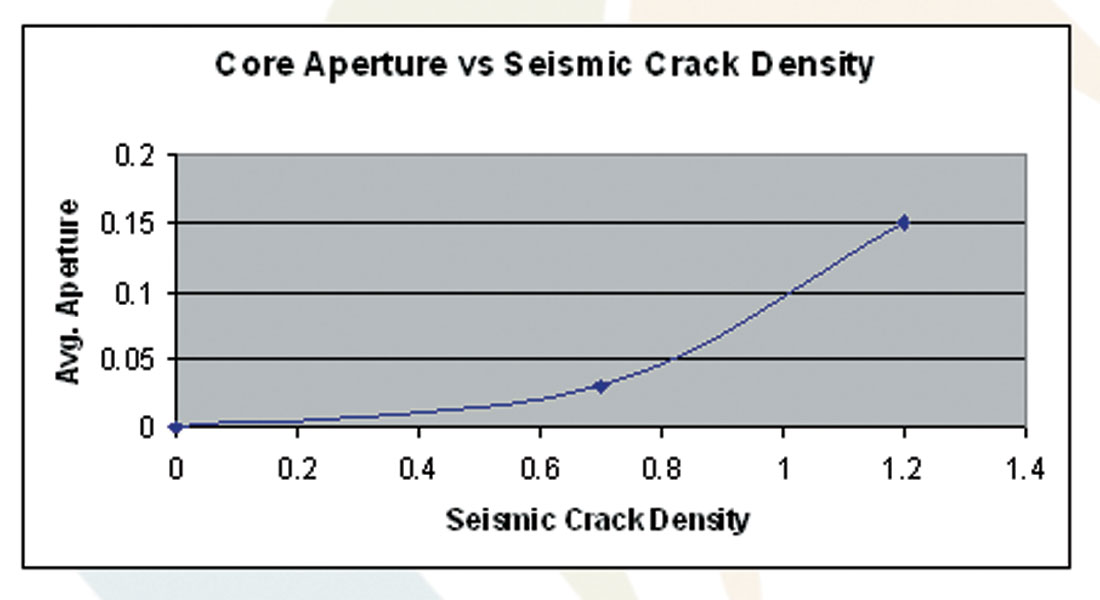
Figure 7 shows the relationship between the seismic AVAZ crack density estimate and the average aperture of the fracture s observed in the three wells that have oriented core analyses. The results suggest that larger crack density values indicate wider average apertures of the fractures. Using only three data points, it is difficult to make any definitive conclusions. Still these results are consistent with the theory that was used to develop the AVAZ technique.
Pinedale Anticline Fractured Reservoir Characterization
The Pinedale Anticline in Wyoming, USA, has become an area of significant interest since the recent success of several wells that have produced significant volumes of gas from its tight sandstone reservoirs. The Pinedale Anticline has been estimated to contain 159 TCF of in-place sweet gas (Law and Spencer, 1989), of which only a tiny proportion has been produced. The reservoirs of current interest in the Pinedale Anticline are the tight sands of the Lance and Mesaverde Formations. These units were deposited during a period of rapid sedimentation in the late Cretaceous. Sediments were eroded off the western upland and carried by fluvial systems flowing to the east. Lithologically, the Lance and Upper Mesaverde consist of fluvial channel sandstones and siltstones, floodplain shales, and minor coals. Production from these reservoirs is now possible using new stimulation techniques developed in neighboring Jonah Field. The best production rates appear to come from reservoirs that have had their permeability enhanced by natural fractures. Therefore, the ability to detect the presence of natural fractures in the reservoir could have a significantly positive impact on the success of future wells. The AVAZ technique has been used on 50 square miles of CGGVeritas’ 203 square mile, multi-client, Pinedale 3D seismic survey over the Pinedale Anticline to identify the presence of these fractures. The results have been incorporated into a fractured reservoir characterization run for this field. The reservoir characterization is shown to successfully predict early well production, by comparison to the production of a successful well drilled shortly after the completion of the reservoir study.
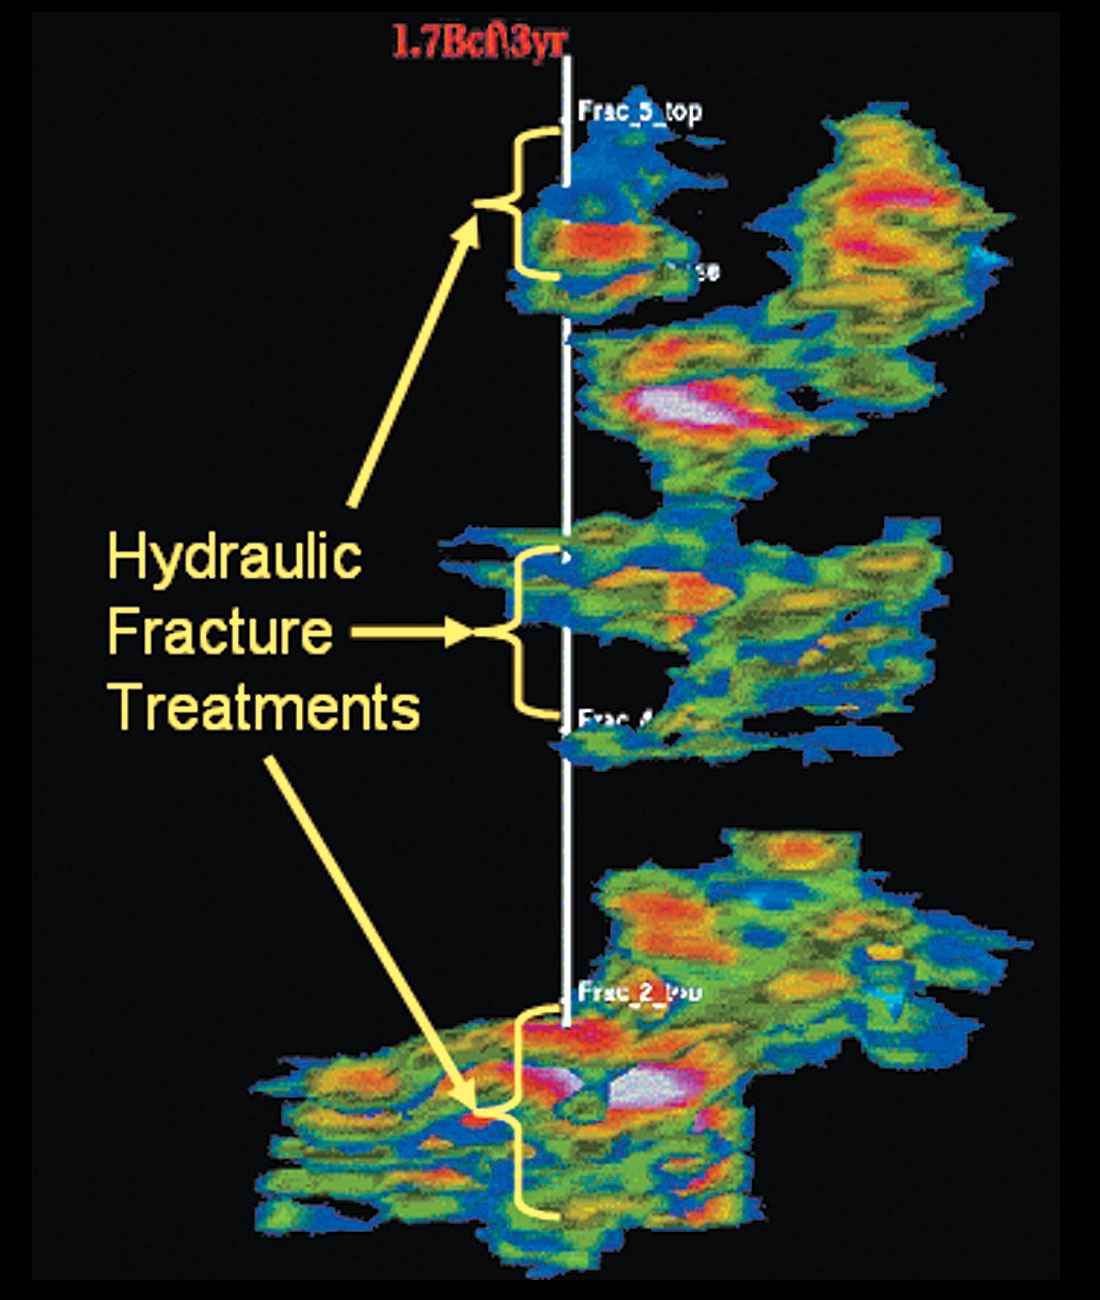
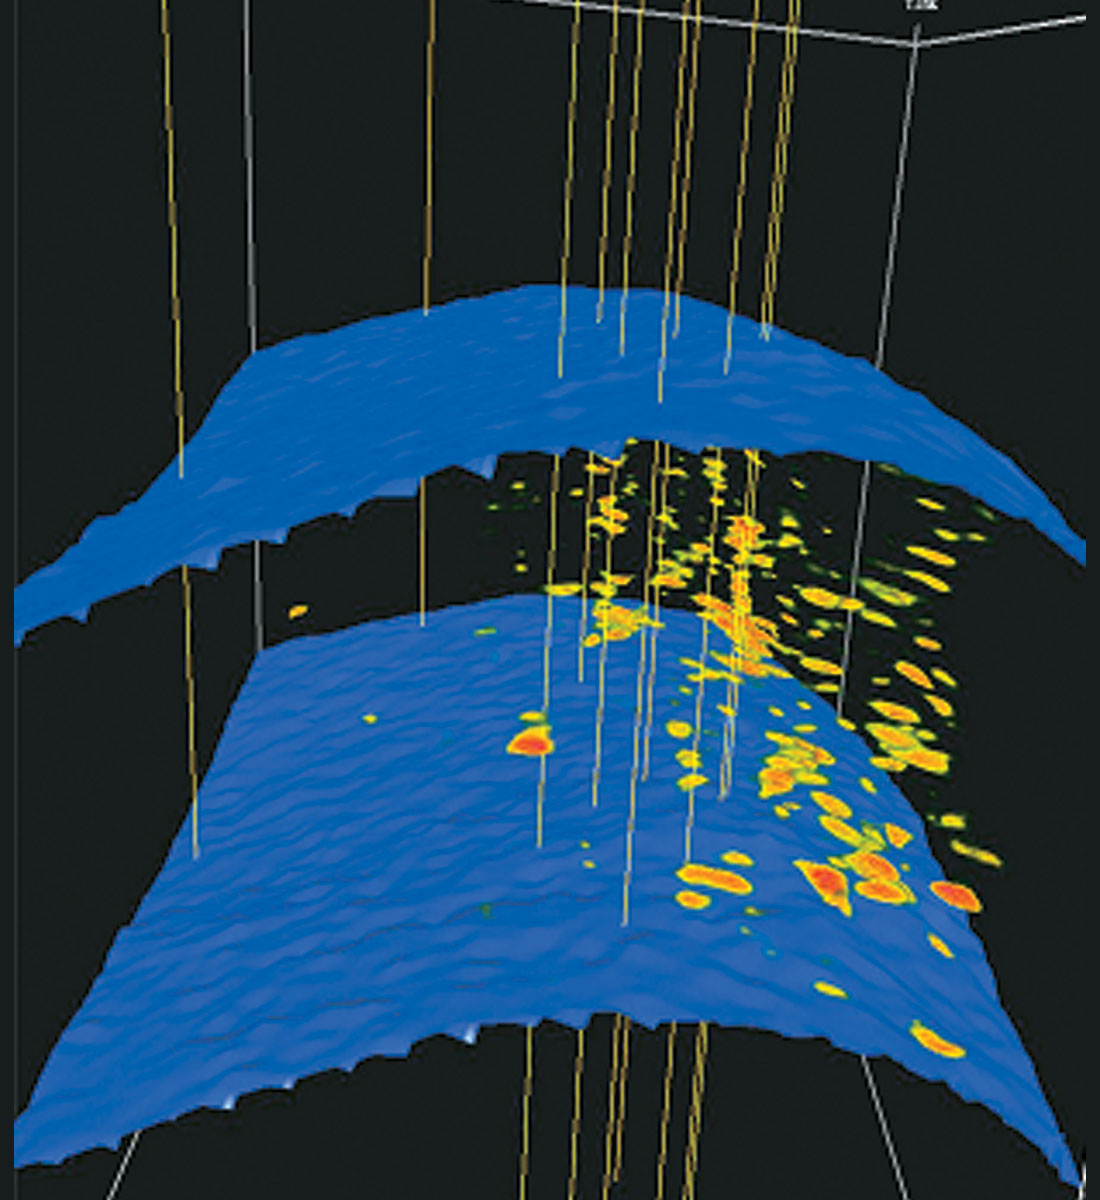
Figures 8 and 9 show how zones of crack density can be visualized. Figure 8 shows geobodies of crack density generated around the track of one of the better producing wells in the Pinedale Anticline Field. These geobodies correlate well with the zones where hydraulic fracture treatments have been run in the wellbore. The location of these fracture treatments was determined from the mud log. The fracture treatments were run where significant mud-loss occurred during drilling. It is presumed that mud-loss measured in the mud log indicates areas where the mud flowed into natural fractures and therefore where the wellbore encountered these fractures. Since these zones correlate well with the crack density geobodies, it can be assumed that these geobodies give some idea of the fracturing in this reservoir. Figure 9 displays a view from the north showing the distribution of the crack density geobodies in the Pinedale Anticline. It suggests that the bulk of the fractured zones occur to the west (right) of the crest of the anticline. Recent drilling in this area has produced some of the best producing wells on the anticline to date (e.g. Gray et al, 2003). The bulk of the earlier wells were drilled on the crest of the anticline, none of which have produced as well as recent wells. Completion techniques contribute to this, but these results suggest that the area just to the west of the crest may be preferentially fractured. This is the steeper dipping side of this asymmetric anticline with a fault to the western side petering out to the north, all suggesting that this is an area of significant stress. This would account for the increase in the number and intensity of the crack density anomalies in this area.
Recently it has become possible to incorporate AVAZ attributes into reservoir characterization (Gray et al, 2003). This innovation is extremely important because it allows for better determination of fracture information between the wells and thus a better understanding of fluid flow in the reservoir. Historically, fractured reservoir characterization has been done with well information and indirect measures of fracturing between the wells, such as curvature, distance from faults and lithology. The seismic AVAZ results provide a direct measurement of the effects of fractures between the wells. However, these results have been difficult to tie to well control in the past due to the paucity of direct fracture indications at the wells. Because of this limited well control it is difficult to relate the seismic anisotropy measurements to the fractures.
Boerner et al (2003) use neural network reservoir characterization (Ouenes and Hartley, 2000) to predict production in the Pinedale Anticline Reservoir, incorporating the AVAZ attributes with those mentioned above.
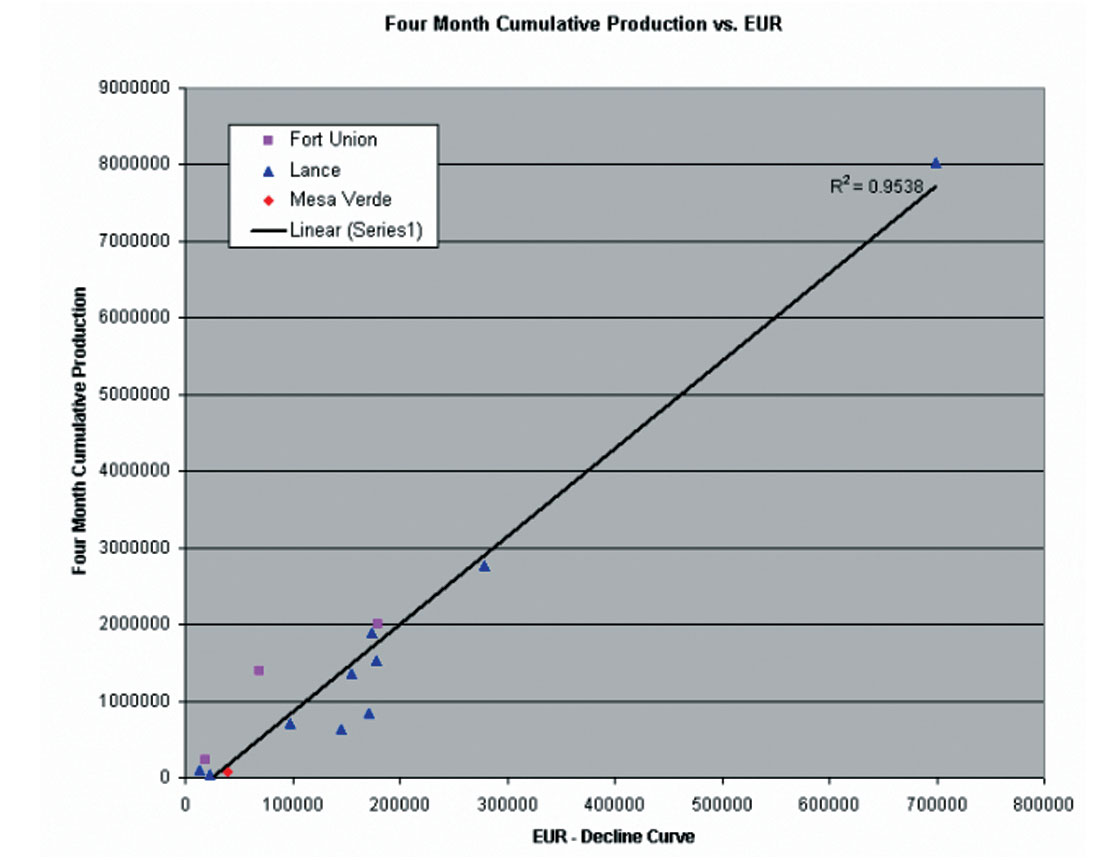
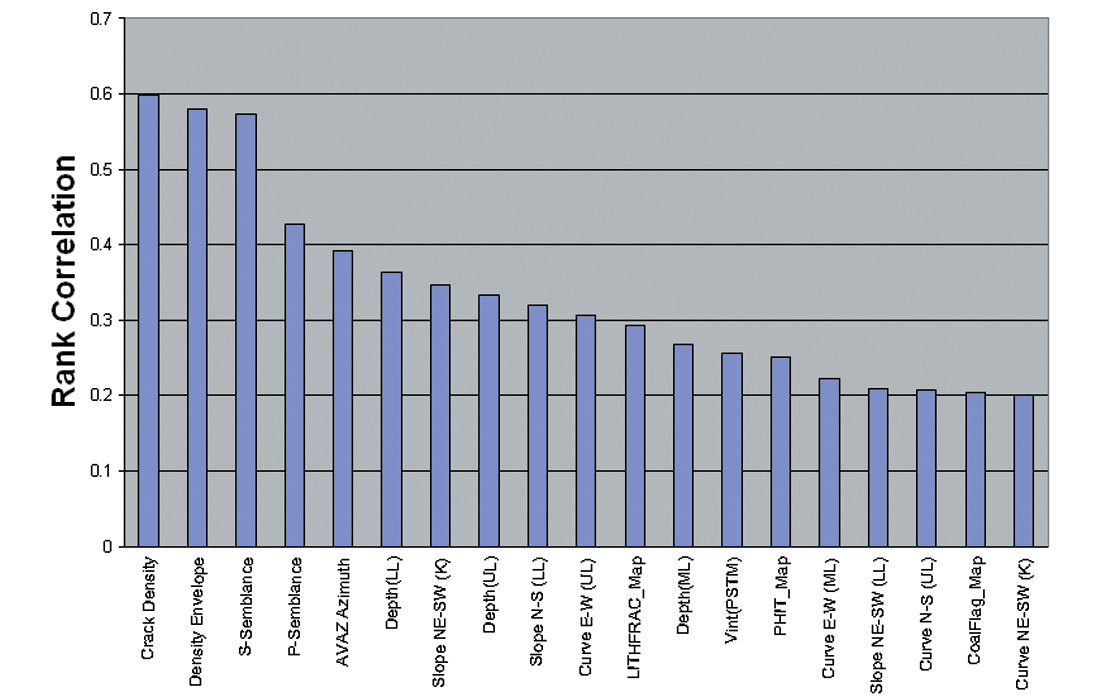
The neural network is used by first identifying a fracture indicator (FI) and then ranking the variety of inputs that the geoscientists and engineers familiar with the field suggest may have influence on it. For the Pinedale Anticline Field, four-month cumulative production is chosen as the fracture indicator. This is the best indicator of fractures in this field due to the scarcity of good well information on the fractures, and limited production from the recent, better wells. The field has very few long-term producers since it has only recently been revitalized by the aforementioned new completion techniques and the clearance of some environmental issues. This FI correlates to Expected Ultimate Recoverable (EUR,) a measure that is often used as a fracture indicator (Figure 10). It also has the advantage that it allows for the prediction of early production from a well. The AVAZ and other seismic attributes are used as inputs to the neural network’s ranking process along with geologic models of porosity, net-to-gross, and coal and the structural interpretation. The geologic information was derived from the analysis and interpretation of wells available in the public domain and from interpretation of CGGVeritas’ Pinedale 3D speculative seismic survey. The rankings of the most important of the inputs to the neural network in predicting the FI are shown in Figure 11. The AVAZ crack density and its envelope (Todorovic-Marinic et al, 2003) are the most important attributes in these rankings. They are even more important than the next best ranked attributes, the semblances, a measure of signal discontinuity, which are commonly used for fracture detection. Additionally, it should be noted that typical geologic indicators like slope and curvature are only ranked 7th and 10th, with only about half the rank correlation coefficient of the aforementioned seismic indicators. This strongly indicates that the seismic AVAZ analysis is adding important new information to the understanding of production in this reservoir.
On the basis of the best ranked of these attributes, multiple realizations of the FI are generated by the neural network. Realizations were created both with and without the AVAZ attributes, with all other attributes remaining the same.
Based on the fractured reservoir characterization, including the AVAZ results, we predicted in July 2002 that Ultra Petroleum’s Riverside 4-10 well, then being drilled, would be among the best producers from the Pinedale Anticline Field (Gray et al, 2003). An FI showing 4-month cumulative gas production of 560 MMCF (Figure 12c) was predicted. Using the attributes traditionally used to identify fractures in this reservoir, the FI prediction indicates that Riverside 4-10 should only produce only 2 MMCF in 4 months (Figure 12a). Riverside 4-10 had initial production (IP) of 13.6 MMCF and in its first four months of production, produced 461 MMCF of gas (WOGCC Riverside 4- 10, 2004). The best well in the field to date is Riverside 1-4 that produced 699 MMCF in its first four months of production (WOGCC, Riverside 1-4, 2004). Thus the production fro m Riverside 4-10 confirms the neural network prediction incorporating AVAZ showing that this would be one of the best wells in the field. Also, the FI derived using AVAZ (Figure 12c) suggests that the high FI indicated at Riverside 4-10 may continue to the north to the best wells, including Riverside 1-4 just outside our study area. This also suggests that the use of AVAZ allows for a more accurate prediction of production.
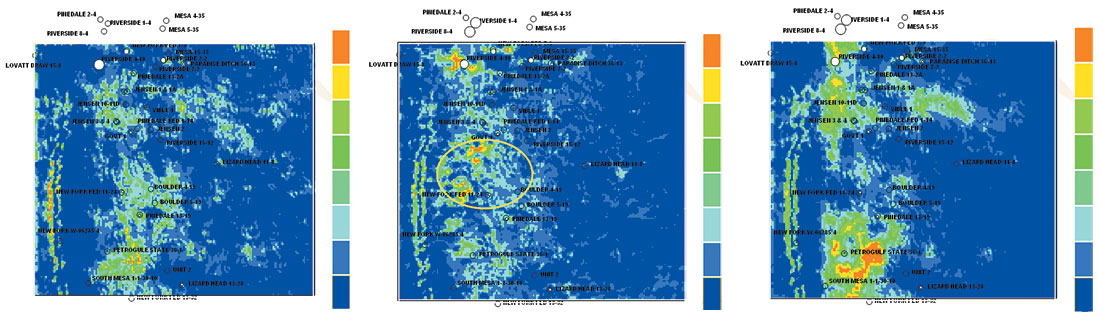
The reason the reservoir characterization without AVAZ did not predict the production at Riverside 4-10 can easily be understood. Since this is a relatively new field, it is undersampled by the wells. Most of the wells drilled to date have been drilled on the top of the anticline. It turns out that most of the wells previously drilled on the flanks of the anticline have been relatively unsuccessful. Therefore, in any statistical analysis there is a bias towards wells on the top of the structure because all previous successful wells have been structurally high. As a result, depth attributes are relatively important in the rankings (Figure 11). Riverside 4-10 is located down the flank of the anticline between its top and the fault on its western limb. This is the area that the AVAZ analysis has identified as being more highly fractured. Incorporation of the production from this well shifts the major production to the west between the top of the anticline and the western fault (Figure 12b). Through the incorporation of the AVAZ crack density attribute, which is high in the region where this well has been drilled, the neural network has been able to extrapolate the successes on the top of the structure down-flank to where this well has been drilled (Figs. 13 and 14).

AVAZ as a fracture indicator
Based on these and other comparisons of AVAZ results to geologic indications of fractures (e.g. Gray et al, 2002), it seems that the seismic AVAZ attributes do reflect the fracturing as understood from geologic studies of the same rocks and formations. In addition, the AVAZ attributes seem to provide important information on the distribution of fractures between the well locations. This information can be used to understand the reservoir, as at Manderson, and to help to predict production prior to drilling new wells, as at Pinedale.
How can Geologists use AVAZ?
It has been shown that AVAZ technology can add significant new information to the understanding of fractured reservoirs, but it is not the “be-all and end-all”. There are significant issues and assumptions that need to be addressed. First, the AVAZ attributes are indications of the change in crack density and the overlying layer is seismically azimuthally isotropic, which it frequently will be if it forms a seal. Geologists can help with the understanding of whether or not this assumption and the other assumptions used in AVAZ are reasonable for a given reservoir. One important issue in seismic fracture analysis is that there is an ambiguity in the AVAZ equation (Zheng et al, 2004). This can be expressed as either a 90º ambiguity in the fracture strike or as a sign ambiguity in the value of the change in the crack density. In order to resolve this ambiguity additional information is required. For example, Zheng et al (2004) used information on the fracture strike from FMI logs to determine the correct orientation of the fractures in the reservoir in the Narraway Anticline. Oriented core analyses, e.g. at Manderson Field, can resolve the fracture strike ambiguity. Knowledge of where the reservoir lies within the seismic and where the fractures start or end within the reservoir can resolve the sign ambiguity in the crack density.

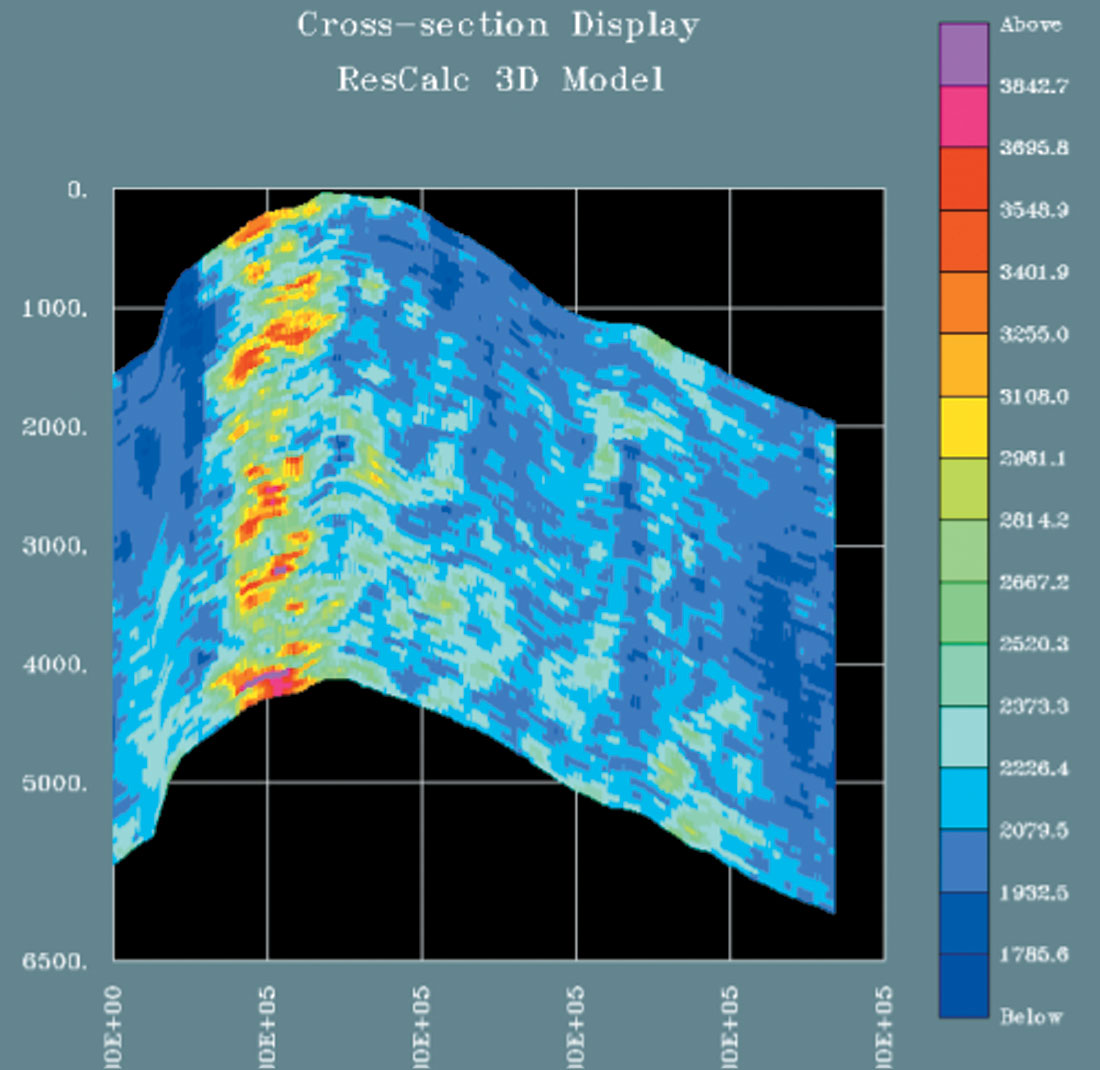
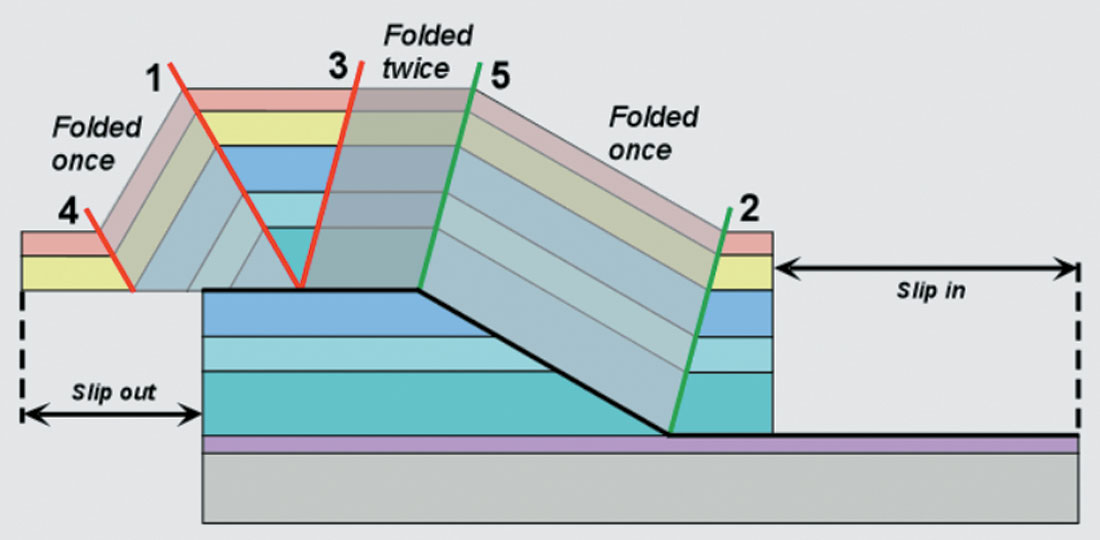
Structural geologists should be involved in the interpretation of AVAZ results. For example, the Narraway Anticline shows significant AVAZ anomalies on the backlimb of the thrust sheet (Figure 15). Drilling on the leading edge of this thrust sheet has generated wells that initially produced 2-3 MMCF/D. However, interpretation of the AVAZ anomalies on the backlimb shows that they correlate with the better producers in the field, with initial production from those wells that intersect the anomalies being an order of magnitude higher than those that don’t (Todorovic-Marinic et al, 2004). Upon observation of these results, Lacazette (2004a) presented a structural model, shown in Figure 16, that offers a possible explanation for the increased fracturing observed on the backlimb in the AVAZ attribute (Lacazette, 2004b). This model suggests that there were two episodes of fracturing during the evolution of this structure which thereby reveals why more fracturing might be expected on the backlimb as is indeed observed. Further study is required to confirm this model and then to indicate why these fractured zones seem to occur in pods along the strike of the structure.
Conclusions
Examples have been shown to demonstrate that crack density and fracture strike estimated using seismic AVAZ correlates with known fracture indicators. The AVAZ results are consistent with core, outcrop, production, well logs and structural interpretations. Because the AVAZ records this fracture information between the wells, it adds significant information to the interpretation of fractured reservoirs that cannot be easily obtained in other ways. This information is not perfect and so should not be used alone but should be included in the structural interpretation of the reservoir.


Join the Conversation
Interested in starting, or contributing to a conversation about an article or issue of the RECORDER? Join our CSEG LinkedIn Group.
Share This Article