Understanding the local structural styles and sedimentary sequence is key to constraining depth-migration velocity models in structured onshore seismic data. Judicious application of geologic constraints in the model building resulted in compelling imaging improvements on 2D seismic in this structurally complex area.
Introduction
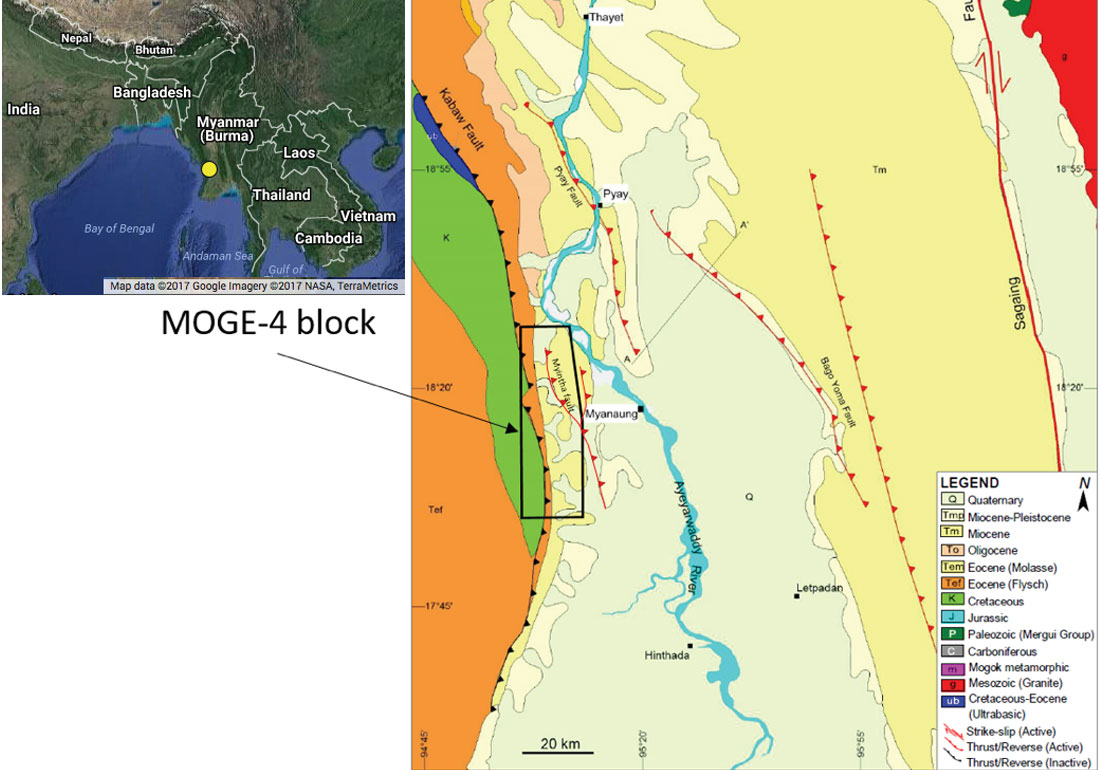
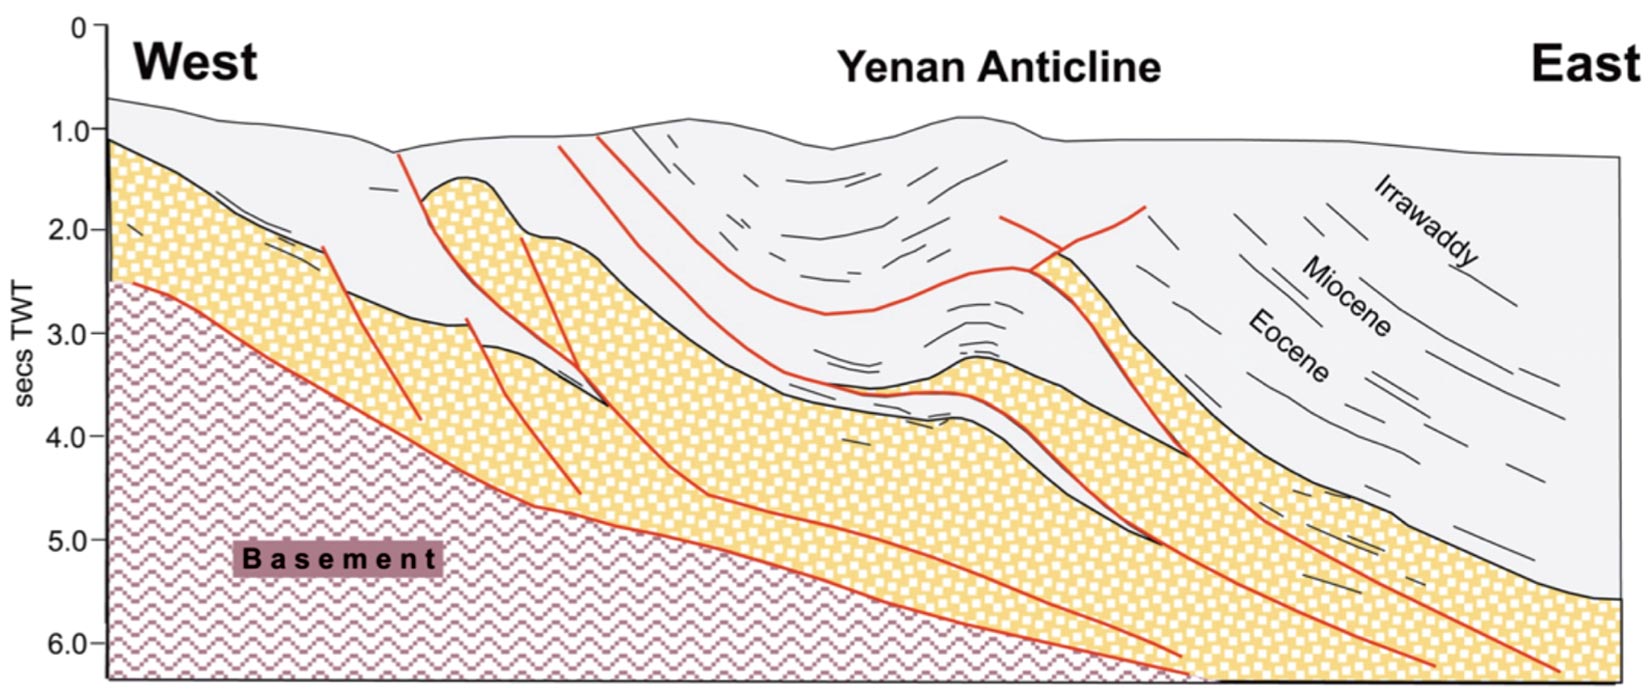
The exploration setting is along the foothills of the Indo-Burma Range. The tectonic history is complex, resulting in an extensive thrust and fold belt trending N20W to N40W (Bertrand and Rangin, 2003; Ridd and Racey, 2015). The exploration block is onshore Block MOGE4, which lies next to the now suspended Htantabin gas and condensate field (Figure 1). The main objective is the Pyawbwe limestone, which is the reservoir in the Htantabin field. Transpressional tectonics of the region results in west-verging thrust faults across this block, as shown in Figure 2.
As a result of the regional structural complexity, the seismic data are affected by seismic anisotropy and velocity heterogeneity that arise from the faulting and steep folds in the near surface. Concerns about the seismic image quality and the accuracy of the position of the subsurface reflectors led the exploration team to test various velocity models and anisotropic prestack depth migration on these data. The final geologically constrained velocity model resulted in seismic images that showed more structural detail below the structurally complex near-surface.
Method
We used the structural cross sections as a guide to interpret the subsurface velocity model. As shown in the workflow below, the two inputs at the top are the structural interpretation and the time-processed, unmigrated gathers. The methodology followed the interpretive model-building process outlined by Vestrum et al. (2009), and shown in the workflow of Figure 3.
The inputs to the workflow in Figure 3 were the interpreted structural model and the seismic image gathers from time processing. After we migrated the gathers using the interpreted velocity model, the following tough questions were asked of the migrated output: Have we optimized the seismic imaging? How does the image compare to the time migration? Do the depths of the seismic reflectors tie to the depths of the well tops? Initially, the answers to these questions were mostly “No”. So, we modified the velocity model, iterated clockwise around the workflow (see Figure 3), tested various velocity-model scenarios until we could answer “Yes” to most or all of the questions above.
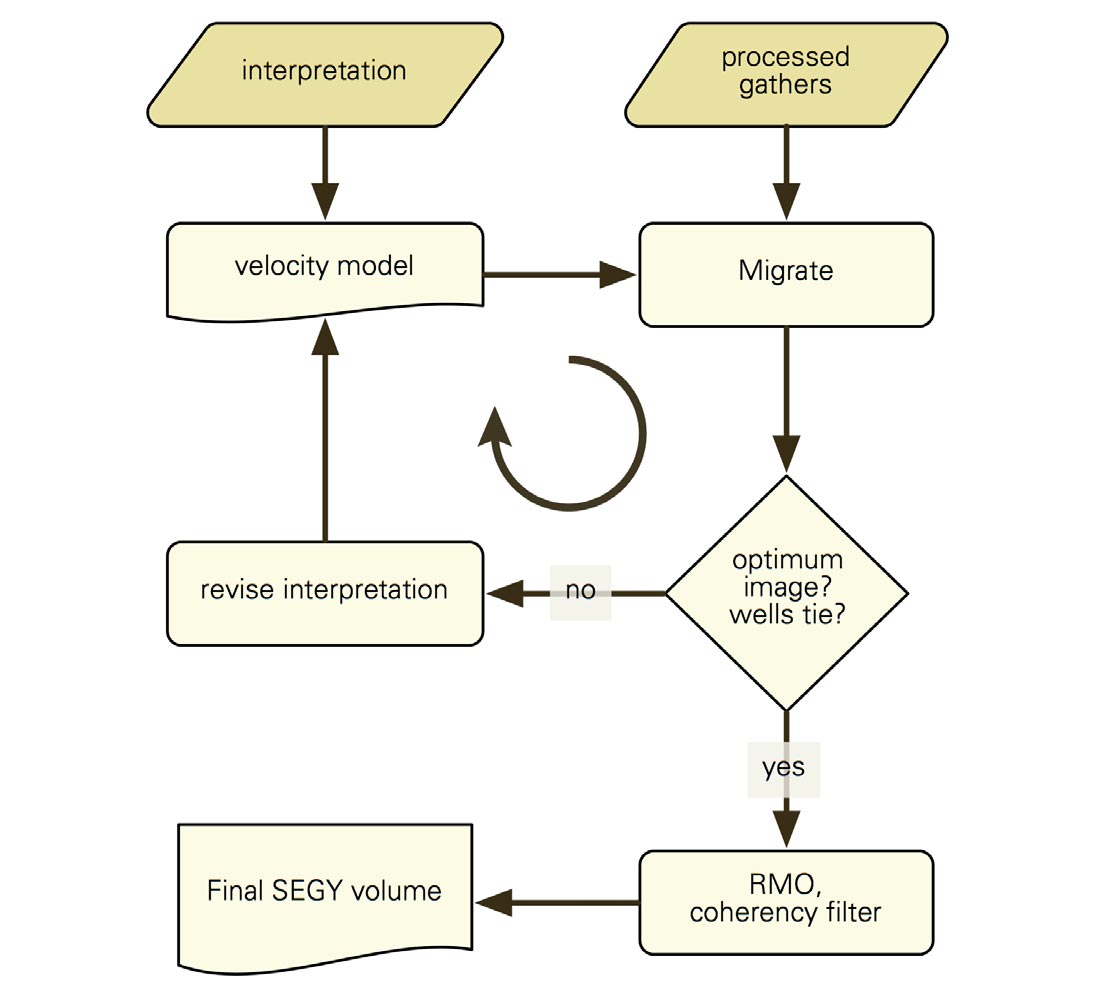
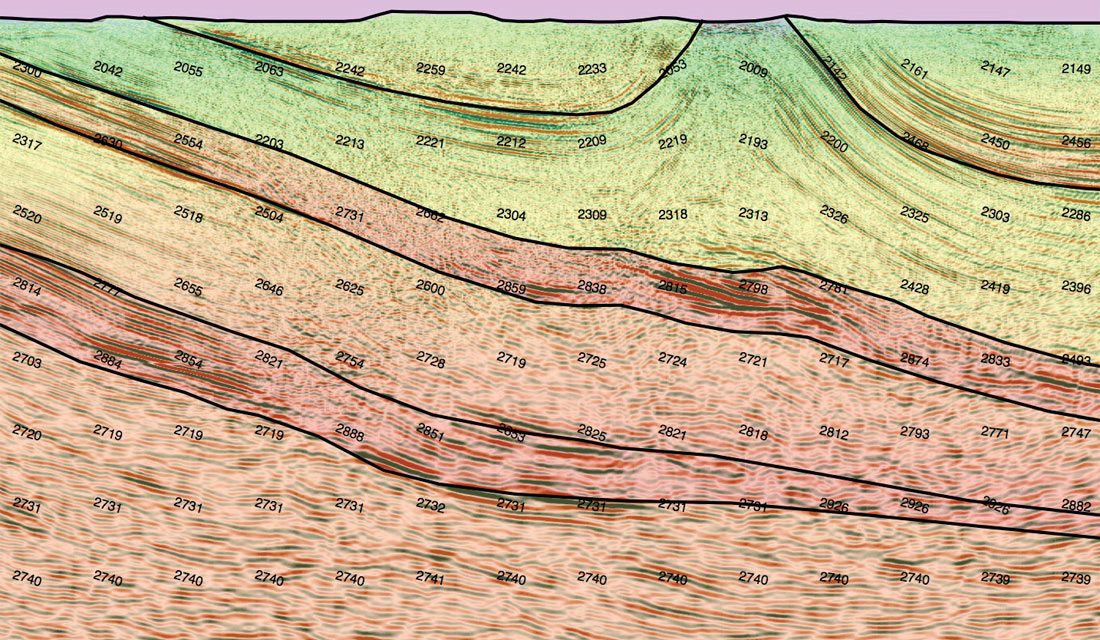
In this project, we iterated through a dozen velocity models, testing thicknesses and velocity variations of high-velocity layers above and below the fault. Seismic velocity diagnostics and iterative model updates helped us refine the velocities within the structural model to create the velocity model shown in Figure 4.

Results
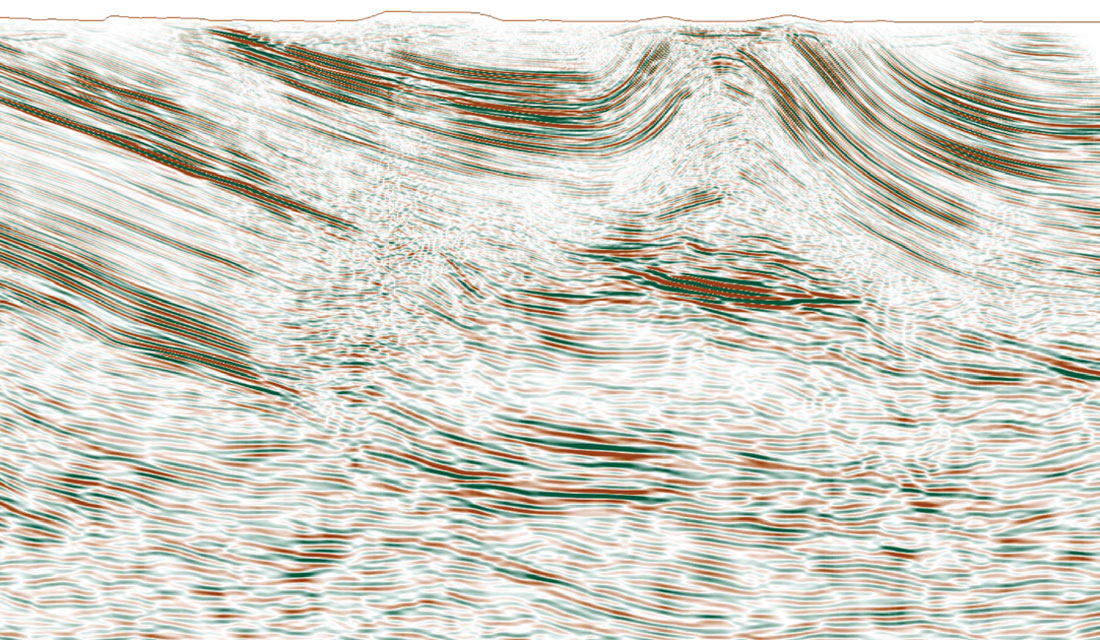
Figure 5 shows the PSTM image of Line 8, the 2D seismic line displayed in Figure 4. Note that the time-migrated image shows steep dips in the shallow section in addition to the major subthrust features. Figure 6 shows the PSDM that resulted from the velocity model in Figure 4. Note that the steep dips in the shallow section image more clearly. There is additional structural detail below the thrust, including an image of a fault-plane reflector.

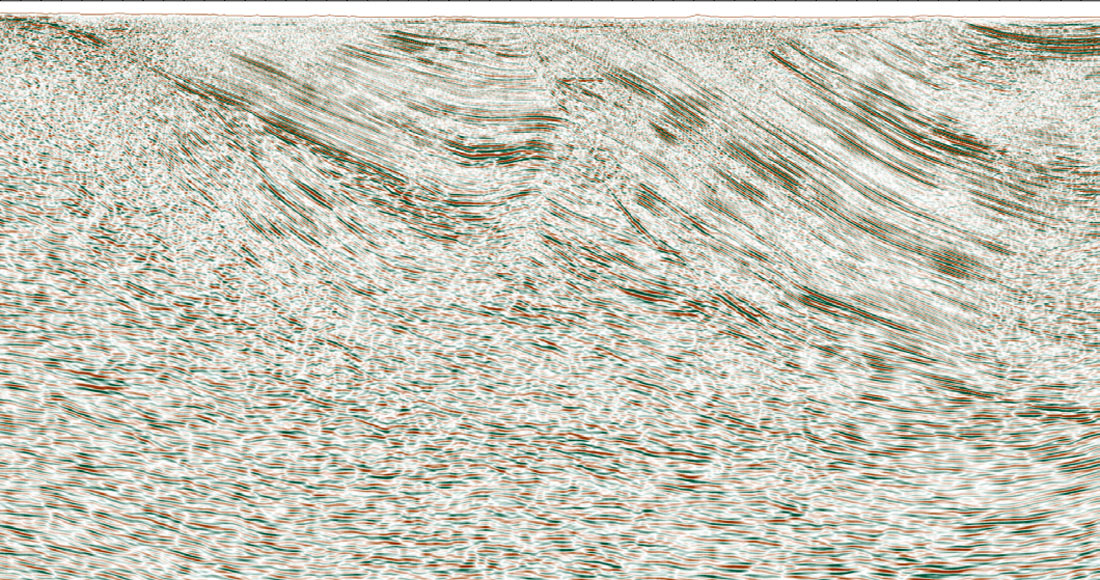
Figure 7 shows the preliminary velocity model for Line 12, where the structure outcrops at surface, showing stronger lateral-velocity contrast shallower in the section. After five additional iterations through the model-building workflow described above and illustrated in Figure 3, we refined the velocity model with input from the migrated gathers and evaluation of stack coherency. We arrived at the final velocity model for this line, which is shown in Figure 8. Comparing time (Figure 9) and depth (Figure 10) images reveals more dramatic improvements in imaging in both shallow sections and at depth near the basement than we observed for Line 8, which had more gentle velocity contrasts (Figures 4 to 6).

Not all seismic images show this level of imaging improvement between time and depth imaging. There were 11 2D dip lines and two 2D strike lines in this area. Of the thirteen lines, three dip lines achieved dramatic imaging improvements. Six dip lines showed more subtle improvements in imaging and position accuracy. The other two dip lines had similar imaging between time and depth versions. The strike lines showed some degradation during depth imaging as compared to the time migration, as the averaging involved in PSTM was better able to compensate for out-of-plane energy than the PSDM.

The interpretation team was pleased with the imaging results of this limestone sequence in the block, particularly the bright, focused amplitudes on the subthrust on the PSDM. A notable improvement was also found in the imaging of the Okhmintaung sandstones. Imaging of steep dips and thrust faults is obviously one of the main achievements of this PSDM processing, as this helps constrain the structural interpretation.
Conclusions
Seismic data from complex-structure land areas have high noise, low signal, and high structural complexity. The geologically constrained method for building a velocity model for depth imaging developed for use in complex-structure land areas worked well to optimize the seismic imaging of 2D seismic lines in the Central Burma Basin, onshore Myanmar. The resulting seismic images showed structural details that traditional time-processing methods could not fully image.


Join the Conversation
Interested in starting, or contributing to a conversation about an article or issue of the RECORDER? Join our CSEG LinkedIn Group.
Share This Article