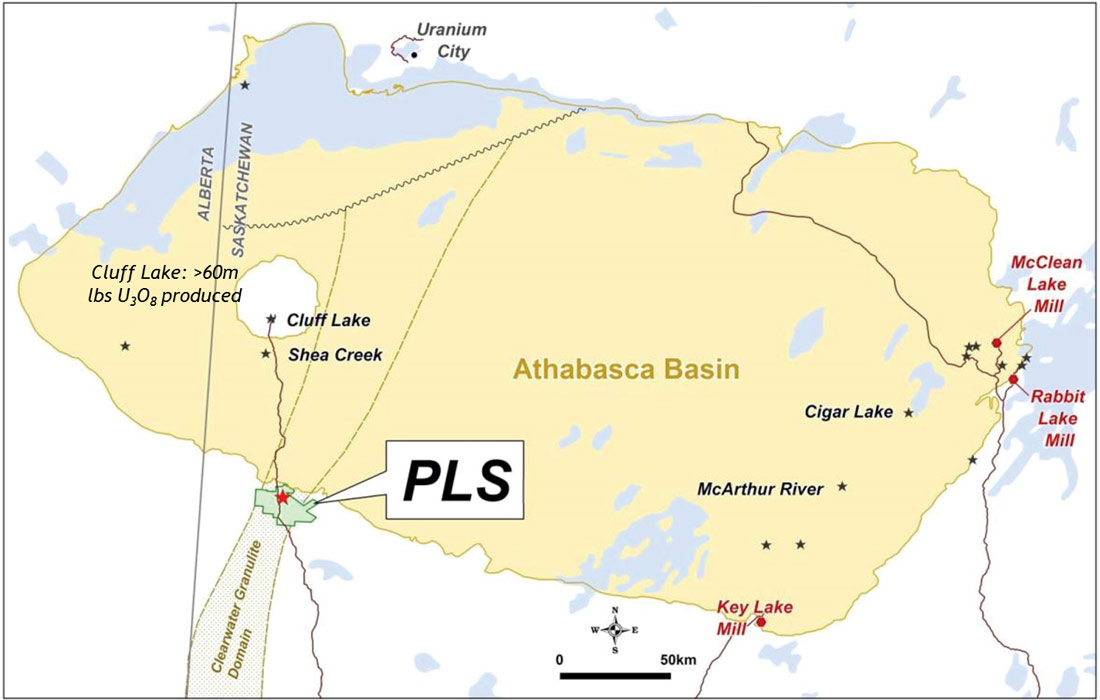
The Triple R deposit on Fission Uranium Corporation’s Patterson Lake South (PLS) property is located in Canada’s Athabasca Basin, home to the world’s richest uranium mines. The deposit is accessible by all-weather Highway 955 which continues north to the UEX-AREVA Shea Creek deposit and former AREVA Cluff Lake uranium mine (Figure 1). It is the only major, high-grade deposit in the region that is potentially open-pittable and is the largest mineralized trend in the region – currently standing at over 3 km in length. Growth is driven by a highly skilled, award-winning technical team and successful entrepreneurial management. Fission has 100% ownership of the PLS Property, which comprises 17 claims totaling 31,039 ha.
The PLS discovery has been previously documented and some content is borrowed from these presentations: 2012 Saskatoon Geological Open House, 2013 Saskatoon Geological Open House and the Fission Web Site http://www.fissionuranium.com.
Athabasca Deposit Geophysical Character
The Athabasca Basin major uranium deposits and mines (Figure 2) are generally proximal to graphitic conductors (reducing environment) and accompanied by an alteration ‘halo’ which is usually a resistive low, but can also be silicified (resistivity high). The sandstone environment is normally highly resistive which makes things ideal for EM detection of weaker graphitic conductors at depth.
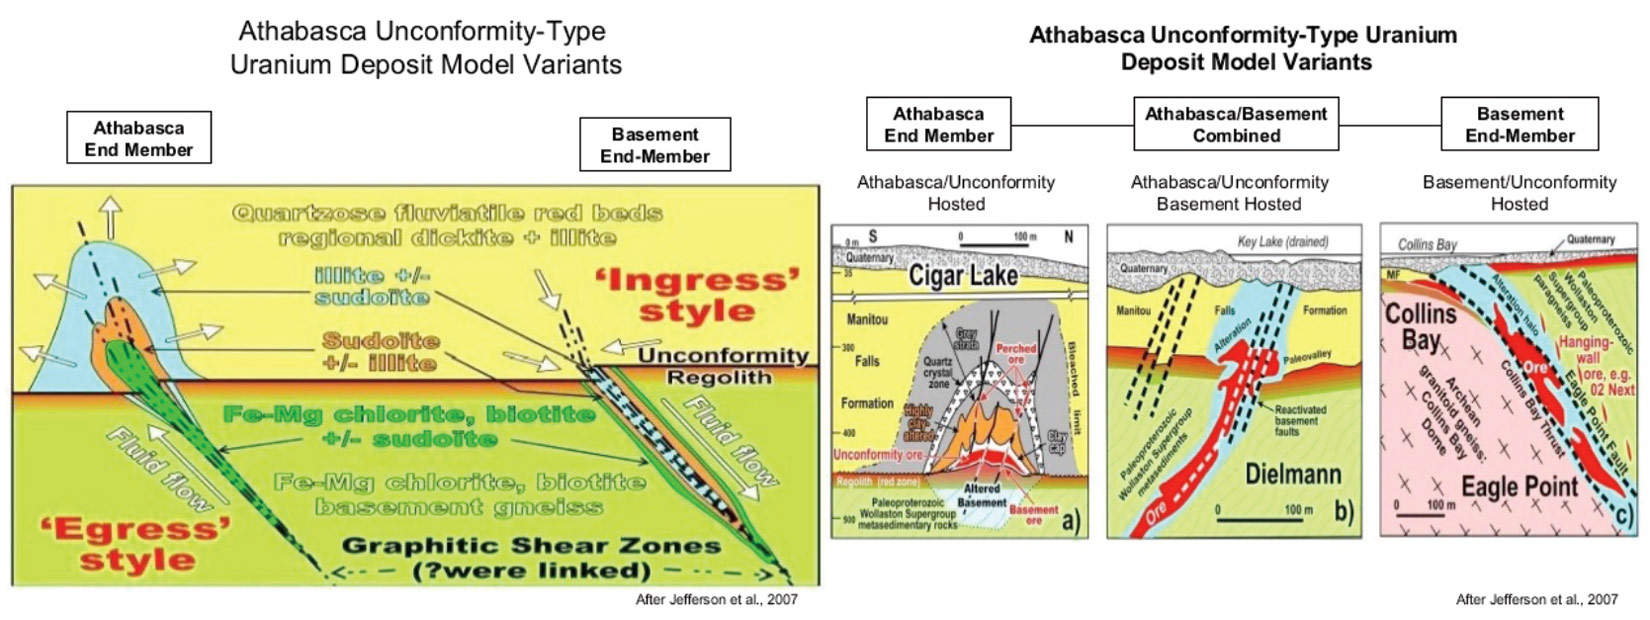
The east side of the Athabasca Basin hosts virtually all the major high grade deposits with the exception of Cluff Lake and the deep Shea Creek deposits and now the new deposits in the Patterson Lake Corridor. Cluff Lake is an anomalous occurrence and is located on the Carswell Dome, not within the Athabasca Basin. Exploring outside of the basin margins is somewhat unconventional as there is no present unconformity surface, but there may have been in geological history. The Millennium and Roughrider deposits showed the basement is not to be ignored.
Events Leading to Discovery
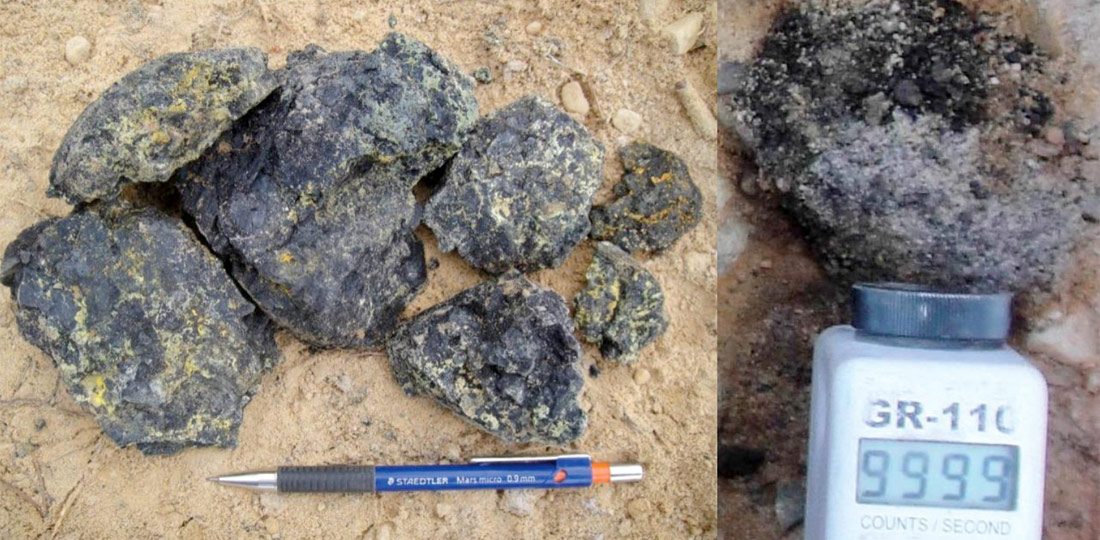
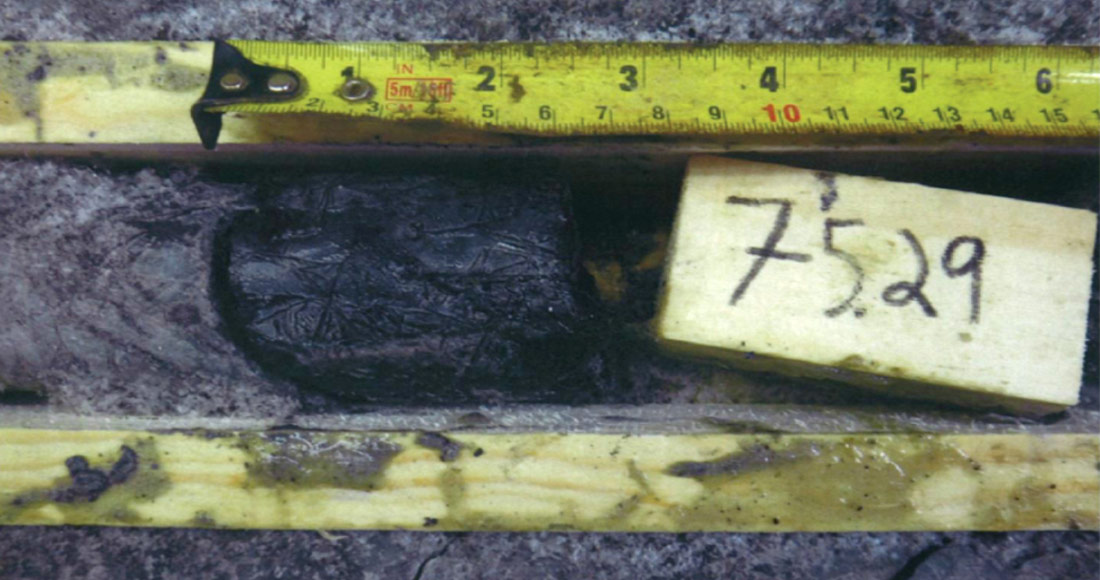
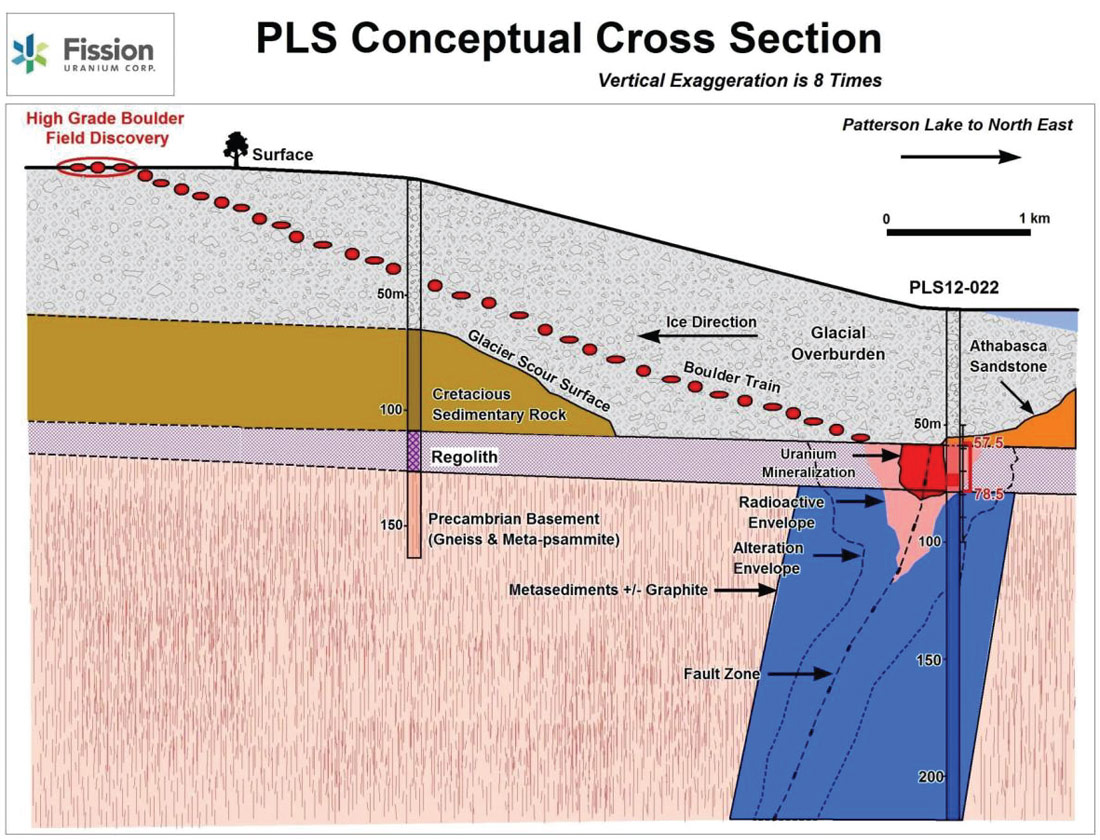
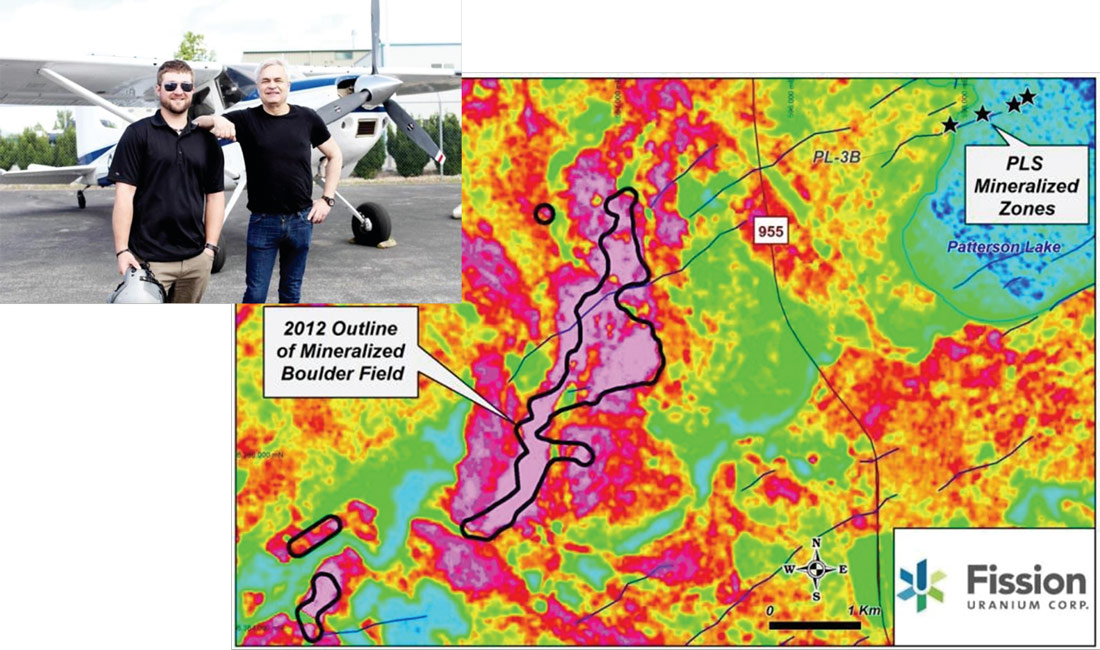
The initial phase of work leading to the discovery consisted of research. A review of historical assessment reports (late 1970s) showed strong radon anomalies coincident with EM conductors 3 to 4 km west of the deposit. A subsequent airborne radiometric and magnetic survey was instrumental in focussing ground prospecting for radioactive boulders. Follow-up prospecting and trenching with Quaternary geological analysis developed a conceptual section for potential mineralization (Figure 5). The conceptual section was invaluable in planning further work and selecting targets. Airborne and ground geophysical surveys identified a number of prospective target areas, and drill testing resulted in the massive pitchblende discovery in November 2012 (Figures 3 and 4).
2009-2012 Airborne Geophysics
Airborne geophysics consisted of an initial property wide radiometric and magnetic survey. The 2009 airborne radiometric survey was instrumental in locating the boulder field. Some innovative proprietary focussed crystal arrays were used on a small fixed wing aircraft. A low level tight drape flight pattern at 50 m line spacings was used for extremely detailed coverage. The survey was carried out by Special Projects Inc., of Calgary, AB.
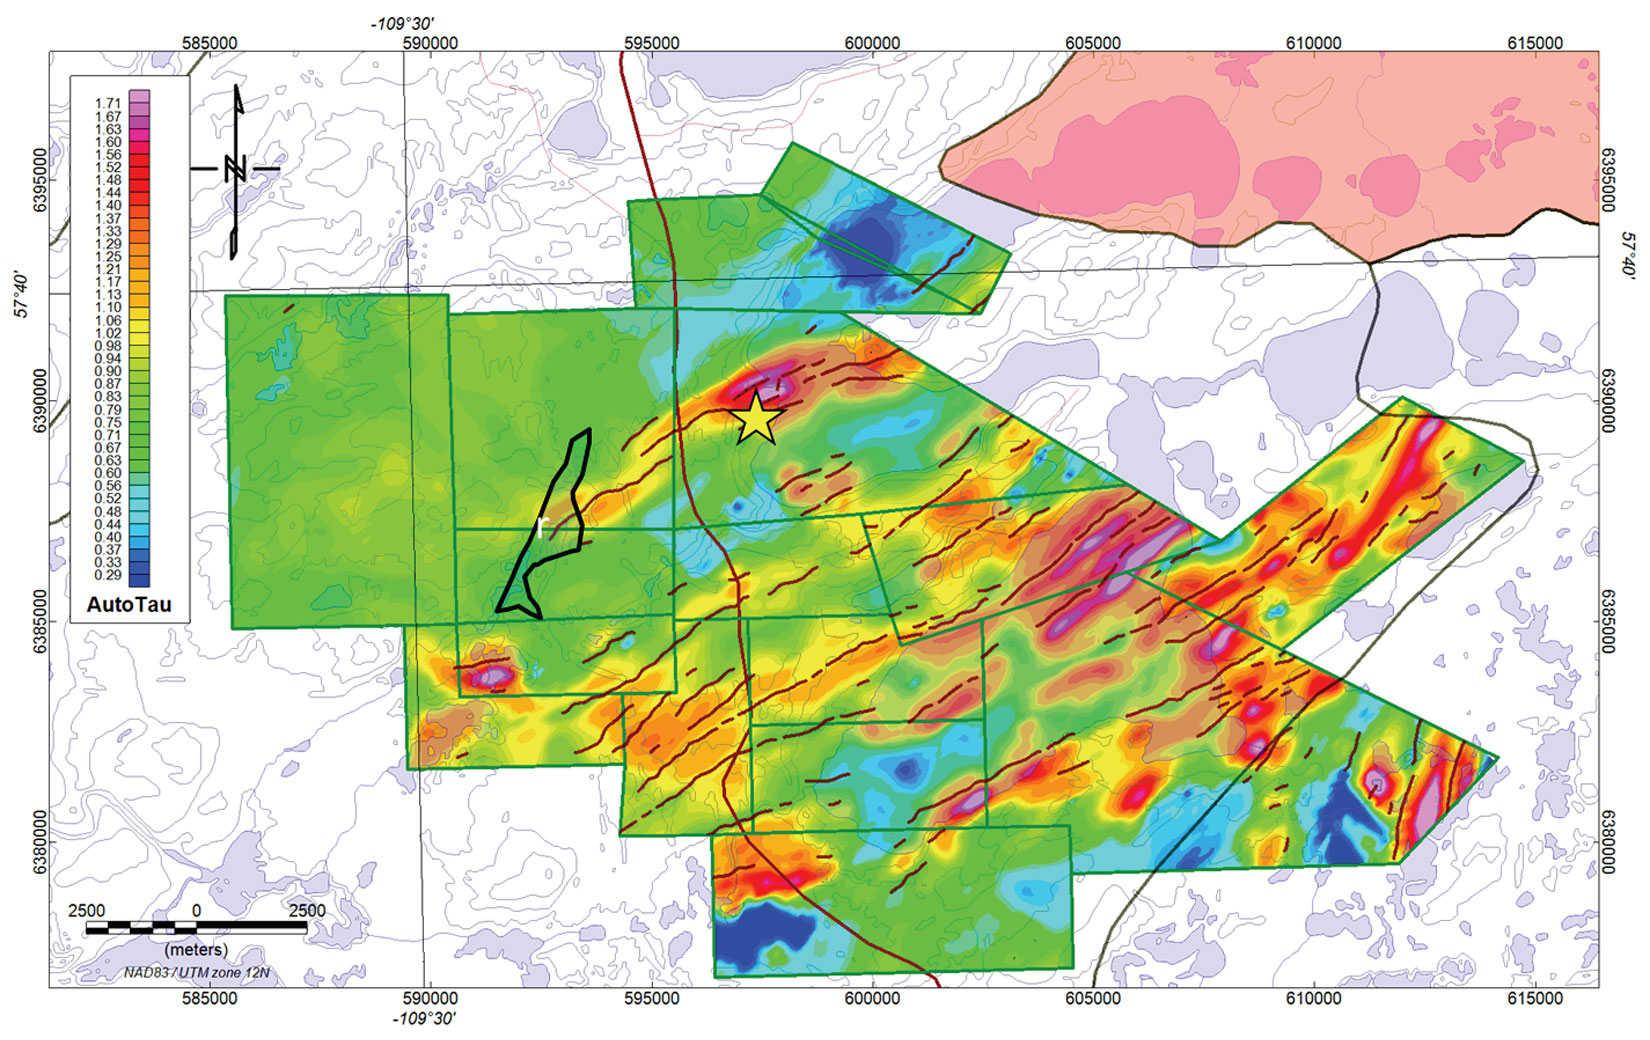
Initial surveys were MaxMin Horizontal Loop. Some of the MaxMin profiles encountered a ‘conductive overburden’ response masking bedrock features, so a property-wide VTEM™ (Versatile Time Domain Electromagnetic) survey was conducted in 2012 and successfully outlined numerous conductors throughout the property. The calculated conductivity was used as an initial indicator in defining priority drill targets. The conductivity is based on the VTEM decay of the Z (vertical) component. The Z component is used for this calculation as it is the stronger and cleaner response. The conductivity peaks do not appear at the location of sub-vertical conductors but are on the shoulder of the Z component response. Of considerable interest was the conductive ‘bright spot’ in an up-ice direction from the radioactive boulder train along a complex PLS main conductor trend.
2011 – 2012 Ground Geophysics
The initial interpretation of the airborne VTEM encountered complex multiple sub-vertical conductors which were poorly resolved with the in-loop geometry of the VTEM EM system. There was also some difficulty correctly spotting drill targets over the complex areas. Further ground geophysics prior to discovery and during delineation consisted of DC (Direct Current) Resistivity and EM surveys.
DC Resistivity
In the Athabasca, mineralization is typically accompanied by a conductor and an alteration halo observed as a resistivity low in the lower sandstone. In the absence of the sandstone layer, the alteration takes on a different character consisting of a widening and /or increases in intensity of the basement resistivity.
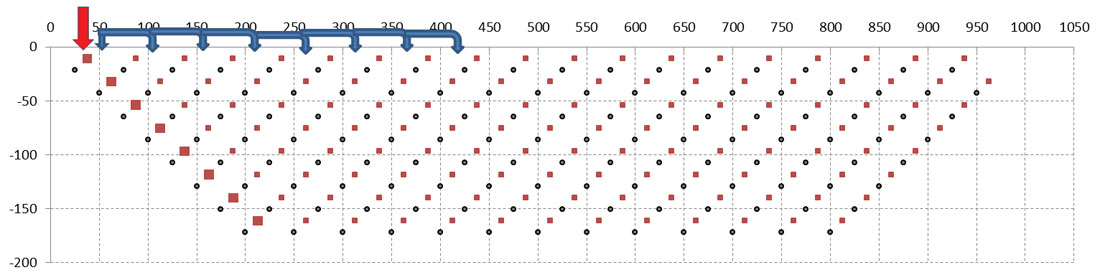
In the Athabasca area, the very high input resistance of the sandstone section results in poor currents and poor to marginal chargeability measurements. Personal experience of limited studies in other areas has shown no correlation of chargeability and mineralization. A modified pole-dipole resistivity array used resulted in better resolution and improved data quality. For an enhanced array (Figure 8), the current electrodes are moved along the profile at ½ of the “a-spacing” used to double the data density at almost no extra cost. This results in an excellent spatial sampling of data along the line. The high density data of the enhanced array both increases the resolution and improves data quality. The X2IPI toolbox is efficient and smartly removes current and potential electrode noise.
Inversion has become a necessity for IP (induced polarization) / resistivity arrays. It compensates for and removes geometrical effects such as “pant-leg” type responses and enables a more direct geological correlation of the resistivity data and the geology by distinguishing the source of any anomalies (i.e. deep or shallow). Resistivity / IP arrays are as sensitive to offline sources as they are to sources at an equivalent depth. An effective and economical way to overcome this drawback is to collect data in 2D, but invert in 3D.
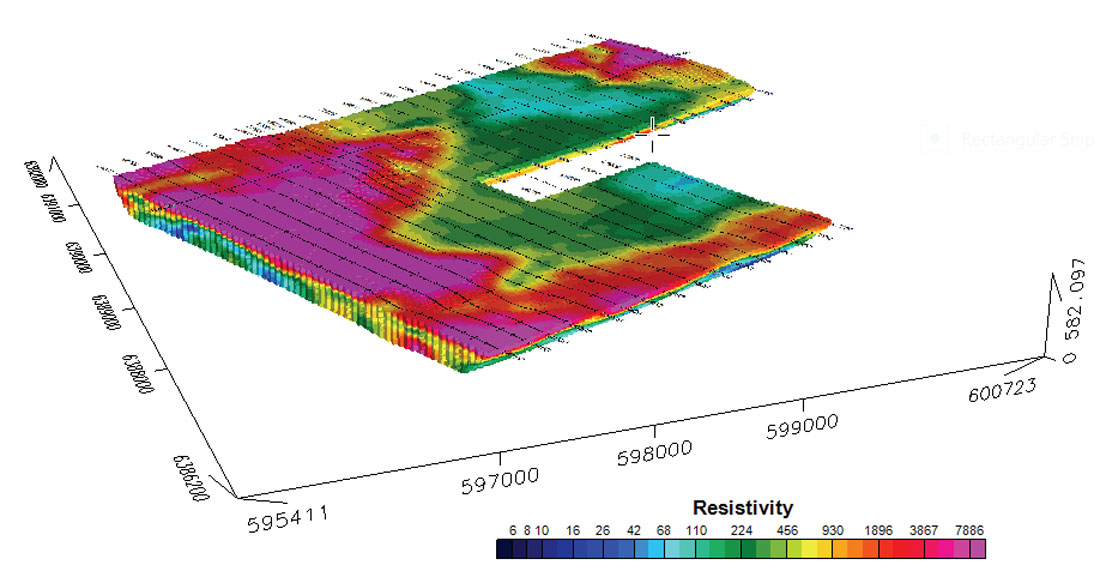
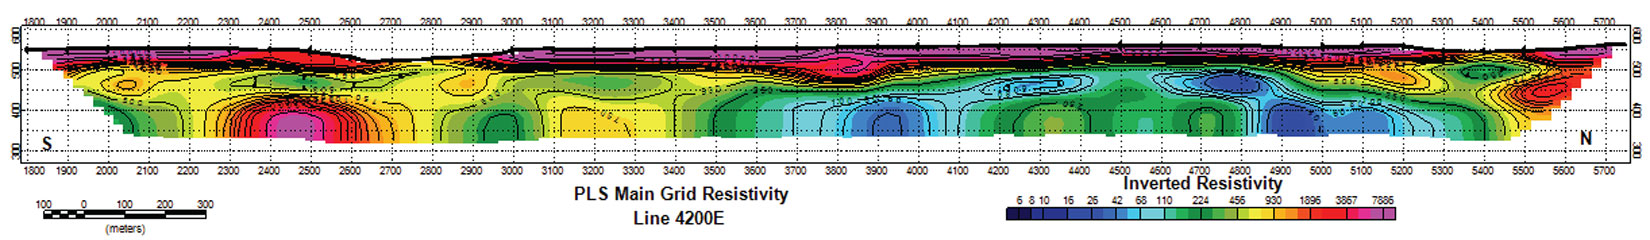
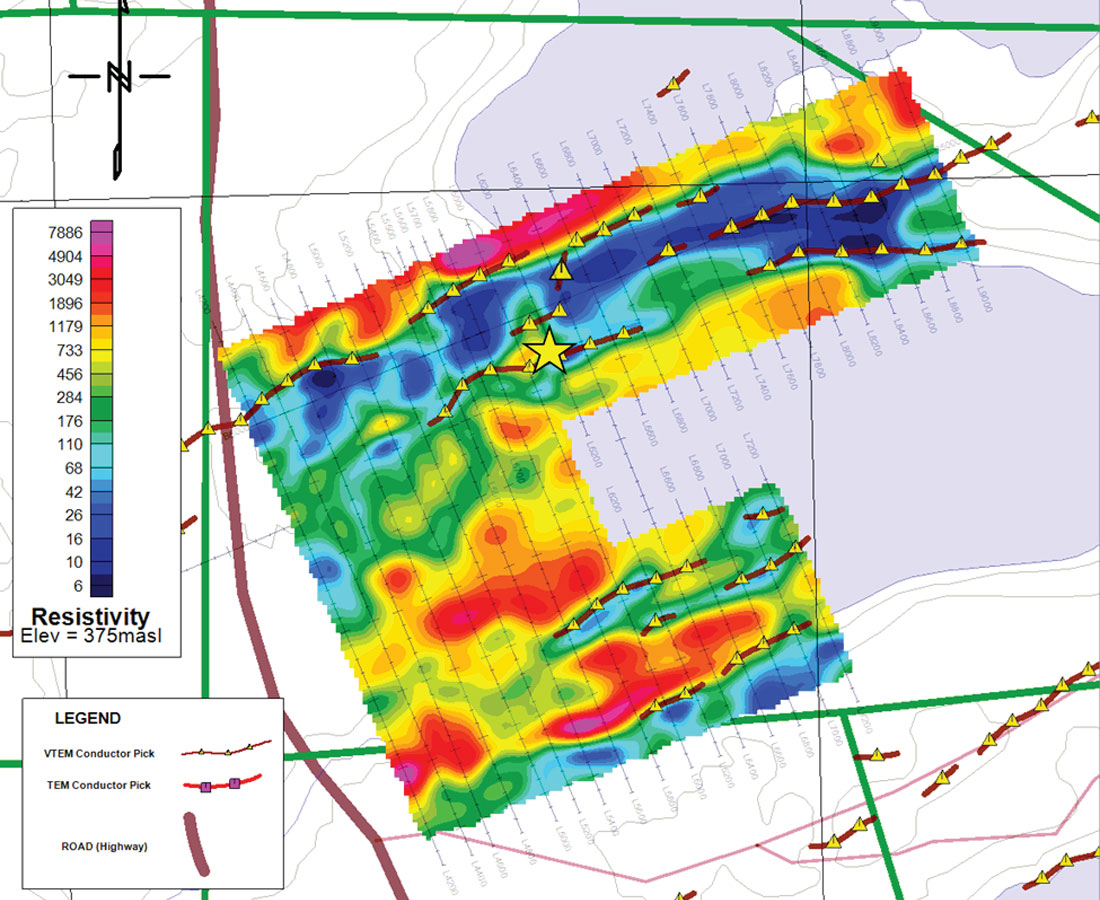
The inverted resistivity (Figures 9 and 10) has a very large dynamic range from 1 to 30,000 ohm-meters. A logarithmically spaced color bar was used from 5 to 10,000 ohm-m. A deeper plan level was used to display the basement resistivity to avoid the till effects. (Figure 11). The basement resistivity showed a relatively wide conductive trend with numerous resistivity low ‘bright spots’.
Analysis of the resistivity sections shows horizontal layers in the till which correspond to the Cretaceous conductive sediments. By taking a bench above the basement, and masking the high resistivity, the Cretaceous conductive sediments can be mapped with the resistivity (Figure 12). However, there is some contamination from the lake (fluids?). The conductive till mapped by the resistivity appears intermittent, but seemed to become much more apparent when another surveyed area was added in late 2012.
Ground EM Surveys
Initial MaxMin encountered some difficulty seeing through conductive Cretaceous sediments, and it was difficult to accurately locate complex conductors with the in-loop geometry of the VTEM survey. Instead, a Small Moving Loop EM design was used with a 20 m square multiple turn loop. A Super-conducting Quantum Interference Device (SQUID) sensor was used with a Slingram separation of 150 m at a frequency of 10 Hz. The low frequency enabled easy penetration through the conductive Cretaceous till. The increased sensitivity allowed for smaller TX (transmitter) loops (small loops = small crew = lower cost). Figure 13 shows a comparison of the MaxMin and TEM (Transient Electromagnetic) Small Moving Loop responses. Note the mineralized conductor is masked in the MaxMin response, but clearly visible in the small moving loop.
All the ground EM profiles were interpreted with Maxwell (www.electromag.com.au).
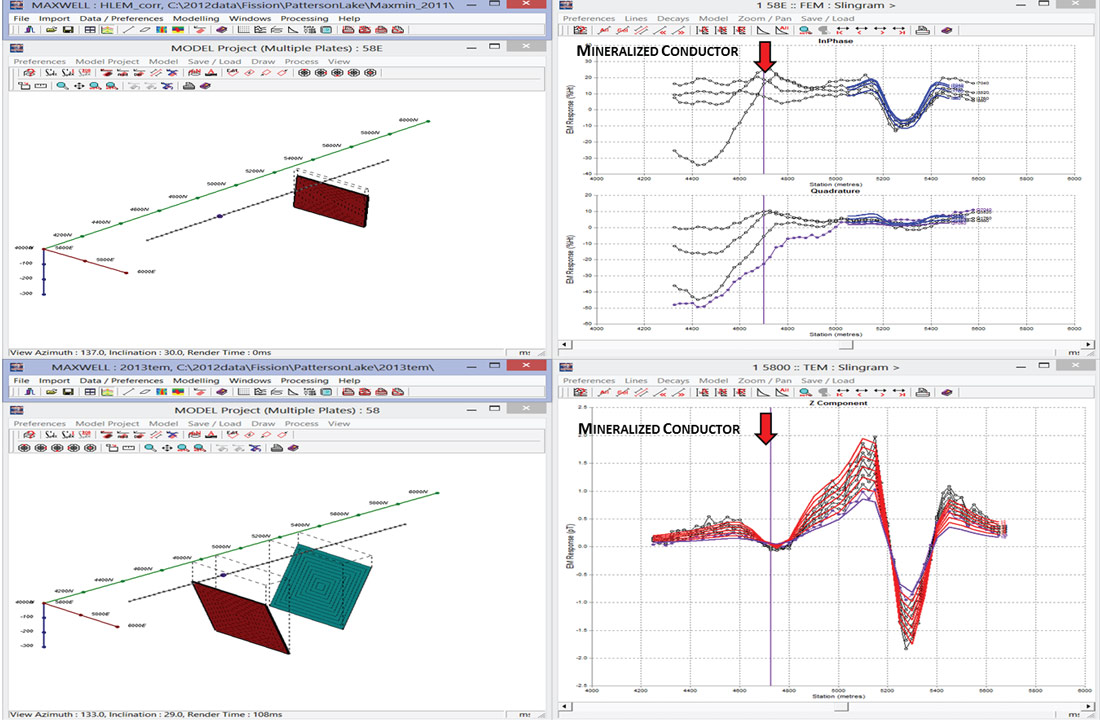
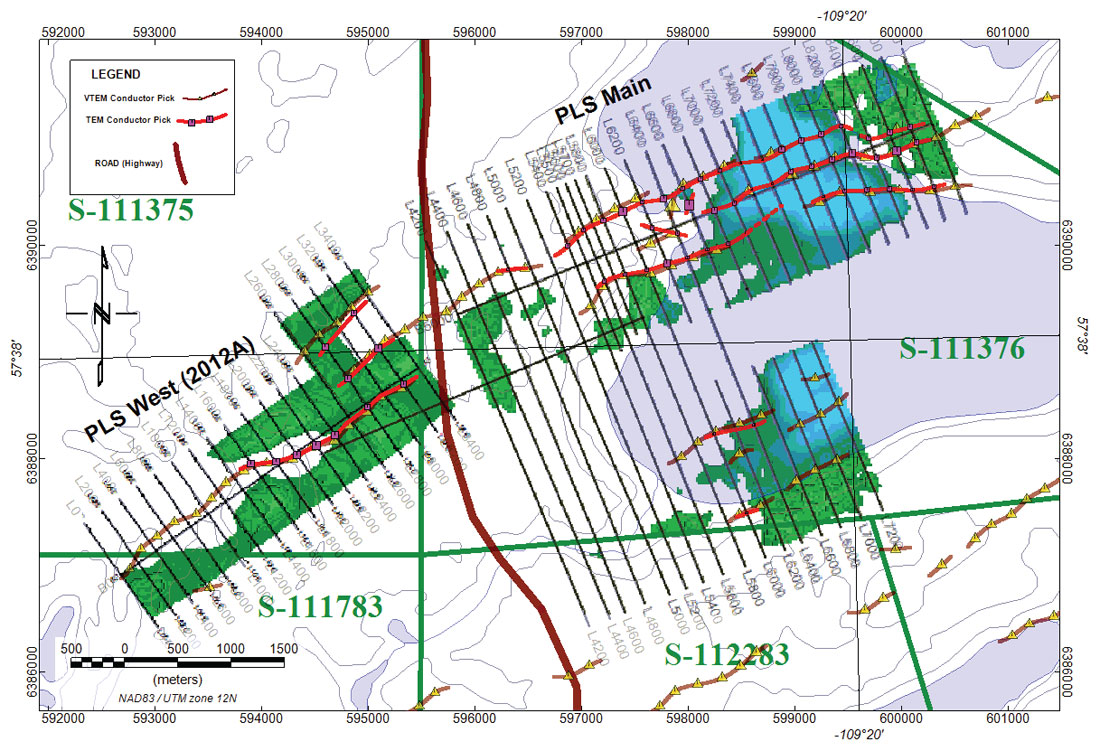
For moving loop surveys focussed at the proper depth of basement conductors, the responses are clear with a good signal to noise ratio. Model studies have suggested that characteristic peaks (or troughs) of complex conductors in close proximity may be displaced from the actual conductor location. Some further modeling shows the peak displacements are also affected by the conductor dips, conductivity, transmitter-receiver spacing and the direction of the survey. These effects are reduced for smaller transmitter loops. The overall shape and character of the conductor Z component response appears independent of the direction of the survey, but the peak displacements are not. This suggests it is necessary to generate models for each profile to determine the actual conductor locations. The procedure for interpreting EM data is to create relatively simple models with Maxwell to determine dips, positions and relative conductivity of complex conductors. This helps to compensate for any geometric effects of complex conductor systems. Figure 14 shows the location of interpreted plate conductors. The ground conductor interpretation is indicated by the red polylines, while the VTEM picks are brown with a yellow filled triangular symbol. Note there are a number of areas where the ground interpreted conductor location is offset from the VTEM conductor pick. There has been a very high success of conductor intersection with drilling based on the Maxwell interpretation of the ground EM.
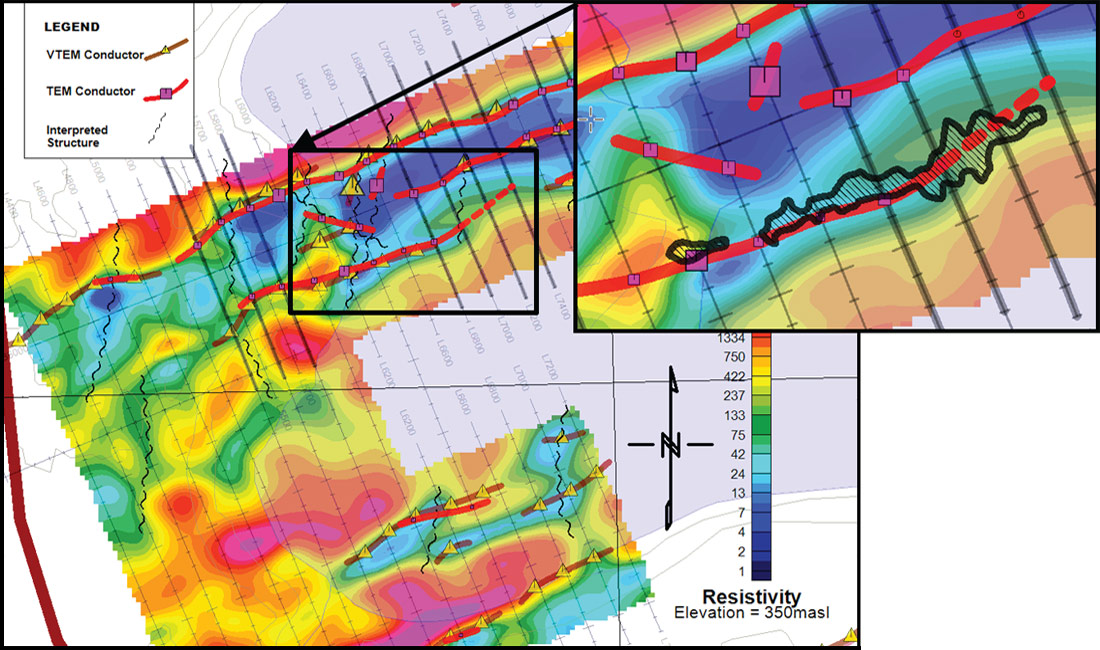
The deposit shows excellent correlation with both an interpreted conductor and a resistivity low segment. Also significant is the evidence of cross structure seen in the resistivity at the west side of the displayed deposit outline. This also happens to be at the location of the discovery hole.
Miscellaneous Geology and Surveys
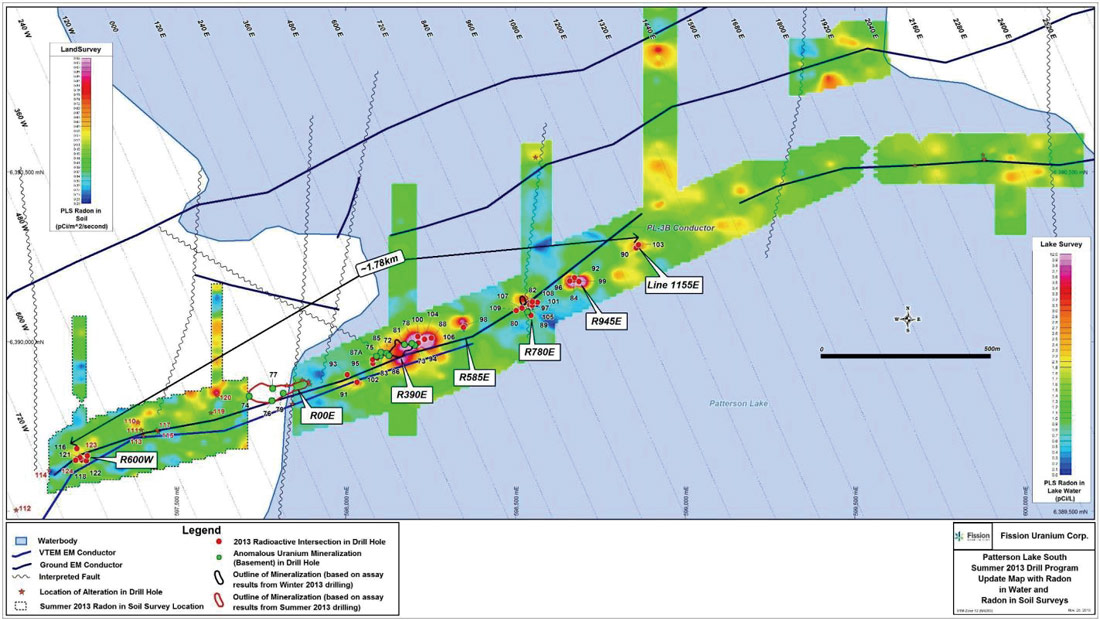
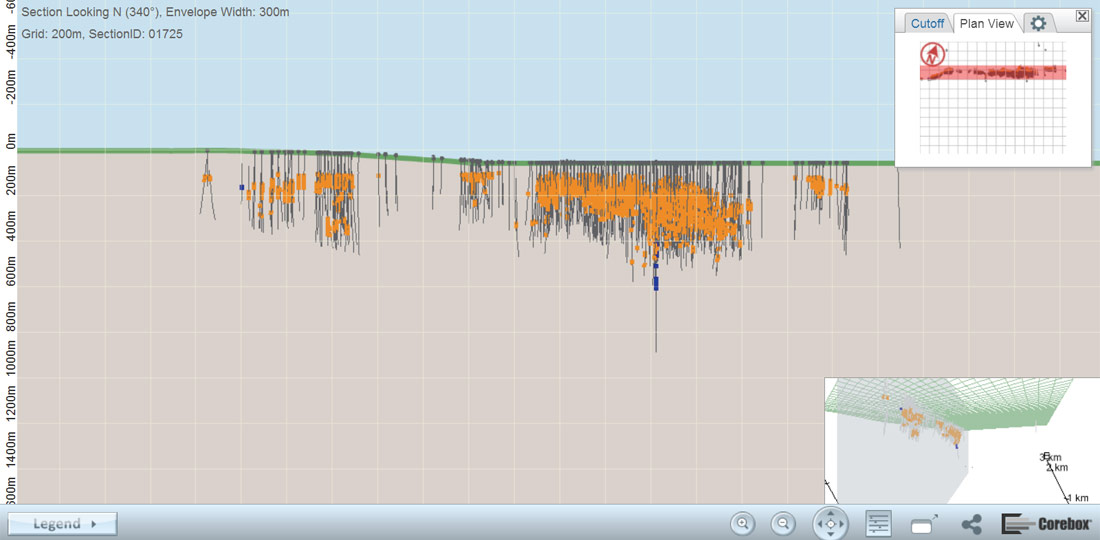
Among a number of follow up surveys, a Radon-in-Water survey (Figure 15) detected anomalies associated with the mineralized deposit. A longitudinal section (Figure 16) illustrates the shallow nature of the deposit as of September 2016.
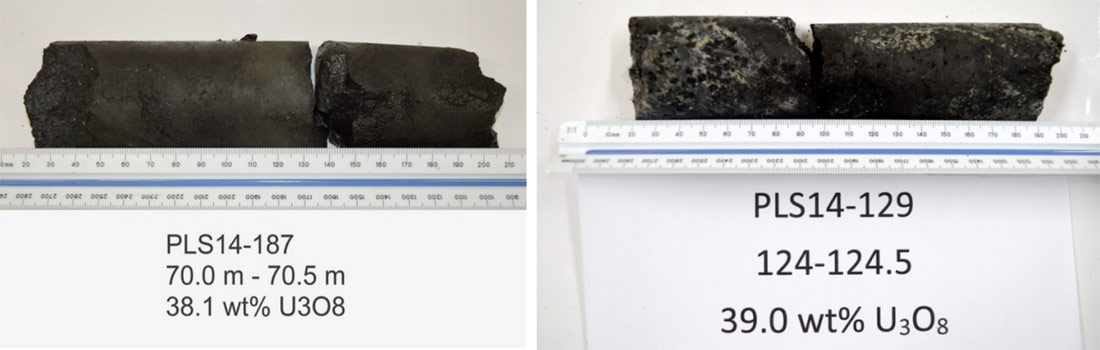
Following in Figure 17 are some images of some outstanding holes. Ross McElroy, President, COO, and Chief Geologist for Fission, commented: "Hole PLS14-187 has returned total composited off-scale width results 46% more than hole PLS14-129, which itself ranks with the top drill holes in the Basin. Not only does the new hole set a new record at PLS but its location means the winter program has now succeeded in merging four high-grade zones (R390E, R585E, R780E and R945E) into one much larger one (R780E)."
Conclusions
The PLS discovery is truly a combined team success effort using skills from management, research, geology and an array of geophysical techniques along with a lot of work by contractors and consultants. Some “outside the box” thinking and innovative practices using the scientific method have contributed to the successful detection of this new uranium deposit.
The deposit shows excellent correlation with a VTEM conductive ‘bright spot’, an interpreted conductor and a resistivity low segment. Also significant is the evidence of cross structure seen in the resistivity at the west side of the displayed deposit outline.
The continued success of the resource delineation and expansion is attributed to the dedicated Fission staff for all the required office and field tasks required to bring the project forward. From Discovery to Resource Estimate, the Triple R Deposit was achieved in just two years of drilling. The Preliminary Economic Assessment (PEA) filed on Sept. 14, 2015 has an indicated Mineral Resources estimate of 81,111,000 lbs U3O8 (2,011,000 tonnes @ 1.83% U3O8) and an inferred Mineral Resources estimate of 27,157,000 lbs U3O8 (785,000 tonnes @ 1.57% U3O8). The indicated and inferred mineral resources are stated using a cut-off grade of 0.2% U3O8 for open pit and 0.25% U3O8 for underground.

Acknowledgements
Thanks to the management and directors of Fission Uranium Inc., as well as to all members of the technical team, consultants and staff contributing to this project.
Related Reading


Join the Conversation
Interested in starting, or contributing to a conversation about an article or issue of the RECORDER? Join our CSEG LinkedIn Group.
Share This Article