Abstract
Three case histories are discussed where ground-based magnetic horizontal gradient intensity (HGI) and radiometric (RAD) exploration surveys have been used effectively in Western Canada. Case 1, at the Rumsey Leduc pinnacle reef field in Central Alberta, is an after-the-fact study. The HGI/RAD anomaly was essentially congruent with the pinnacle as defined by a 3-D seismic survey. Cases 2 and 3 are in the Williston Basin and were surveyed prior to drilling. Case 2, along the Frobisher/Alida (Mississippian) Limestone Cuesta trend, showed significant HGI anomalies shaped like paleogeomorphic reservoirs typical of this area. Two vertical and one horizontal wells were subsequently drilled on these anomalies and all found oil. Case 3, shows how a total count radiometric survey was used to identify a suitable location for drilling an exploratory well in Spearfish (Triassic) sand channels. The channels were clearly outlined by the RAD survey. Seismic exploration is often ineffective in delineating such channels. This well found oil. The theory of these surface exploration tools is discussed, along with a discussion of the surveying methods which are based on making geophysical measurements of the effects of geochemical alterations caused by vertical migration of seeping hydrocarbons. We have achieved 80% success in finding hydrocarbons using these surveys, a rate commensurate with other explorationists using the same techniques in the United States and Australia. These surveys are designed to be complementary to seismic exploration, but they cost one tenth of a 3-D seismic survey and one fifth of a 2-D survey.
Introduction
This paper discusses three case histories where ground-based magnetic horizontal gradient intensity (HGI) and radiometric surveys have been used in Western Canada for cost-effective hydrocarbon exploration. Aquamarine Energy Exploration Limited has adapted, for use in Western Canada, these 'direct location technologies' from studies published in the technical literature, and experience gained over the past seven years in conducting these surveys.
We use these surveys in conjunction with the usual geologic and seismic studies for evaluating prospects and land, and for verifying seismic anomalies. The HGI and radiometric methods measure effects associated with geochemical alterations due to vertical microseepage of hydrocarbons, and complement independent studies based on measurement or assumption of structure or stratigraphy. Because the combination HGI and radiometric surveys cost about one-tenth that of a 3-D seismic surveyor one-fifth that of a 2-D seismic survey, we find them an attractive and rapid survey adjunct to traditional exploration. They substantially reduce finding costs and significantly raise the probability of financial success.
During the past decade, and especially within the past few years, numerous discussions have appeared in the technical literature concerning hydrocarbon exploration based on measuring either the effects of vertical hydrocarbon migration from reservoirs, or the leaking hydrocarbons themselves. The consensus of participants at the American Association of Petroleum Geologists Hedberg Research Conference on 'Near Surface Expression of Hydrocarbon Migration' in Vancouver this past April is that all hydrocarbon reservoirs leak, and leak vertically upwards, as well as along fault traces.
The Hedberg Conference covered: near-surface manifestations of hydrocarbon migration; secondary alteration induced by hydrocarbon migration; migration mechanisms and models; survey design; sampling techniques and analytical methods; and exploration case studies. The Conference keynote address by Martin J. Davidson, and three representative papers on surface exploration technologies are presented in the June 6, 1994 issue of the Oil & Gas Journal.
Although the proceedings of that conference will not be available for some months, the theoretical and empirical basis for the geophysical surveys covered in the present paper are well established in the literature.
Theory of HGU and Radiometric Surveys
The theory advanced by Saunders etal (1993a) that relates near-surface anomalies in uranium, potassium, topography and magnetics to hydrocarbon deposits is "that hydrocarbon microseepage involves vertical ascent of ultra-small (colloidal size) gas bubbles of light hydrocarbons (methane through the butanes) through a network of interconnected, groundwater-filled bedding planes" and this microseepage instigates diagenetic changes that enhance near-surface magnetic mineralization and alter the balance of uranium and potassium minerals. Figure 1, taken from Saunders etal (1994a) illustrates this model for hydrocarbon microseepage alterations.
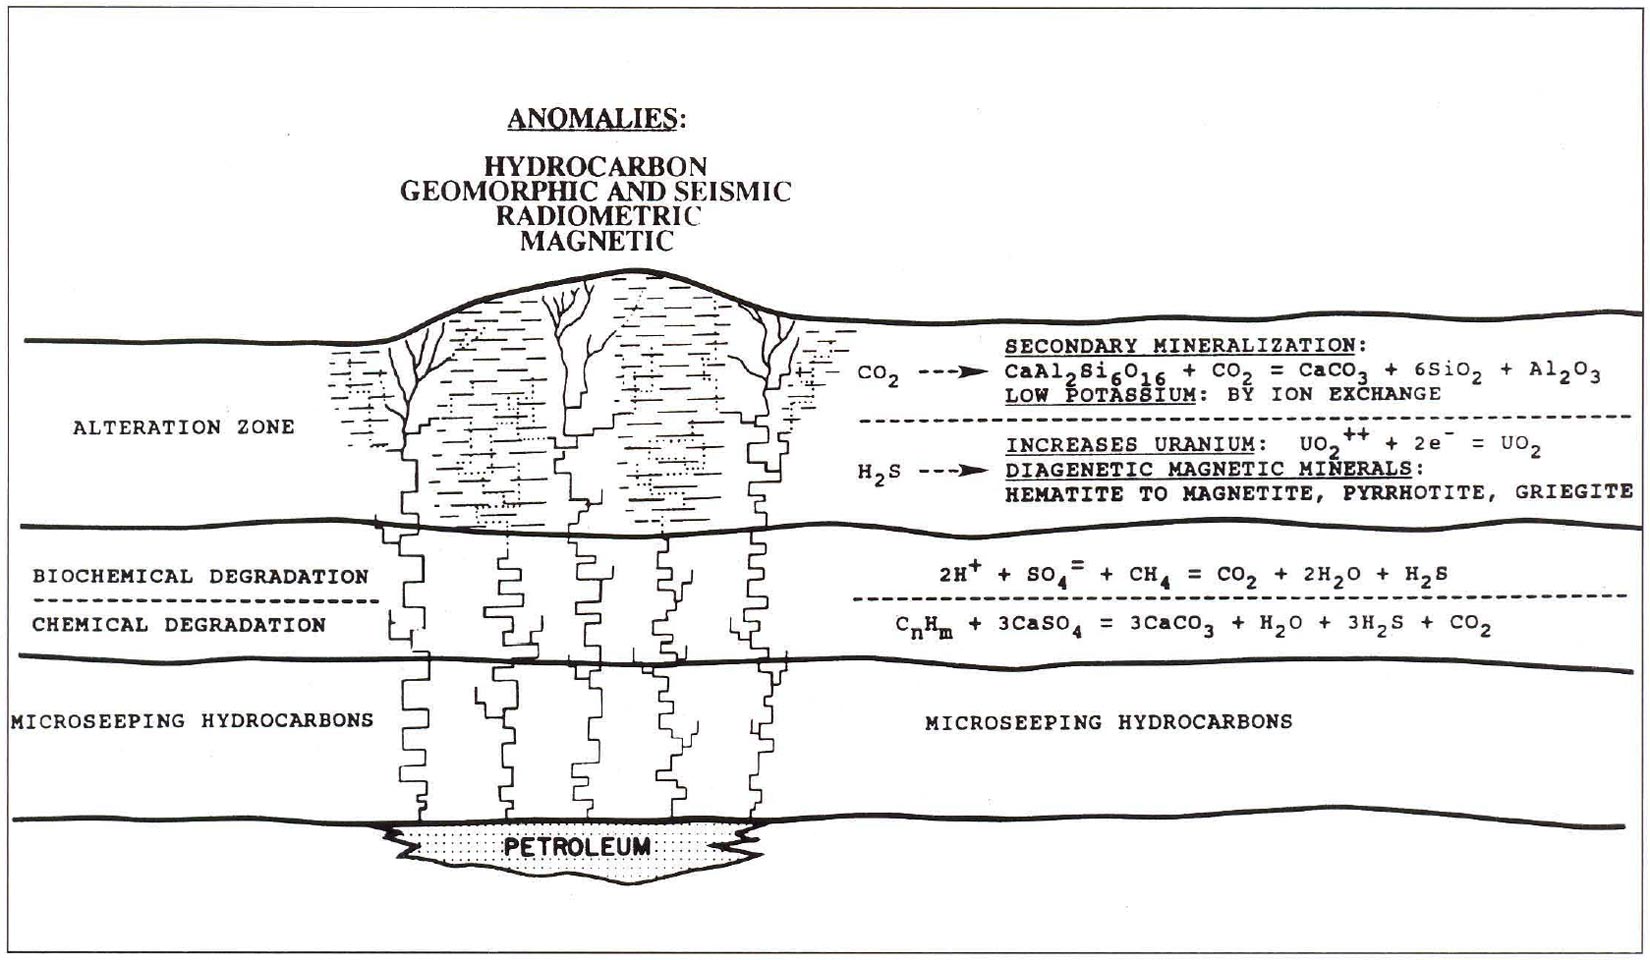
Saunders etaI (1991) shows the relationship among hydrocarbon accumulations at depth to soil magnetic susceptibility and soil gas, and that there are anomalously large amounts of diagenetic magnetic minerals in shallow-depth samples in 89% of the cases over 19 oil and gas fields.
cases over 19 oil and gas fields. Foote (1984, 1986, 1992, 1994) analyzed soil magnetic susceptibility in drill cuttings from hundreds of wells over, and surrounding, oil and gas fields which correlated positively with aeromagnetic data flown above these fields. He discovered anomalous magnetic minerals were found in the rock column above these fields at depths of between 60m and 600m and could be measured with low-altitude aeromagnetic surveys, and the combination of measurements could be used to predict hydrocarbon discoveries 80-85% of the time.
The theory discussed above has yet to be conclusively validated. Empirical evidence indicates effects of hydrocarbon microseepage can be measured over most oil and gas fields. Machel and Burton (1991) say, "In diagenetic environments containing hydrocarbons, the most important magnetic minerals formed appear to be magnetite and pyrrhotite, whereas the most important magnetic mineral dissolved or replaced is hematite. Hence hydrocarbon seepage and migration may result in positive, absent, or negative anomalous magnetization (magnetic contrasts) relative to the total magnetization prior to hydrocarbon invasion, depending on the amounts of magnetite and pyrrhotite formed relative to the amounts of hematite destroyed." They also observe that hydrocarbon seepage can be vertical, or in any other direction toward the surface owing to faults or high permeability pathways not necessarily vertical.
Gay (1992) has documented numerous problems with previous aeromagnetic studies that purport to be measuring diagenetic magnetic effects and proposes his own theory to account for what he, nonetheless, recognizes as the undeniable statistical association of enhanced soil magnetic susceptibility to subsurface hydrocarbons.
Whatever the cause of the measured variations in radioactivity and soil magnetic susceptibility over hydrocarbon emplacements, a sufficient number of independent studies of these associations exist to support conducting HGI and radiometric surveys for hydrocarbon exploration. Such studies are as referenced above, and include the statistics of Wean and Heimberg (1981), indicating a 50% probability of encountering hydrocarbons using total count radiometric surveys, and the statistical study by Calhoun (1991) of the relative success of 12 geochemical methods used in the Permian Basin of Texas. In the Calhoun study, magnetic methods scored 62-65% and radiometric methods scored 70-88% probability in discovering hydrocarbons.
Although all of the above-referenced studies have been conducted either in the United States or Australia, our experience in Western Canada is similar in that these methods predict hydrocarbons 80% of the time wherever we have tried them.
Our Survey Methods
Our HGI survey is essentially a land-based version of the airborne survey discussed by Donovan etal (1984). Using two magnetometers accurate to O.1nT (one for surveying, the other as a base station) total field magnetic (and radiometric) data are recorded at 50m intervals along linear profiles. We survey eight linear miles/section at the outset. Fill-in data are recorded later as needed. The corrected survey data are then gridded using a kriging algorithm. A filter, designed to focus on shallow anomalies having the spatial period of hydrocarbon reservoirs expected in the survey area, then operates on the gridded data matrix to remove the regional magnetic effects of the Precambrian basement. The absolute value of the second horizontal derivative of the residual data is then mapped as the horizontal gradient intensity. HGI anomalies appear to conform to the shape of the reservoir being mapped.
In a typical survey a gamma radiation spectrometer is mounted forward of an all terrain vehicle (ATV). A GPS navigation system is also mounted on the ATV. The magnetometer operator trails 50m behind the quad, away from any influence of the vehicle. The magnetometer operator continually scans the area at each location prior to recording data to ensure no obvious magnetic contamination is likely.
Total count radiation measurements must be corrected for diurnal variations as well as day-to-day variations due to changing atmospheric conditions. As in the case of HGI surveys, the radiometric data are gridded with a kriging algorithm and a numerical filter operates on the data matrix to identify anomalous values above or below the mean background count.
The thorium-normalized uranium and potassium measurements discussed by Saunders etal (1993a, 1993b) appear to be more stable than our previously used total-count measurements, in terms of terrain, meteorological and diurnal variations. Radiometric anomalies, unlike HGI anomalies, do not necessarily conform to the shape of the reservoir. They may occur as halos around the reservoir or at various locations over the reservoir (apical anomalies). We use radiometric surveys to complement and verify our HGI surveys. Although in a survey there is a variety of causes for either magnetic or radiometric anomalies to occur that have no relation to hydrocarbons, it is less likely for congruent radiometric and magnetic anomalies to occur without hydrocarbon leakage being the common causative factor.
Three Case Histories
The Rumsey Leduc reef in Central Alberta is an after-the-fact case history that shows congruence of HGI and seismic anomalies. It was discovered by Gulf Canada in 1982 as a result of a single seismic line that encouraged Gulf to lease the land, and two more lines used to define an anomaly (30 ms isochron thinning between the Viking and the Ireton). No clear seismic anomaly was seen at the Leduc/Cooking Lake level, just a defocussing of the seismic energy. A well flowing 4000 BOPD for three years resulted from a pinnacle reservoir covering only 40 acres (16 ha).
To date, 3.8 million barrels have been recovered (Lemon and Taylor, 1993). Lemon (1993) acknowledges the discovery was based on serendipity as well as science. Subsequent to the Rumsey discovery, Gulf conducted a 3-D seismic survey to determine the full extent of the reef. Gulf recently participated in a joint project with Aquamarine Energy to share and make public this survey in exchange for our HGI and radiometric survey of the same area. The results are shown in Figure 2.
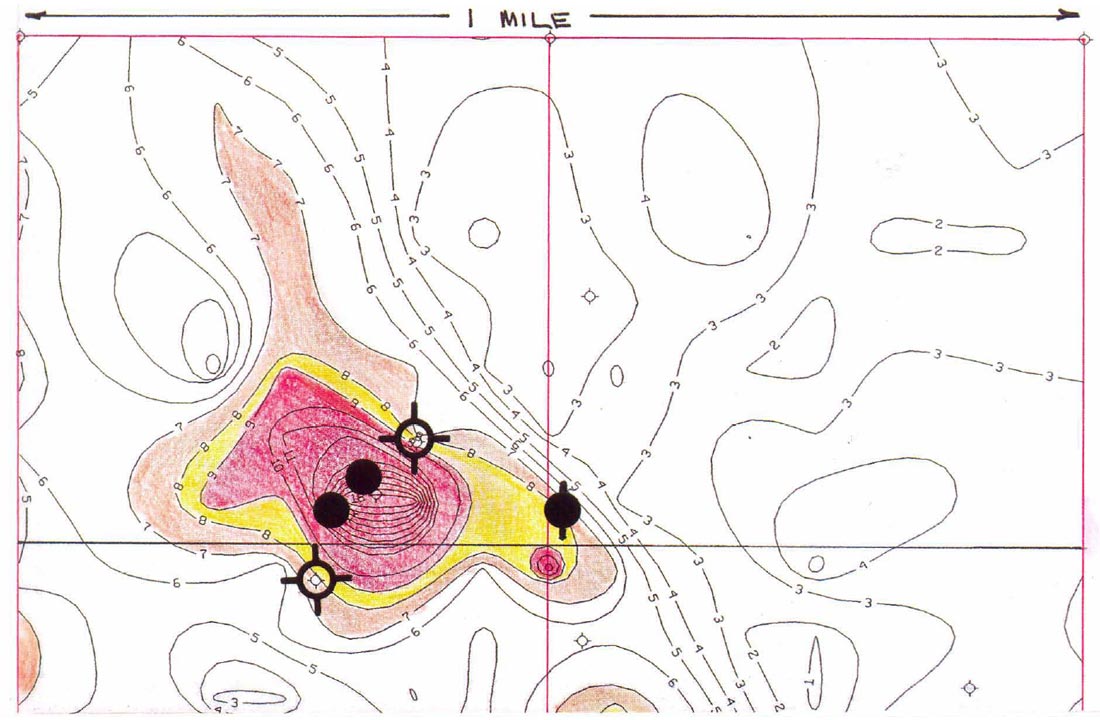
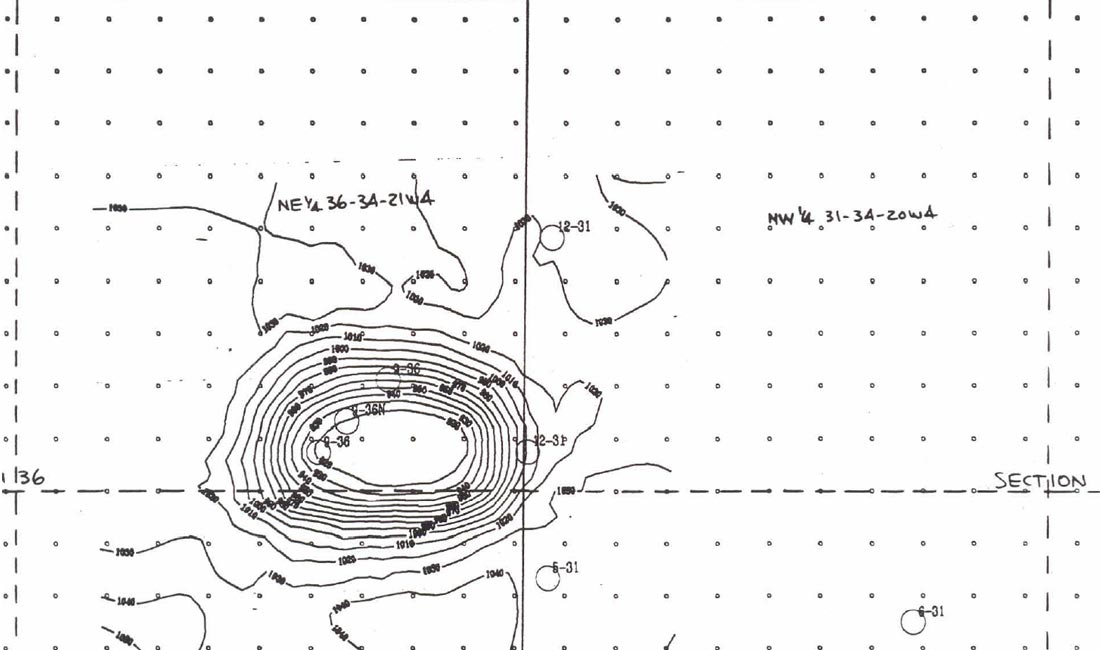
It is clear from Figure 2 that the HGI survey targets the reef as does the Gulf 3-D seismic survey. We have measured at the Rumsey Field the magnetic effects due to well casings, pipe, infrastructure and pipelines and have taken into consideration and removed these effects before preparing the HGI map. Magnetic data recorded every 10m from the 9-36N-34-21W4 well (completed to the Cooking Lake platform) showed that, going either N-S or E-W, the effect of the well was no longer observed 80m away from the well. Pipelines caused effects no further than 20m away. Accordingly, magnetic data values within 80m of wells or 20m of pipelines were replaced by regional averages derived from values outside the affected zone.
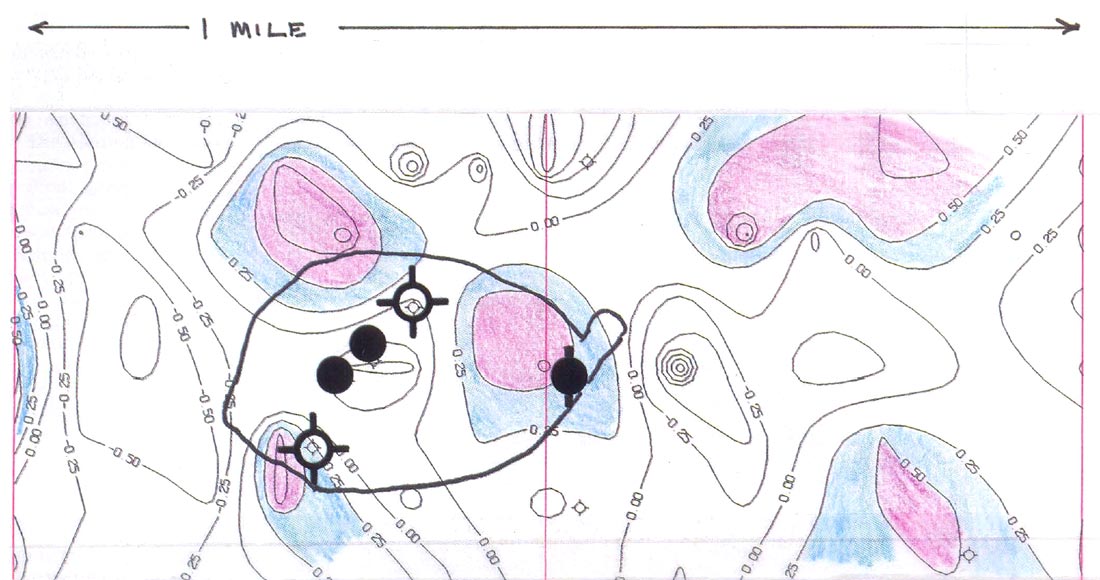
Our thorium-normalized radiometric survey independently produces a clearly defined halo anomaly around the reef field (Figure 3), reinforcing the validity of the HGI survey as an indicator of hydrocarbons below. We have observed similar halos around the Morinville, Golden Spike and Redwater reef fields. Saunders (l994b) suggested that reef fields were more likely to have halo rather than apical anomalies owing to probable differential compaction-related faulting around reefs.
Although Figures 2 and 3 show a striking example of our survey targeting the Rumsey Reef after the fact, we have had success with HGI and radiometric surveys as predictors of finding hydrocarbons prior to drilling. Two case histories in which the HGI and radiometric surveys were used for prediction of hydrocarbons in rank wildcat wells in the Williston Basin are shown.
Figure 4 is an HGI survey along the Frobisher/Alida trend in the Williston Basin. The reservoirs result from Mississippian erosion of a limestone cuesta that subsequently was capped by tight dolomite and/or anhydrite. The Mississippian erosion surface can usually be mapped using seismic surveys.
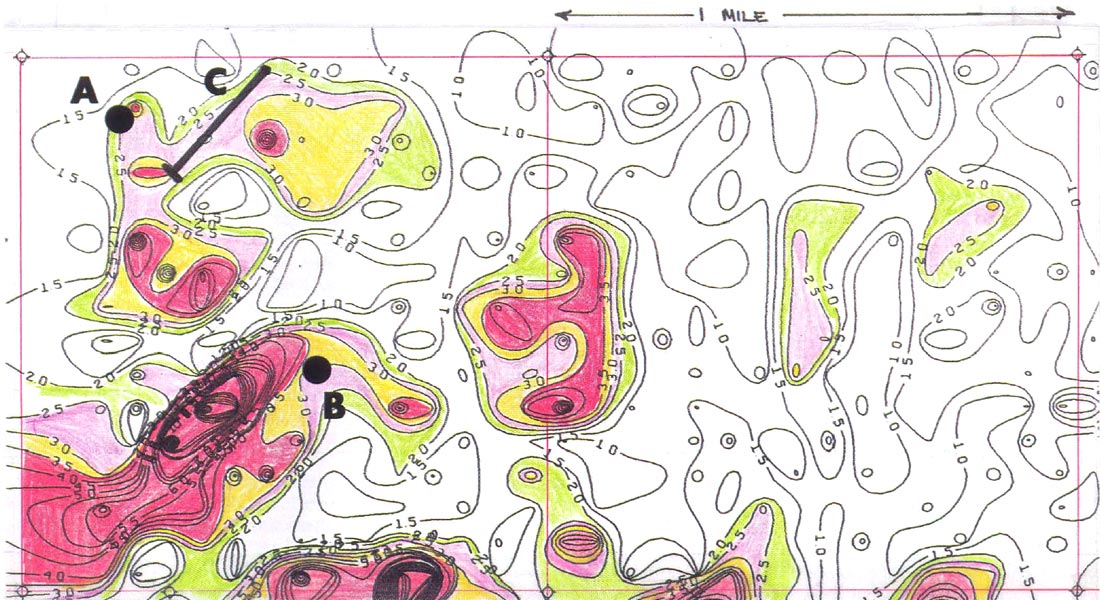
We completed this HGI survey prior to any drilling. Well 'A' in Figure 4 was subsequently drilled by a company that farmed in on the property. The well made 246 m3 in its first month on production. The company drilling this well based its location on a seismic line and ignored, at that time, our data. After the well was successful, the company sought our advice for location of Well 'B' since it had no other seismic coverage in the area. Well 'B' was then drilled, oil was found, and this well is now on production. Following that, horizontal well 'c' was drilled and it too is on production.
Figure 5 is a total count radiometric survey over Spearfish sand channels in the Williston Basin. These channels cannot easily be seen with seismic surveys. The radiometric survey, which illustrates the removal of potassium-40 over hydrocarbon emplacements, and, hence, negative total count anomalies, clearly outlines these channels and shows the relationship between existing producers in the southwest and the channel sand. Well 'D' was drilled after the survey was completed on what appeared to be a similar channel to the northeast. It was a producer.
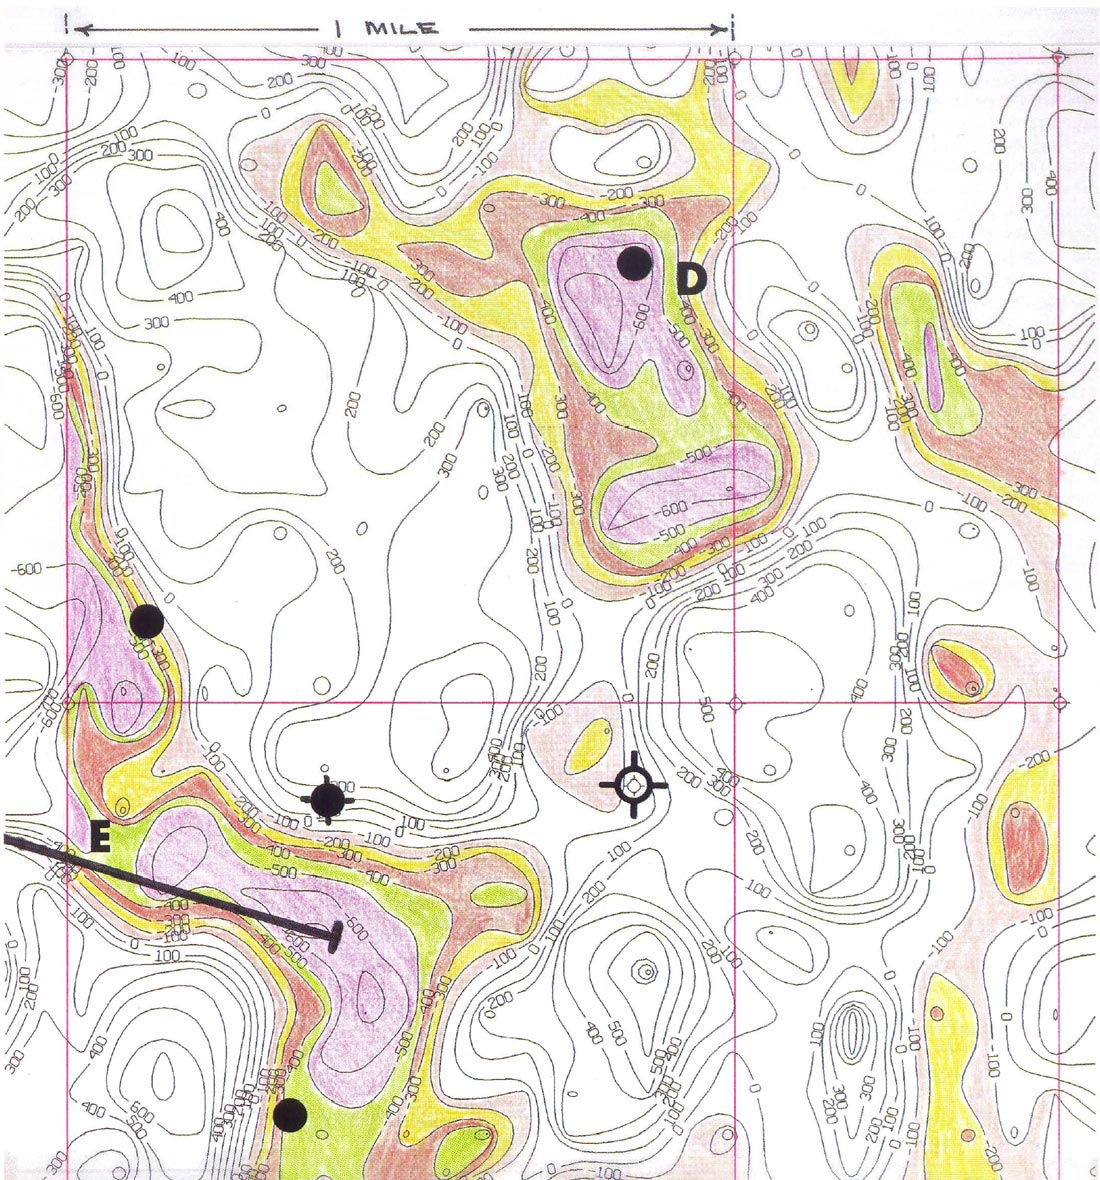
When the radiometric survey used for choosing a location for well 'D' was being conducted, another company spudded the horizontal well 'E' in the section west of Figure 5, and, unknown at the time, the 'heart' of the channel in the southwest of Figure 5 was being penetrated. The location of well 'E' was chosen on the basis of subsurface geology alone. It is an economic producer.
Although it is always good practice to place geologically reasonable boundary conditions on interpretations of geophysical data, no attempt was made in these case histories to bias the contouring in any way other than which the computer contouring package would normally do. This adds strength to the comparison of the Gulf 3-D seismic contours with HGI contours in Figure 2. Similarly, in the case of Figure 4, the shape of individual HGI anomalies, and the overall NW-SE trend of these anomalies, appears consistent with the paleogeomorphic erosion patterns suggested by Martin (1966) in his classic study of the Frobisher/Alida cuesta in Southeast Saskatchewan. The HGI anomaly shapes also appear consistent with the shape of Tilston and Alida cuesta net pay 'sweet spots' in a variety of reservoirs as mapped by the author.
On the other hand, a geologist would wish to interpret the contouring of the Spearfish channels in the northern half of Figure 5 as being continuous. Still, it is clear to the geologist from the machine contouring in these Figures what the reservoir pattern should be.
Patterns, particularly those of HGI anomalies, are valuable in interpretation of potential reservoirs, especially since these techniques do not differentiate from which horizon an anomaly at the surface has resulted. In the case of Figure 2, for example, anomaly patterns suggest a NW-SE Cretaceous sand channel overlays the ellipsoidal reef. There is much Cretaceous gas in the area.
Finally, it should be noted that these techniques, while clearly indicating probability of encountering hydrocarbons, like seismic or subsurface geological mapping, they are not necessarily indicative of whether any given well drilled will be economic or not.
Summary
Since Aquamarine Energy began using HGI and/or radiometric surveys for predicting hydrocarbons in wildcat wells, we predicted 11 wells would encounter oil. Nine of these wells did find oil for successful prediction 82% of the time. Our experience, like those who conducted similar exploration in the United States and Australia, is that HGI and radiometric surveys substantially reduce exploration costs at whatever point in the exploration cycle they are used. They are particularly effective when integrated with geological and seismic studies since they provide independent confirmation, or negation, of specific prospects, and assure a substantially higher probability of success than with geology and seismic work alone. The combined ground-based HGI and radiometric survey costs approximately one-tenth the cost of a 3-D seismic survey and one-fifth the cost of a 2-D survey. For a more detailed discussion of the business ramifications of these survey techniques, see "Odd Man in the Oil Patch" in Canadian Business, (Greber, 1994).

Acknowledgements
The author thanks Mr. Kevin J. Christie, Chief Geoscientist, and Dennis Dorval, Geophysicist, of Gulf Canada Resources Ltd, for facilitating our surveys over the Rumsey reef, providing the 3-D seismic survey for correlation, and for giving permission to publish the results.


Join the Conversation
Interested in starting, or contributing to a conversation about an article or issue of the RECORDER? Join our CSEG LinkedIn Group.
Share This Article