Excessive groundwater seepage can be a common engineering concern with earthen dams. The application of geophysical methods, whether for characterization or for long-term monitoring, to help inform mitigation strategies is becoming a more common addition to these investigations. The U.S. Geological Survey (USGS) has completed geophysical investigations at several earthen dams in cooperation with the U.S. Army Corps of Engineers (USACE) to help characterize subsurface hydrogeologic conditions and to identify potential sources of seepage. Summaries of the investigations of Martis Creek Dam and Hidden Dam, both located in California, are presented.
Martis Creek Dam
Introduction
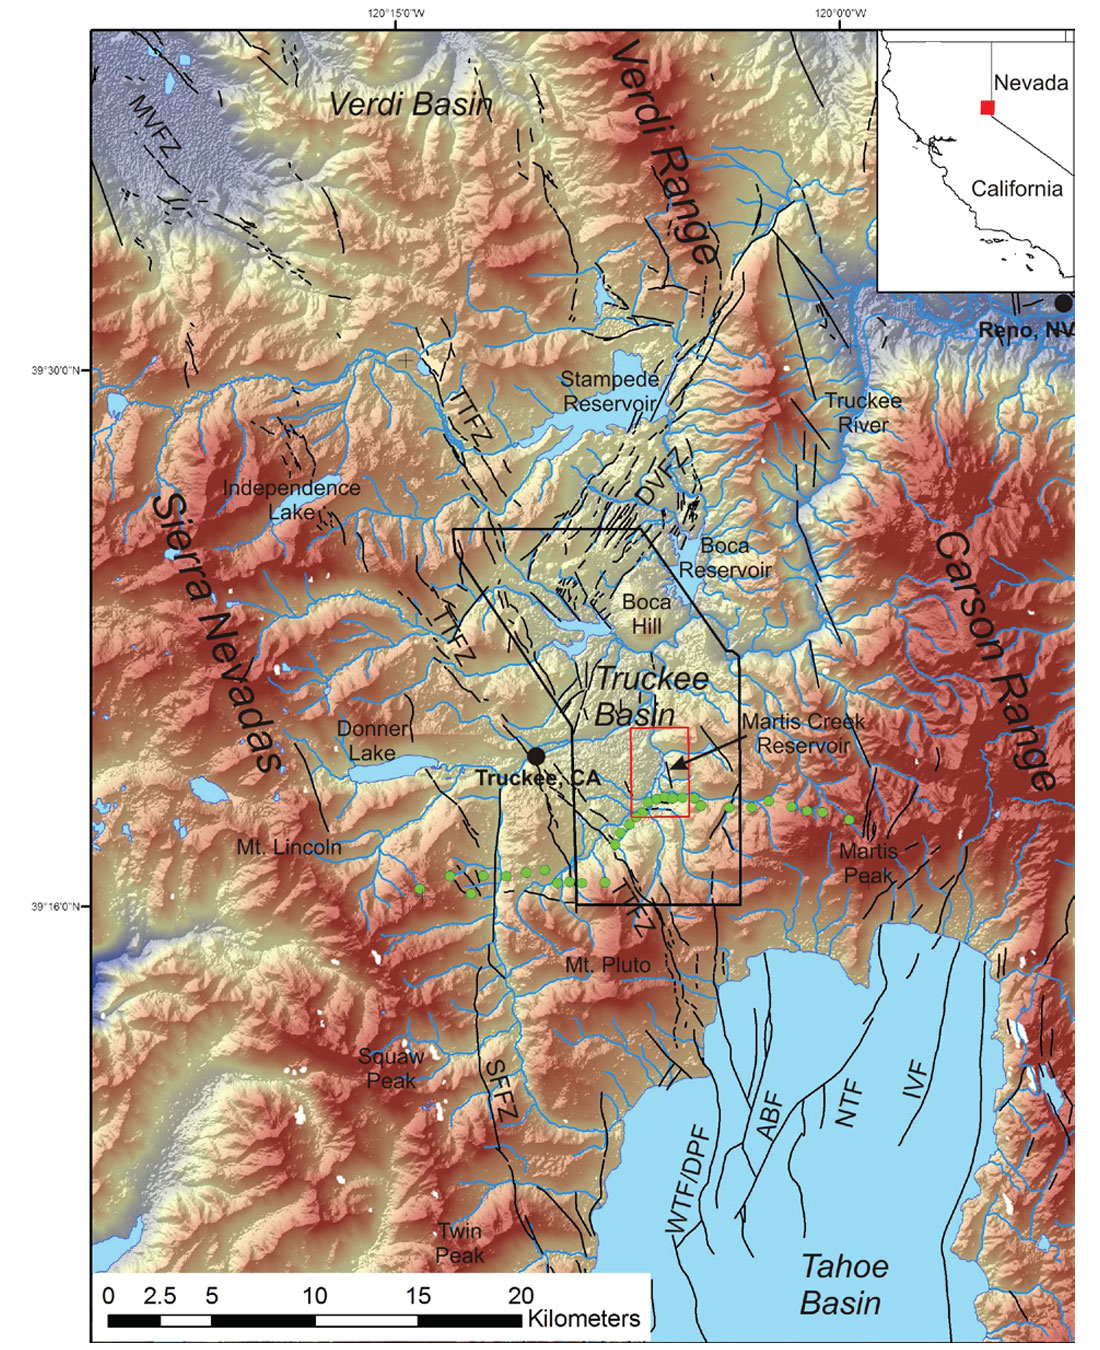
Martis Creek Dam, a rolled, earth-fill dam constructed by the U.S. Army Corps of Engineers (USACE) in Truckee, California, was built primarily for flood control and secondarily as a future water supply for the downstream area. Martis Creek joins the Truckee River 6 km east of the town of Truckee, California and 55 km upstream from Reno, Nevada. The Truckee River, the sole outlet for Lake Tahoe, flows northward through Truckee and Reno before terminating at Pyramid Lake, located in Nevada (Fig. 1). The expected water storage at gross pool is 0.0247 km3 (20,000 acre-ft), corresponding to a maximum reservoir elevation of 1784.3 m (USACE, 1996). At its crest, the dam is 815 m in length with a maximum height of 34.5 m above the original streambed. The crest is at 1785.8 m elevation, and a spillway chute to the west of the dam is at 1779.0 m elevation (USACE, 1972).
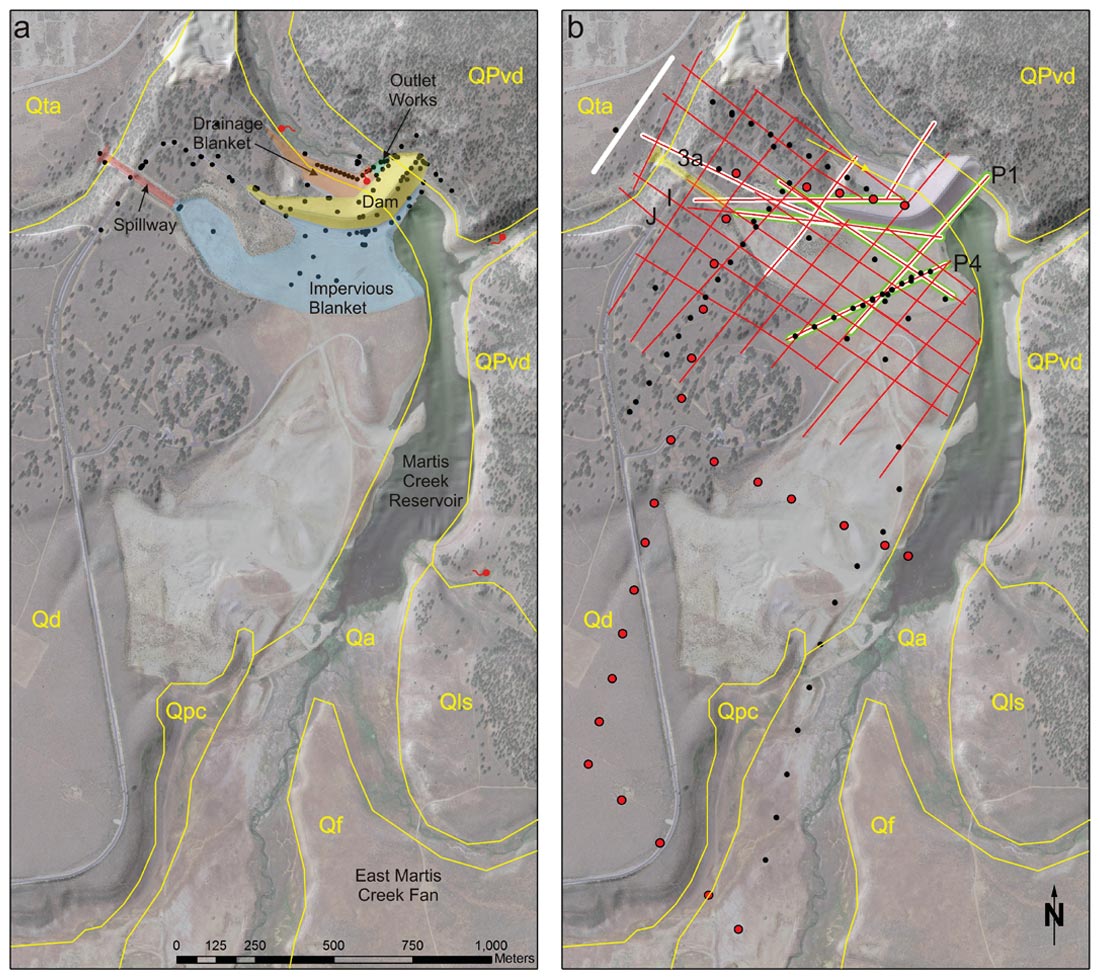
Since completion in 1972, the dam has experienced seepage issues documented during six reservoir test fills between 1973 and 1995. The observations include small sand boils around flowing relief wells along the downstream toe, slides along the downstream access road, heavy seepage proximal to the outlet works, seepage and pin boils at the base of the downstream blanket, and seepage on both sides of the spillway (Fig. 2a). Modifications to the downstream drainage blanket have improved the ability to handle seepage, but due to ongoing seepage concerns, the dam has never held water to its designed gross pool level. In order to mitigate the hazard associated with increased seepage at higher pool levels, the reservoir has been maintained at or below 25% of storage capacity, or 1771 m elevation (USACE, 1996).
To provide the USACE with geologic, hydrogeologic, and structural information to inform decisions on the future of the dam, the USGS applied a suite of geophysical methods to investigate (1) subsurface controls on seepage, (2) the depth to crystalline basement, (3) the distribution and chronology of volcanic flows beneath the dam and reservoir, and (4) faulting in the vicinity of the dam. The results presented in this article will focus on the seepage and faulting investigations at the engineering scale related directly to the dam. Bedrosian et al. (2012) presents the results of the regional-scale study related to basement depth and volcanic flows and Powers et al. (in review) includes complete descriptions and results of all datasets.
Martis Creek Dam is located within the southern Truckee Basin, bounded by the Sierra Nevada to the west and the Carson Range to the east (Fig 1). Quaternary deposits from multiple glacial episodes dominate the near-surface geology (Fig. 2). These glacial outwash deposits cover most of the region with an average thickness of 20-30 m and overlie a minimally 60-m thick Prosser Creek alluvium in the vicinity of the dam. Donner Lake outwash (Qd) is older and more widespread (Birkeland and Janda, 1971) than the Tahoe outwash (Qta) and is the primary outwash focus of this study. Prosser Creek alluvium is subdivided into three members: an upper fluvial member (Qpcf), a lacustrine blue silt layer (Qpcl), and a lower lacustrine member (Qpcu). The dam was constructed on the blue silt layer, deemed to be a hydrologically impermeable layer suitable for reservoir retention (USACE, 1972). Based on lithology logs from a limited number of boreholes, the glacial and alluvium deposits are underlain and interfingered by Miocene volcanic deposits.
Methodology
The hydrogeologic and structural setting of the immediate Martis Creek Dam area were studied in 2008 and 2009 through an integrated use of geophysical methods that included electrical resistivity tomography (ERT), time-domain electromagnetic soundings (TEM), P- and S-wave seismic reflection and refraction, and self-potential (SP) in several acquisition phases during 2008-2009 (Fig. 2b). Twenty-eight two-dimensional (2-D) inverse Schlumberger ERT profiles with 120 electrodes per layout, spaced 5-m apart, were acquired in a grid pattern with coverage focused on investigating the downstream seepage areas of concern and the spillway area. In 1966, prior to dam construction, one-dimensional (1-D) direct-current (DC) resistivity Wenner array soundings were acquired by a contractor. The maximum electrode spacing was 50 m, which corresponds to about 50 m depth of investigation (Geo-Recon Inc., 1966). Fifty-two central-loop TEM soundings were acquired to investigate deeper electrical structure than the ERT can constrain.
Seismic survey design was optimized for refraction tomography analysis in the upper 60 – 100m but with sufficient reflection coverage if coherent reflection arrivals were observed. Coherent reflections were in fact recorded throughout most of the survey area. Nine P-wave and five S-wave 2-D seismic profiles were acquired using various sources: a trailer-mounted, 90-kg accelerated weight drop source, a 8-kg sledgehammer and plate, and 150-g buried explosive charges. Nominal geophone and shot spacing were 5 m and 10 m, respectively, with a 96- or 144-live channel array.
Three reference electrode SP surveys were completed that generally followed the locations of the 2-D ERT and seismic profiles, for a total of 1391 stations. Non-polarizing Pb/PbCl electrodes were used. At each station, three shallow holes were dug and five measurements per hole recorded.
Geologic and Hydrogeologic Results and Discussion
Following preliminary investigations, it was determined that variations in the subsurface electrical properties were the most useful in delineating the contact between the surficial glacial outwash and the underlying Prosser Creek alluvium deposits. The glacial outwash, which is more hydraulically conductive than the underlying formation (Cedergren, 1976), dominates the groundwater flow and seepage patterns observed on the upstream and downstream sides of the dam, respectively. Survey design for subsequent phases therefore included greater coverage of ERT and TEM data over seismic to better resolve the glacial outwash- Prosser Creek alluvium contact.
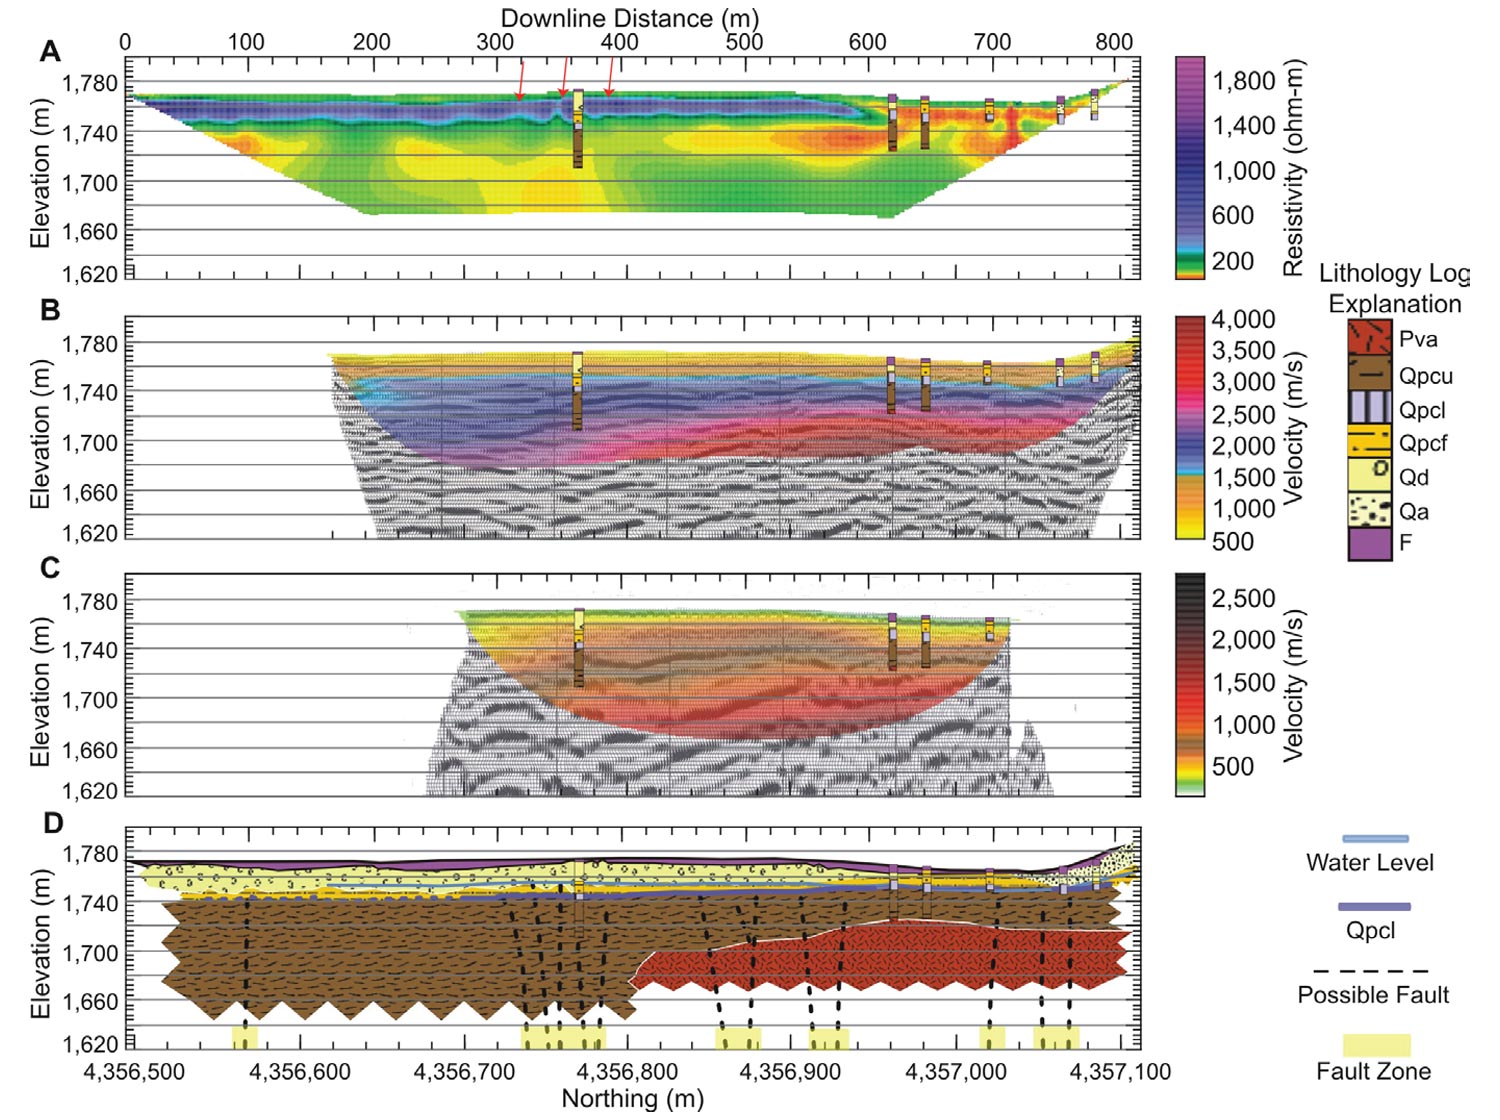
Figure 3 shows the coincident ERT, seismic, and borehole data and geologic interpretation for Profile 1 (P1 on Fig. 2b). Color scales for the ERT and seismic refraction tomography models were designed to highlight geologic and hydrogeologic boundaries based on property values and correlations with available lithology logs. There is a strong resistivity contrast between the coarser-grained, less clay-rich glacial outwash (>250 ohm-m) and the underlying, generally more clay-rich Prosser Creek alluvium (<100 ohm-m; Fig. 3a). The Profile 1 ERT data in particular show that the surface deposits were excavated down to the blue silt layer (>600 m downline distance). Not only are faults apparent in the seismic reflection profiles (figs. 3b and 3c), fault expressions are also observed in the high resistivity layer (interpreted as Donner Lake glacial outwash) when they extend to at least the base of the outwash. Because subsurface saturation levels were not strongly correlated with resistivity changes, water level was interpreted across all profiles based on the 1500 m/s P-wave interval velocity contact (Fig. 3b). Geologic cross sections were created for each profile based on integrated interpretation of all available datasets (Fig. 3d).
Two distinct features were identified based on the interpretation of the Donner Lake glacial outwash-Prosser Creek alluvium contact from the ERT, 1-D resistivity soundings, and TEM data: the presence of (1) two outwash-filled paleochannels and (2) the Prosser Creek ridge and Hill. The extents, elevations, and orientations of these features qualitatively and quantitatively explain the observed downstream and spillway seepage during reservoir fill events and provide guidance for how to mitigate these concerns in the future. Both features trend southwest-northeast (Fig. 4).
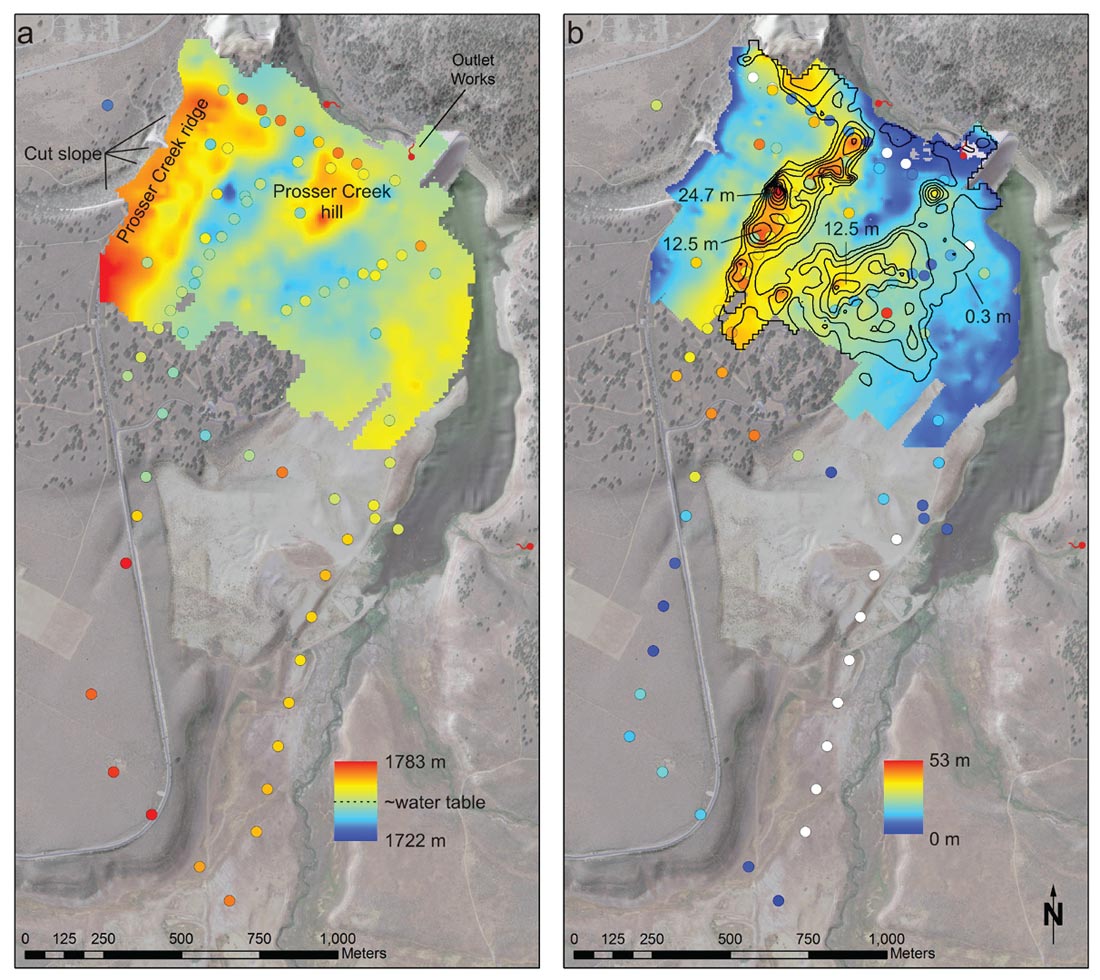
Based on the P-wave refraction velocity of 1500 m/s, the current maintenance reservoir pool level of 1770.9 m corresponds to a groundwater level of approximately 1753 m in the spillway area to the west of the reservoir. The western paleochannel is narrower, deeper, and more defined than its eastern counterpart and corresponds to a location of seepage on the downstream side that was mitigated in 1976-77 and 1985 by rebuilding and extending the drainage blanket specifically in this area. Seepage was originally observed in this area at low pool elevations of 1767.8 and 1771.8 m (USACE, 1996), about the same current maintenance pool level to minimize seepage. A spring located immediately northeast of the mapped paleochannel along Martis Creek may also be related to the presence of the groundwater flow directed by the paleochannel (Fig. 4b). The SP survey results (not shown) exhibit a general trend of increasing potential from south to north, consistent with a northward regional groundwater flow direction. There is an anomaly located on the downstream drainage blanket on the west embankment that correlates with the location of the northern end of the western paleochannel (Powers et al., in review). The eastern paleochannel is generally wider and provides a secondary groundwater flow path between the reservoir and directly beneath the dam to the west of the outlet works. The mapped northern extent of this paleochannel also corresponds to a natural spring that was encapsulated during construction (USACE, 1972) and may continue to feed when groundwater levels are elevated.
The two paleochannels are separated by an elevated section of Prosser Creek alluvium, referred to as the Prosser Creek hill (Fig. 4a). At low groundwater levels (< 1753 m), the western paleochannel is isolated from the reservoir by the Prosser Creek hill. At elevated reservoir pool elevations (1777.9 m), seepage occurred along the cut slope adjacent to the spillway chute during the 1995 test fill. Seepage along the cut slope was observed at 1768.4 m elevation at a reservoir pool elevation of 1777.9 m with the seepage elevation continuing to increase as the pool level increased (USACE, 1996). The western ends of the three ERT profiles closest to the spillway chute, profiles 3a, I, and J, exhibit a consistent and clear explanation for what minimum groundwater levels are necessary to overtop the Prosser Creek ridge, that otherwise acts as a hydrologic barrier, and produce seepage near the spillway chute. The Donner Lake outwash-Prosser Creek alluvium contact intersects the cut slope surface between 1769 to 1771 m, which correlates quite well with the observed seepage elevation during the test fill after the initial breach of the ridge (Fig. 5).
Conclusions
Based on the 28 2-D ERT profiles acquired in a grid pattern and 28 1-D resistivity soundings acquired in 1966, the extent and thickness of the surficial Donner Lake glacial outwash deposits were mapped, including the identification of two parallel southwest-northeast trending paleochannels. The base of each paleochannel on its northeast end corresponds with the elevation of seepage and boils observed on the downstream side of the dam during past test fills. A ridge of relatively impermeable Prosser Creek formation was further imaged along the west side of the western channel, the elevation of which, in concert with reservoir water level, controls whether, and at what level, seepage occurs along the cut bank of the spillway. The hydrogeology surrounding Martis Creek Dam is thus to first order controlled by (1) differences in hydraulic conductivity between glacial outwash and lacustrine alluvium and (2) the subsurface distribution of both in relation to the reservoir pool. Our work demonstrates the strong correlation between the geophysical interpretations and historical seepage observations. The more complete understanding of the subsurface hydrologic network provided by these investigations permit more informed management decisions in mitigating the hazards associated with the seepage.
Hidden Dam
Introduction
Hidden Dam is a rolled, earth-fill dam constructed by the USACE to provide flood control, irrigation water supply, and recreation. Completed in 1975, the dam is located on the Fresno River, about 15 mi (24 km) northeast of Madera, California in the Sierra Nevada foothills (Fig. 6). The gross pool of Hidden Dam reservoir, or Hensley Lake, is more than four times larger than Martis Creek reservoir with an expected water storage of 90,000 acre-ft (0.11 km3), corresponding to a maximum reservoir elevation of 540 ft (165 m). At its crest, the dam is 5700 ft (1737 m) in length with a maximum height of 184 ft (56 m) above the streambed. The crest elevation is 561 ft (171 m) (USACE, 1977; Cedergren, 1980a, 1980b).
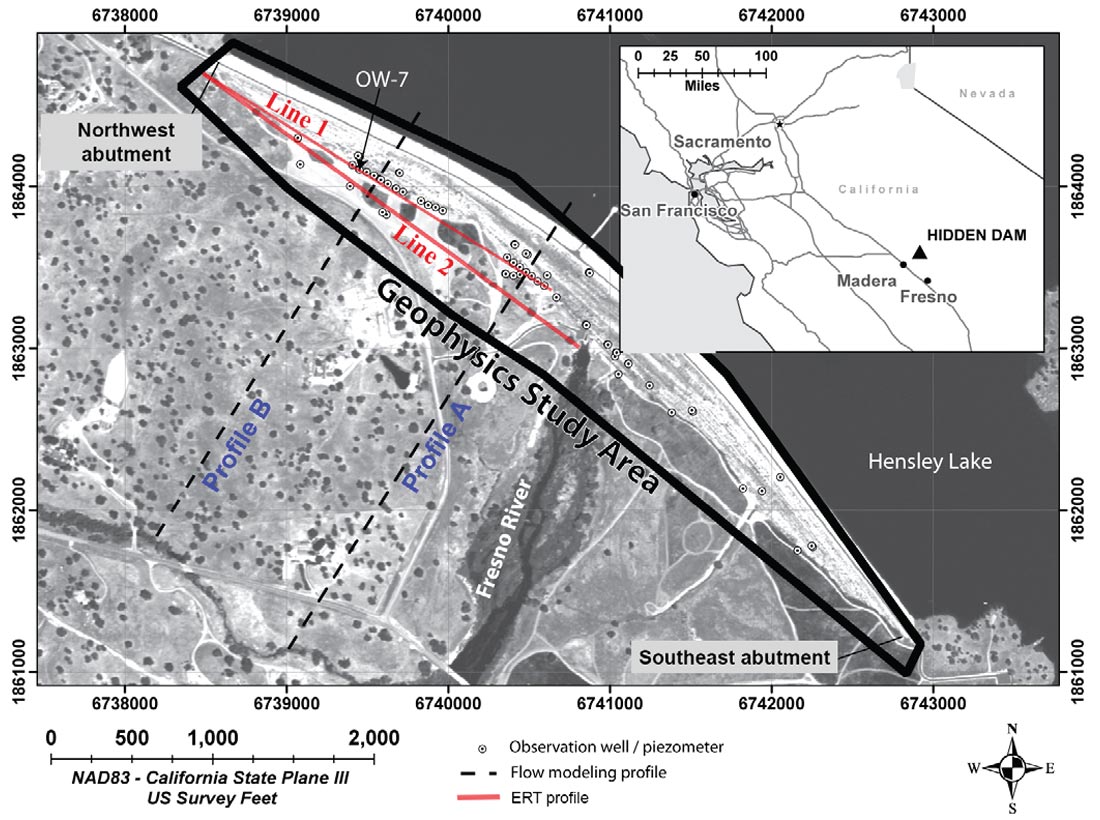
The northwest downstream abutment has a history of seepage and is the main focus of this effort. Based on a study completed in 1980, data from sixteen piezometers and fourteen observation wells (Fig. 6) indicated significant subsurface pressures, including several with piezometric surfaces higher than the ground surface, at a low pool condition of 484 ft (148 m). Flow net analyses calibrated to the observation well data suggested that very large uplift pressures could exist at gross pool, potentially leading to erosion in the foundation. These analyses also indicated that topographically low areas on the downstream side focus seepage through the foundation. As a result of the seepage study, a drainage blanket with a subdrain system was installed across most of the northwest downstream abutment to rapidly drain seepage in the area and additional piezometers and observation wells were installed and monitored (Cedergren, 1980a; 1980b). Groundwater and seepage flow are most likely controlled by a combination of mechanisms at this site: (1) reservoir pool elevations, (2) downstream surface topography, (3) the existing foundation geology, and (4) the presence or absence of the horizontal drain along the downstream portion of the dam.
In May 2009, the USGS completed a geophysical survey to better understand the hydrogeology and seepage-related conditions through the dam foundation. Seepage through the embankment materials is not addressed in this study. Two complementary methods, SP and ERT, were selected to (1) identify present-day seepage areas that may not be evident because of the effectiveness of the drainage blanket in redirecting seepage flow and (2) provide information about subsurface geologic structures that may control subsurface flow and seepage (Minsley et al., 2010; 2011). The results of these surveys, in combination with available observation well data from the site, were used to help constrain electrokinetic models constructed to determine the primary hydrogeologic controls on seepage (Minsley and Ikard, 2010).
Site geology generally consists of 0-30 ft (9 m) of residual soil, slope wash, and alluvium (sands, silts, and clays) overlying Sierra Nevada batholith-derived granites and associated metamorphic rocks. On average, up to 60 ft (18 m) of variably weathered and decomposed granite is present below the overburden with evidence of decomposed material extending down to depths of 140 ft (43 m) in places. More competent rock underlies the decomposed material. Jointing of varying densities and degrees of clay fill was observed during excavation of the foundation area during construction (Bateman et al., 1963; USACE, 1977)
Methodology
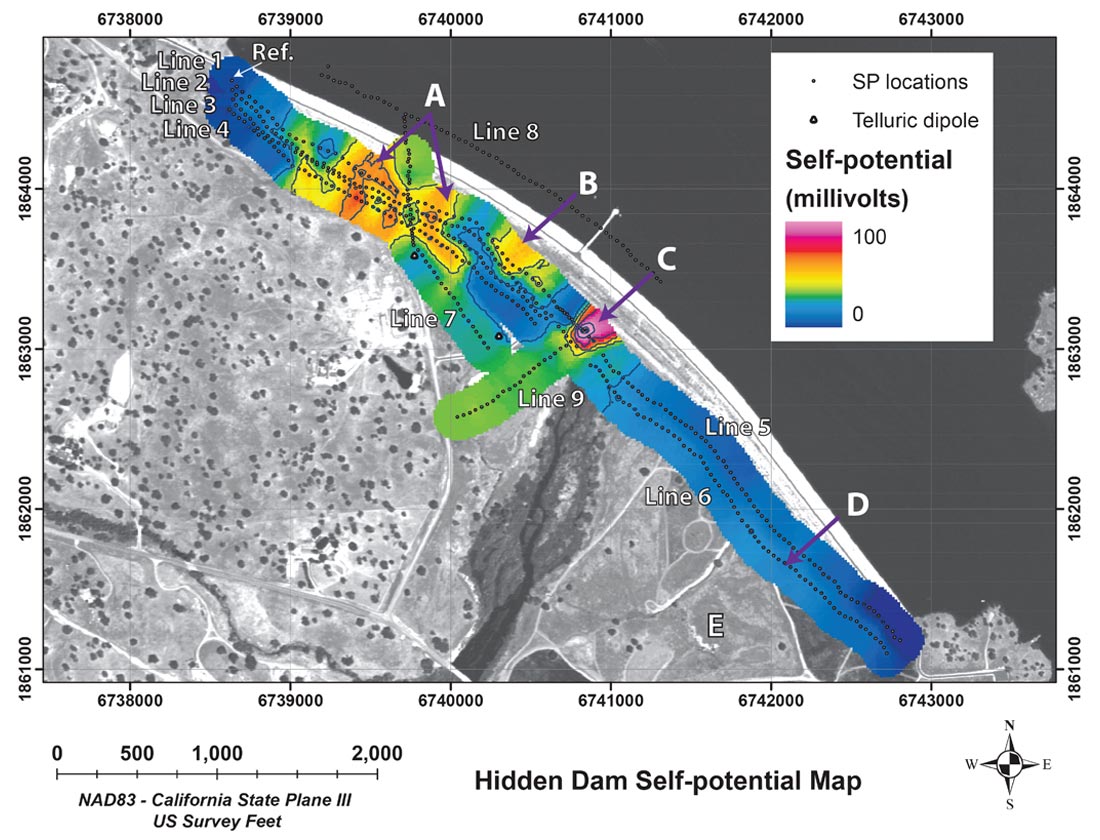
The SP and ERT methods were utilized to gain a better understanding of the hydrogeologic conditions at the site. The SP method is directly sensitive to seepage, and ERT provides an indication of the subsurface hydrogeology beneath the dam foundation. In combination, these methods provide useful constraints for the electrokinetic modeling. The survey was scheduled for early May 2009 to coincide with the seasonal maximum reservoir elevation and greatest seepage potential. Historical maximum reservoir elevations occur between April and June with average elevation gains of 40-50 ft (12-15 m). Reduced seepage is expected between September and January when the reservoir elevation is typically near or below 470 ft (143 m). The 2009 maximum reservoir elevation only reached 490 ft (149 m), which is relatively low, but is still above the 484 ft (147.5 m) level recorded during the 1980 seepage study (California Department of Water Resources Data Exchange Center: http://cdec.water.ca.gov/). As was done for the Martis Creek Dam survey, the reference electrode method and non-polarizing Pb/ PbCl electrodes were employed. At each of the 512 stations, three shallow holes were dug and five measurements per hole recorded. Nominal station spacing was 40 ft (12 m). Nine SP lines were acquired, the majority of which parallel the northwest downstream toe to focus on the historical seepage area, but two lines extend to the far southeastern end to identify other possible seepage areas and a single line on the upstream side on the northwest side (Fig. 7). The reference electrode was buried on the downstream side of the northwestern abutment and was assigned a value of 0 mV. All SP measurements are reported relative to the reference electrode, and a smoothly varying map of inverted station potentials was generated. The processed SP map data honors (1) measurements along each line, (2) error estimates from the 15 measurements at each station, (3) electrode drift, (4) unique potential values at line intersection points, and (5) Kirchoff’s law, requiring a zero potential drop along any closed loop (Minsley et al., 2008). The same processing and inversion procedures were followed for the three Martis Creek Dam SP surveys.
Two, subparallel ERT profiles were acquired along the northwest half of the downstream toe (Fig. 6). Both inverse Schlumberger array profiles were acquired with 120 electrodes per layout and a 10 ft (3 m) electrode spacing. The ERT survey objectives were to (1) identify potential seepage areas associated with subsurface lithologic changes or zones of relatively high joint or fracture density and (2) determine depth to bedrock.
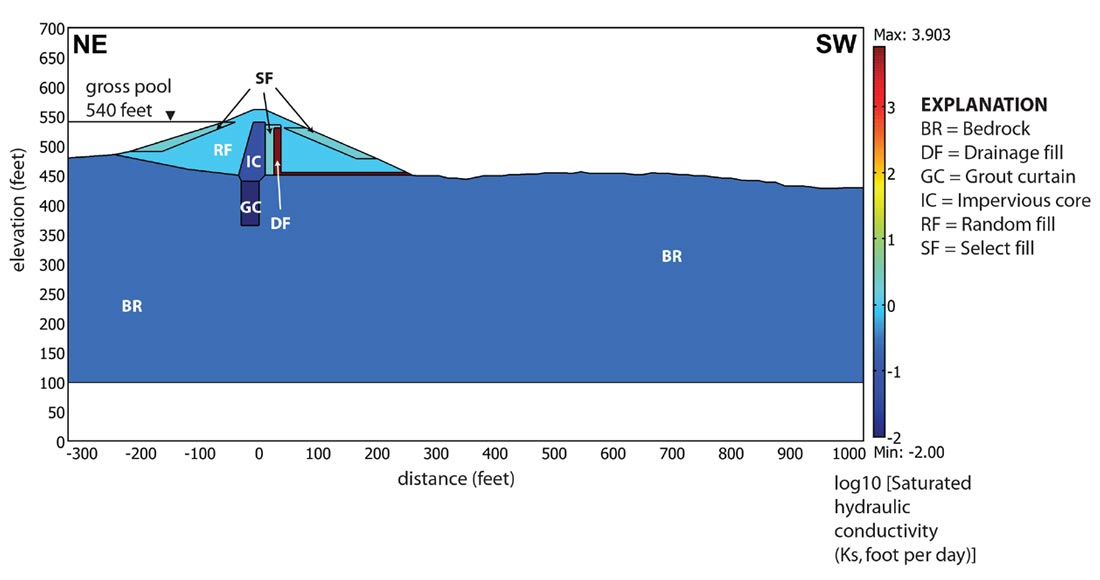
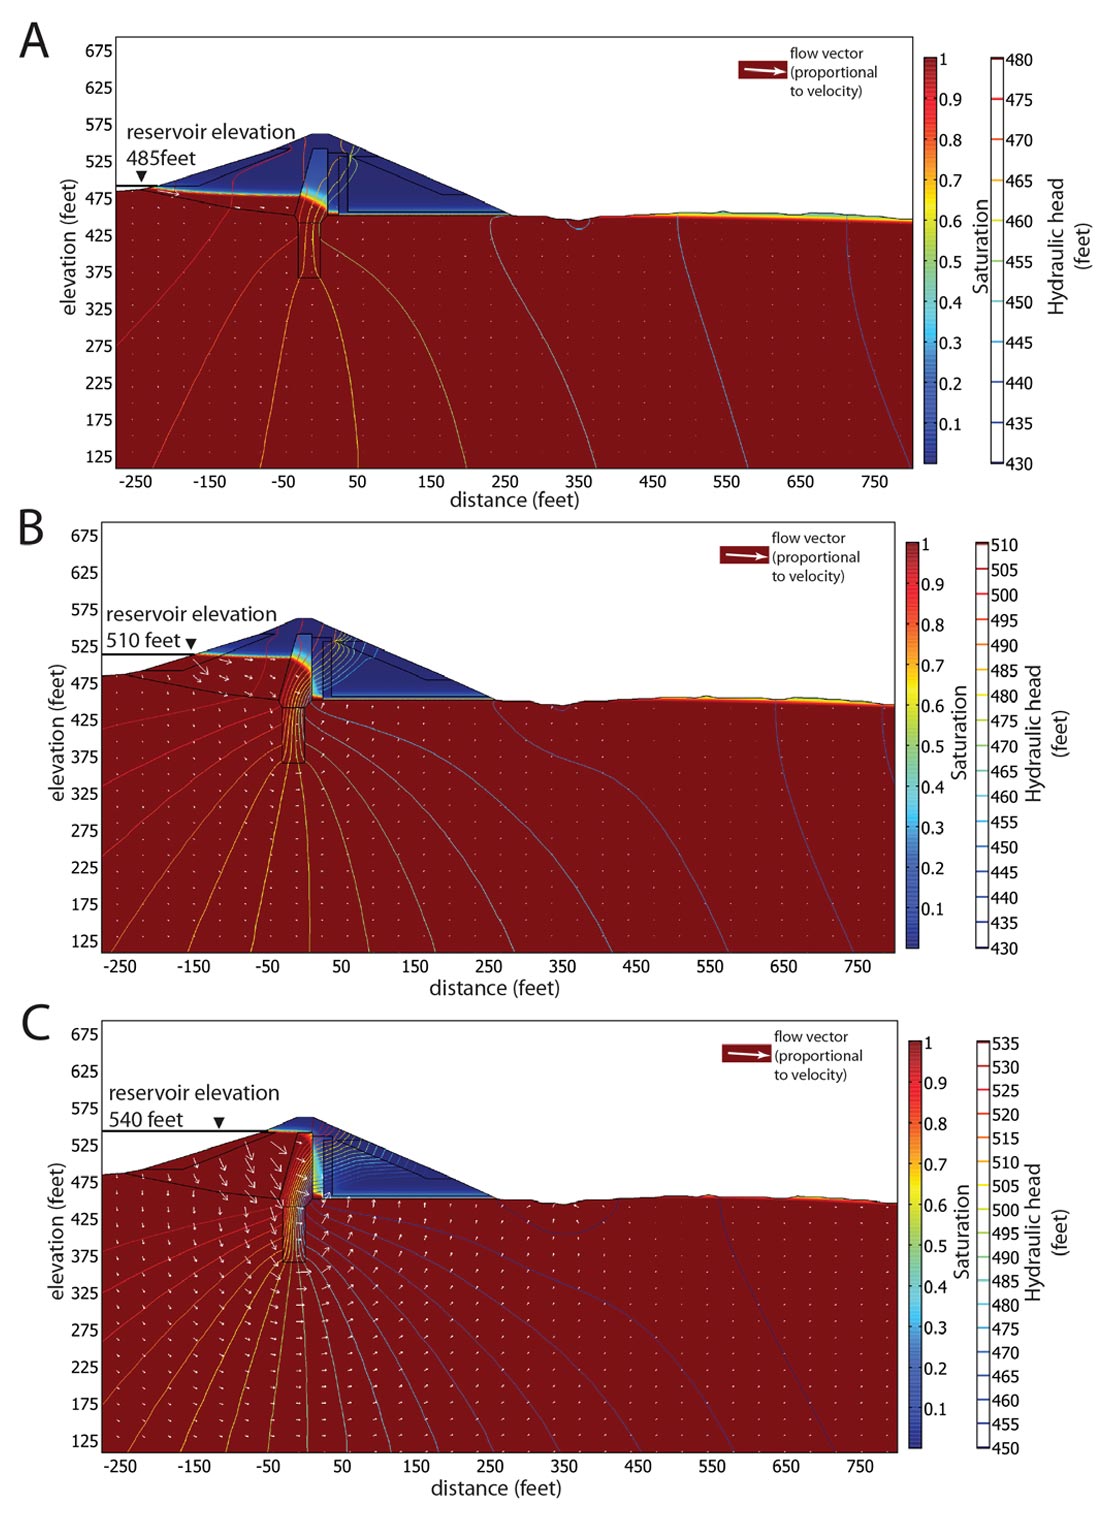
Two-dimensional electrokinetic models, each representative of likely hydrogeologic scenarios at Hidden Dam, were carried out to supplement information about seepage provided by the geophysical surveys and historical piezometer and observation well data. Hydrogeologic models for the flow simulations are based on information from the dam foundation report and known hydrogeology of the site (Cedergren, 1980a, 1980b; USACE, 1977). The finite element modeling package, COMSOL Multiphysics version 3.5, was utilized to solve the steady-state Richards equation for variably saturated groundwater flow (Freeze and Cherry, 1979). The van Genuchten (1980) model was used to quantify the water retention properties of the materials inside the dam and to parameterize the Richards equation. Bulk electrical resistivity was predicted for the various flow scenarios by incorporating the dynamically calculated saturation into Archie’s law (Archie, 1942), and the self-potential response was predicted by coupling the flow equations to the governing equations for electrostatic potential. Five different modeling scenarios (Table 1), designed to be representative of changes in internal structure and foundation properties along the length of the dam were each run for three reservoir elevations: 485 ft (148 m), 510 ft (155 m), and 540 ft (165 m). At each reservoir elevation, predictions can be made for flow throughout the model, saturation, seepage at the ground surface, subsurface pressure, bulk electrical resistivity, or self-potential. Figure 8 shows the basic model geometry used for the flow simulations, where the geometry and hydraulic properties of the various embankment units are derived from the foundation report (USACE, 1977). Minsley et al. (2011) contains additional detail on the flow modeling governing equations and the relevant hydraulic properties used for the various units.
| Flow scenario | Description |
|---|---|
| Table 1. Summary of models investigated through flow simulations. | |
| 1 | “Baseline” model shown in Fig. 8 uses topography extracted along flow Profile A (Fig. 6) |
| 2 | Same units as scenario #1, but using topography extracted along flow Profile B (Fig. 6) |
| 3 | Same as scenario #1, but no high hydraulic conductivity horizontal drainage fill (DF) |
| 4 | Same as scenario #1, but with a thin (20-30 ft; 6-9 m) sediment layer with higher hydraulic conductivity than the underlying bedrock on the downstream side of the dam |
| 5 | Same as scenario #1, but with a thick (300 ft; 91 m) sediment channel over bedrock connecting the upstream and downstream portions of the model |
Hydrogeophysical and Electrokinetic Model Results and Discussion
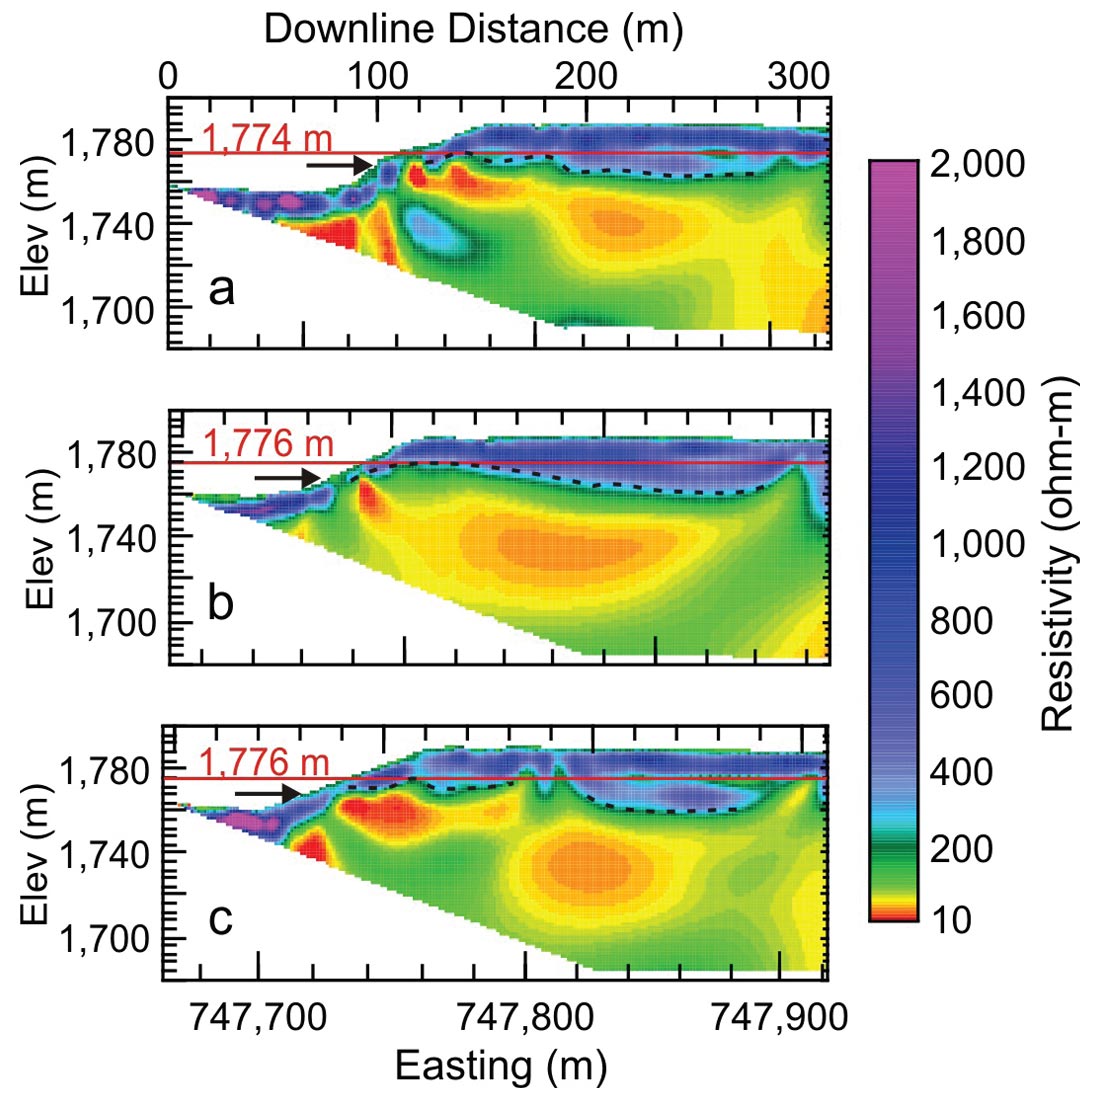
The self-potential results indicate several areas of elevated values interpreted to indicate upward groundwater flow (Fig. 7). Locations A and B are spatially broad areas of elevated self-potential (50-60 mV) and are co-located with known seepage areas from the 2008 study and the drainage blanket. These anomalies are located in topographically low areas between several mounds and also correlate well with a 400 ft (122 m) wide lower resistivity zone (Anomaly E) observed on both ERT profiles, interpreted as an alluvial valley between more electrically resistive bedrock highs (Fig. 9). The cause of the thin, shallow discontinuous resistor located 30 ft (9 m) deep within the alluvial valley on both profiles is unknown but may indicate a zone of lower porosity or permeability. At about the same depth as this thin resistor are several highly resistive, vertical features that may represent more competent granitic highs, but their true three-dimensional character is not well resolved by the 2-D profiles. The high resistivity area of Anomaly G that reaches the surface correlates with several large granite outcrops. The mounds observed on the ground surface on the downstream side of the dam were expected to be more resistive features in the shallow subsurface, but the moderate resistivities in the ERT profiles coincident with the surficial mounds indicate decomposed, weathered, or highly fractured/jointed granite.
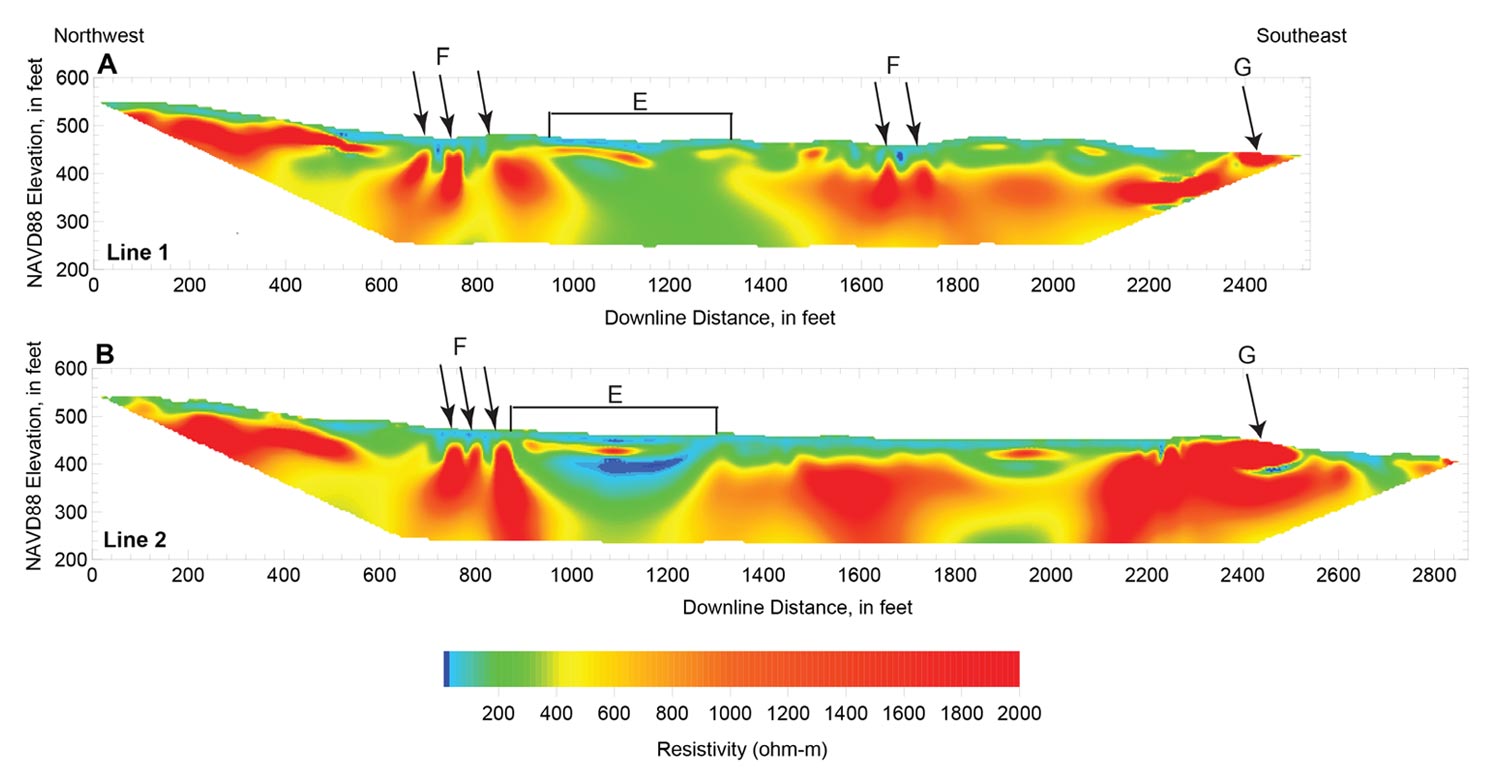
The magnitude (+170 mV) and peaked character of SP location C, located immediately around and above the fenced-in area surrounding the outlet works, suggests the possibility that this could be related to piping or internal seepage through the embankment rather than the foundation seepage associated with locations A and B seepage areas (Fig. 7). Despite the possibility this is a cultural-related artifact due to its proximity to the dam outlet structure, arguments for seepage include (1) noticeably wetter soil and greener vegetation in the vicinity of the anomaly and (2) the fact that metallic cultural sources most often produce negative SP anomalies. Location D, a very broad, low amplitude positive anomaly, may be related to relatively weak upwards seepage that does not intersect the ground surface but continues mostly to the southwest along the local hydraulic gradient. This broad anomaly may be related to location E, which is a small area of focused seepage in a topographic low noted by Cedergren (1980a).
Comparing the geophysical data and piezometer and observation well data with the modeling results provides further insight into the dam foundation seepage conditions. Only the electrokinetic modeling results for Profile A scenario 1 are shown for illustrative purposes (Fig. 10). Modeling indicates that rising reservoir elevations result in progressively increased saturation in the upstream portion of the embankment and increased seepage flow through the dam. Rising reservoir elevations result in progressively increased saturation in the upstream portion of the embankment and flow through the model. Based on comparison with scenario 3 models (not shown), the high hydraulic conductivity horizontal drainage fill (DF) is effective in rapidly draining flow to the toe of the dam and maintains unsaturated conditions in the downstream portion of the embankment. These modeling results also confirm the focusing effect that the downstream topographically low areas have on seepage patterns, consistent with the 1980 study findings and the conclusions of Minsley et al. (2011).
The presence of a thin sedimentary layer over bedrock (scenario 4) results in moderately increased seepage in the downstream area with a greater proportion of the seepage through the sediment and bedrock rather than through the embankment. This is a direct result of the net increase in hydraulic conductivity in the foundation materials. Lower water levels in the observation wells are also predicted. The addition of an alluvial channel that connects the upstream and downstream sides of the dam below the foundation (scenario 5), as indicated by the ERT results, leads to substantial increases in volumetric seepage under the dam but predicted water levels, or pressure, in observation wells are comparable to scenario 1 results, indicating no significant increase. Increased hydraulic conductivity in the alluvial channel leads to increased groundwater flow, but the pressure gradient, defined by the ratio of flow to hydraulic conductivity, remains unchanged. This suggests that water level data alone may not be a good indicator of relative amounts of seepage beneath and through the dam if the wells are located in different geologic units (Minsley et al., 2011). For a given scenario, the predicted SP response scales with seepage due to increased flow, but increased seepage at one location with elevated hydraulic conductivity does not necessarily generate a larger SP response than an area with lower hydraulic conductivity and reduced seepage due to the counteracting role of electrical resistivity and excess charge in the SP response. An elevated SP response is observed, however, when the horizontal drainage fill (DF) is absent because of increased seepage beneath the dam (Minsley and Ikard, 2010).
Conclusions
Self-potential and ERT survey results were used to identify subsurface features or conditions that may affect flow patterns and seepage at the site. In general, it is likely that the geometry of the more competent (more resistive) bedrock is a strong controlling factor for subsurface flow paths. Regions of thicker alluvium or weathered granite will be preferential pathways for flow. This subsurface structural geometry, in conjunction with the surface topography, is likely the largest factor contributing to the observed seepage. Dynamically coupling flow simulations with geophysical responses can be a powerful survey design tool to test the sensitivity of various geophysical measurements to the expected subsurface behavior (Minsley et al., 2010), and can also be used to evaluate the validity of the assumed hydrogeologic model by comparing measured data with predicted responses. Additional details on quantitative prediction results are available in Minsley and Ikard (2010) and Minsley et al. (2011).

Acknowledgements
Both projects were carried out with the support of the USACE Sacramento District, under the supervision of Lewis Hunter. We are grateful for the field assistance provided by Chad Ailes, Erika Curry-Elrod, Katie Jeffcoat, and Jonah Sullivan.
Disclaimer: The use of trade names is for descriptive purposes only and does not constitute endorsement by the U.S. Geological Survey.


Join the Conversation
Interested in starting, or contributing to a conversation about an article or issue of the RECORDER? Join our CSEG LinkedIn Group.
Share This Article