Abstract
Pore-pressure distribution within the clastic and carbonate Mesozoic sequences at the Volve oil field in the Central North Sea is particularly interesting due to the presence of two distinctive pressure regimes within the Jurassic sandstones: one hydrostatic and one moderately overpressured. In this study, we used pressure data from 14 wells to investigate the lateral and vertical changes in pore pressure throughout the field. This approach used both a modified Eaton’s method, including lithology- and age-controlled normal compaction trends, and a hydrostatic pressure component with corrections for temperature and pressure. An understanding of the region’s complex tectonic and depositional history was also required.
Building a coherent pressure, lithology and structural model is of critical importance as it can influence how the reservoir compartments are produced, help model the reservoir compaction and depletion, and optimize well designs to reduce drilling and completion risks. Even though oil production in this field was abandoned, the approach and results of this study could be used in the discovery and assessment of new hydrocarbon fields in the same basin or in similar sedimentary and tectonic environments.
We analysed the overpressure mechanisms, based on pressure-induced changes in the sediment’s acoustic velocity and density. We determined that overpressuring in the study area was primarily caused by disequilibrium compaction with a secondary mechanism of hydrocarbon generation and pressure transfer on the structural crest. The pore-pressure prediction model was then applied to obtain the pore-pressure field, using results from simultaneous inversion of 3D seismic data. Finally, we integrated the pressure field with a detailed structural and lithological model to evaluate the reservoir connectivity and the complex relationships between pressures, lithology, and porosity distribution, as well as fault geometry and sealing properties.
Introduction on overpressuring mechanisms and overpressure-induced changes in rock properties
Abnormally high pore pressures are frequently observed within all Cretaceous and Jurassic sediments throughout the Central North Sea Basin. Within these successions, pore pressure can have a complex distribution due to the interplay between the mixed deposition of clastics and carbonates, combined marine and fluvial deposition, presence of kerogen-rich source rocks, diverse hydrocarbon types, and the basin’s complicated evolution, which includes rift and salt-related deformation, large fluctuations in the sea level, and more recent glacial events. Understanding this complex geology is important for pore fluid pressure modelling because the overpressures observed within these formations could be the result of multiple, and fundamentally different, generation processes, such as hydrocarbon generation from kerogen (Cayley, 1987), mechanical consolidation, chemical compaction (Holm, 1995; Bjorlykke, 1999), or lateral flow (Gaarenstroom et al., 1993).
Awareness of the originating mechanisms and the relative magnitude of generated overpressures, along with the regional and local geology, help with understanding the historical evolution of pore pressures and their present-day states as a cumulative result of pressure generation and dissipation over geological time. When secondary mechanisms for overpressure components become significant, overpressure may be difficult to accurately predict using a particular method and may require decomposition and separate prediction of each mechanism-related component (Suwannasri et al., 2014). Selecting an appropriate prediction method will increase estimation accuracy (O’Connor et al., 2011a), and all methods need to be adapted to each study area’s specific conditions.
The vertical effective stress σv eff is the stress component carried by the rigid rock matrix. It is affected by the total vertical stress σv tot imposed by the overlying rock column, as well as by the internal pore pressure PP within the matrix:

where σ is the effective stress coefficient, usually approximated with the Biot coefficient.
Experimental observations showed that the elastic moduli, and therefore the velocity, increase with increasing effective stress due to the closure of microcracks and changes to the intergranular contacts in a rock (Peacock et al., 1994). Therefore, it is not the individual magnitudes but rather the difference between the total vertical stress and pore pressure, that affects the velocity and other properties, such as density and resistivity. This dependency constitutes the basis for pore-pressure prediction methods (e.g., Eaton, 1972).
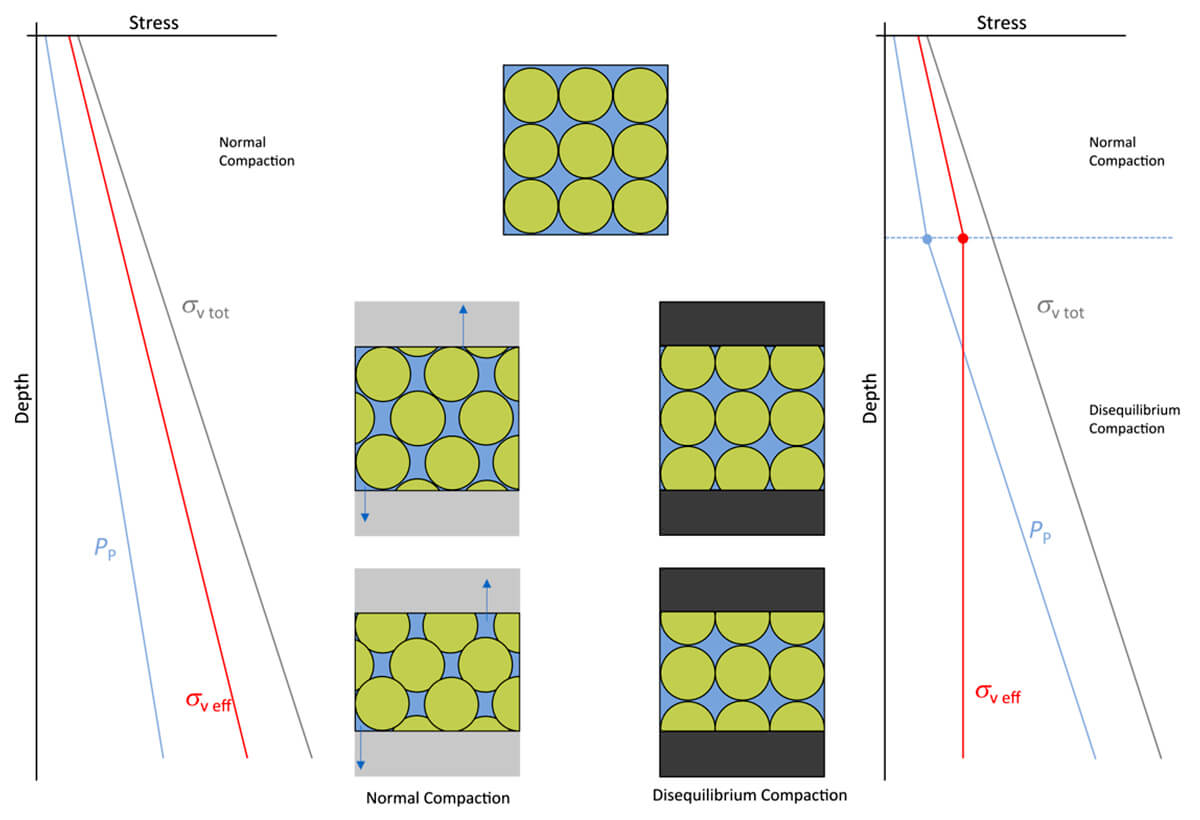
During burial, sediments tend to decrease in porosity as they are compacted and pore fluids are expelled. This decrease in porosity is referred to as normal compaction, and a loading curve is described with a decrease in porosity for increasing effective stress. The fluid pressure in a normally compacted rock is hydrostatic (Fig. 1, left). Overpressure results when a process occurs to increase the pore pressure above the normally expected hydrostatic pressure. Processes creating overpressure involve low-permeability rocks (Swarbrick, 2008) and are separated into loading and unloading mechanisms.
Loading mechanisms primarily include disequilibrium compaction, which develops in low-temperature environments and requires strict sealing conditions (Zhao et al., 2018). Unloading mechanisms, on the other hand, occur at deeper burial depths and in temperature environments of over 70 °C. They include fluid expansion (hydrocarbon generation), diagenesis (mineral transformations and cementation), and pressure transfer (Zhao, 2011; Zhao et al., 2018; Swarbrick, 2008). Loading mechanisms are the main source of overpressure investigated in this study
Loading mechanisms
Loading mechanisms for overpressure occur with rapid sedimentation and suppressed compaction. In these cases, sediments can imperfectly de-water (they are at disequilibrium) and porosity is preserved (Chapman, 1983), resulting in high-porosity anomalies at great depths. As shown on the right side of Figure 1, the vertical effective stress in disequilibrium compaction remains approximately constant with burial due to the pore pressure increasing at a similar rate to the total vertical stress (Li et al., 2019).
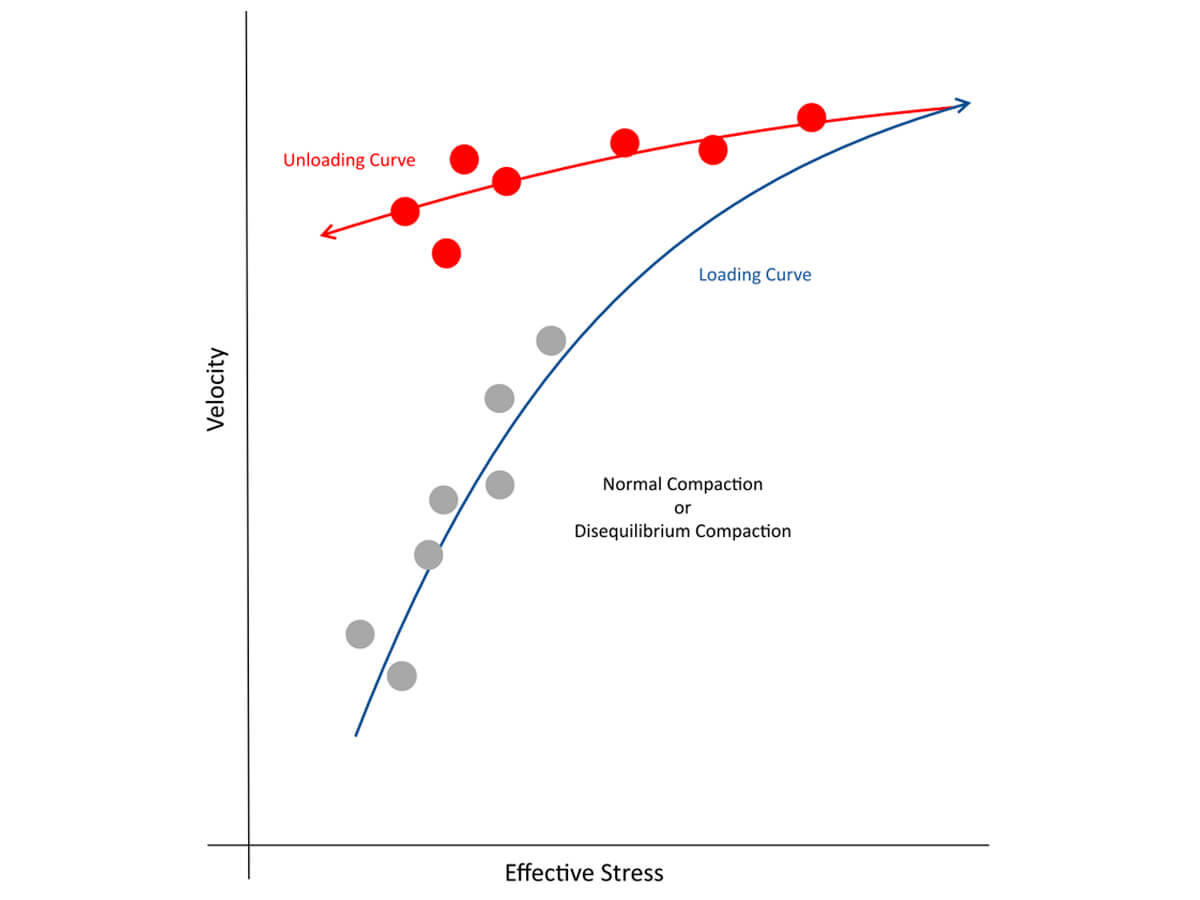
The behavior of disequilibrium compaction leads the velocity-effective stress curve to follow that of normally compacted sediments (Fig. 2). Both quantities remain nearly constant (as illustrated) or increase slightly at a slower rate than in normal pressure conditions (Bowers, 2001). The overpressure magnitude increases with increasing depth and is controlled by permeability, rock compressibility, and sedimentation rate (Swarbrick, 2008).
Unloading mechanisms
While loading mechanisms depend on the lithostatic stress (total vertical stress), unloading mechanisms are independent of the overburden effects. This independence from total depth means that the pore pressure increases at a rate faster than the total vertical stress. There is no requirement of a significant porosity anomaly for these overpressure mechanisms.
Fluid expansion, from the generation of hydrocarbons from organic material, can cause the sediments to rebound and recover part of their original volume (Opara, 2010). This process is an elastic unloading mechanism, which has a significant effect on velocity, with only a small effect on density. Similarly, overpressure resulting from pressure transfer between sediments is also an elastic process that decreases velocity with no effect on density (Tingay et al., 2007; Tingay et al., 2009; Zhao et al., 2018).
Conversely, inelastic unloading mechanisms can occur from diagenesis causing mineral transformations. Mineral conversions change the rock microstructure and rock compressibility. Bound water in clay minerals may also be transformed to movable water. These combined effects often produce a decrease in velocity and an increase in density.
Within an overpressured interval, the dominant mechanism can be determined based on observed relationships between vertical effective stress, velocity, and density (Bowers, 1995; Bowers, 2001). Specifically, the relation between density and velocity can be used to differentiate elastic and inelastic unloading mechanisms (O’Connor et al., 2011a; Tingay et al., 2013; Zhao et al., 2018; Li et al., 2019). Figure 2 shows the behavior of overpressure from unloading mechanisms (red curve), where the increase in pore pressure decreases the effective stress and velocity, deviating from the behavior of the loading mechanisms. Because velocity is more sensitive to pore size, shape, and pore interconnectivity than density or porosity, it has been found to be more sensitive to changes in effective stress (Bowers and Katsube, 2002).
Geological settings
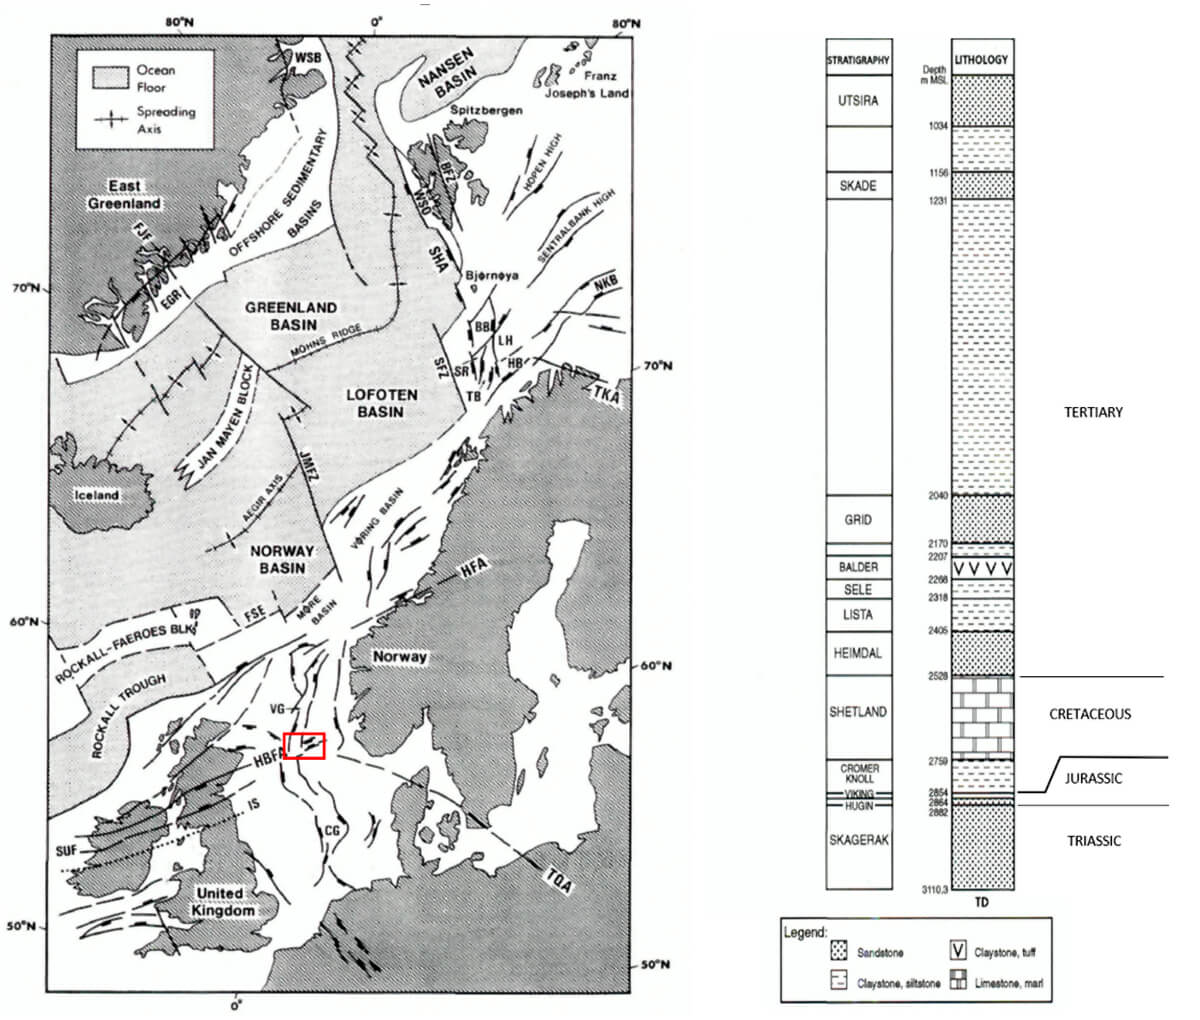
At the Volve oil field, rapid sedimentation and burial during the Cenozoic caused the accumulation of a thick sedimentary cover over the Mesozoic sequences. These sequences are structurally complicated, mainly because of the complex deformations that occurred in the Viking Graben during the mid-Jurassic to early Cretaceous extension (Fig. 3). Even though the field was decommissioned in 2016, an improved understanding of the excess pressure mechanisms, as well as the three-dimensional pore pressure distribution within the field’s structural framework, and how this relates to the trap integrity and distribution of hydrocarbons, could be very important in the discovery and evaluation of other fields in areas with similar depositional and burial evolutions.
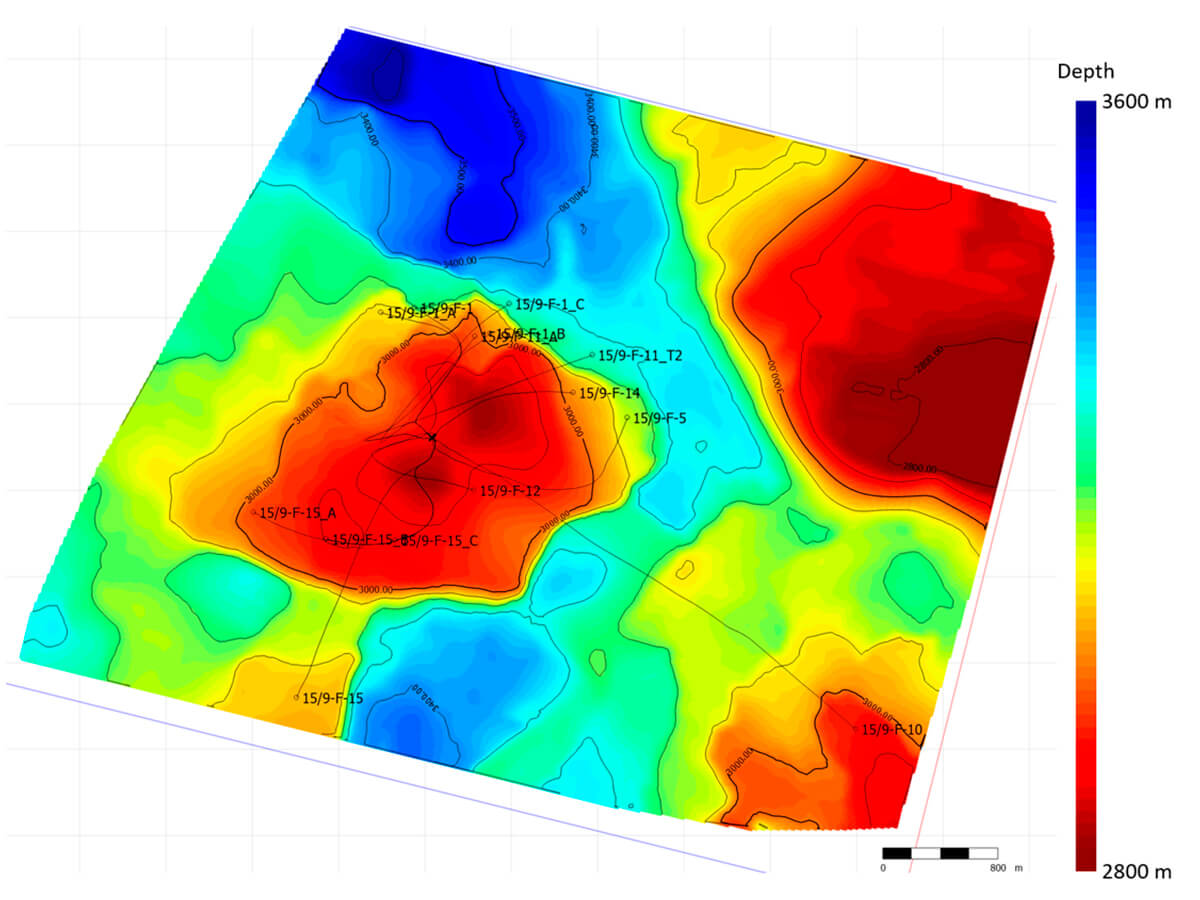
The Volve field consists of structural traps with hydrocarbon accumulations in the Jurassic Hugin Formation (Statoil, 1993). The reservoir is complicated on two levels. The first complication is tectonic, with a history of normal faulting and reverse fault reactivation. Additional tectonics occur due to salt movement and dissolution, which affects the Triassic and Jurassic formations. The second complication is due to the rapid lateral variation in reservoir thickness, resulting from syndepositional faulting, from fault-block rotations, and from periods of non-deposition and erosion. The depth structure map at the top of the reservoir is shown in Figure 4.
Because the reservoir is compartmentalized by faulting, the spatial distribution of pore fluid pressure is very important, as it carries information about the interconnectivity of the pore space and fluid flow within the reservoir. Individual compartments are characterized by the same magnitude of overpressure and are limited by pressure barriers, which control the magnitude of overpressure (Swarbrick, 2008). If the reservoir blocks are confined, fluid pressure can be either hydrostatic or abnormally high or low. The pressure will affect the rock properties, the amount of hydrocarbon in each fault-bounded block, and the possible reactivation of existing faults. These considerations can influence how each distinct compartment should be produced and can drive well designs to minimize drilling and completion risks (Zoback, 2015).
Pore pressure analysis and estimation
Within the study area, the Jurassic reservoir and caprock formations are buried under a thick sequence of approximately 2500 m of Tertiary clastic sediments, mostly shales, and 400 m of Cretaceous carbonates. We analyzed a total of 144 direct downhole measurements of formation pressures at 14 locations throughout the field, the majority from the producing Hugin Formation and some from the surrounding sedimentary units (Fig. 5). Most wells have encountered elevated pressures in the Cretaceous and Jurassic formations, with the top of the overpressure at approximately 2600 m. Higher pressures within the Cretaceous Shetland Group carbonates, as compared to the Jurassic Hugin Formation, suggest possible lateral pressure loss from the reservoir, at the field scale, through the complex fault system.
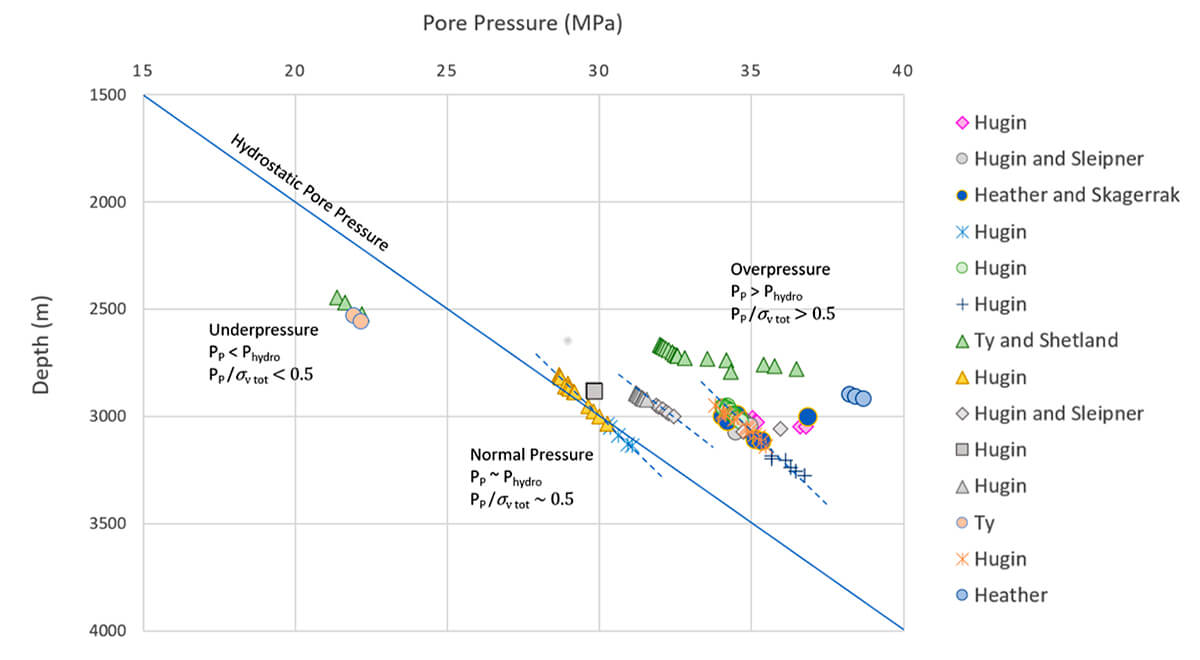
The pressure variation with depth suggests lateral reservoir compartmentalization. Different compartments are recognized from clusters of data from several wells that have the same overpressure magnitudes. The structural map showing the geometry of the fault system could help differentiate which faults are acting as permeability barriers and which faults are permitting lateral fluid movement. Two wells on the eastern side have hydrostatic pressures, and one of these wells has a pressure gradient four times the normal hydrostatic gradient, suggesting sealing faults or facies-controlled pressure.
Our methodology for characterizing the field was performed in three steps. First, we analyzed the pressure-generating mechanism from well data for both overpressured and normally pressured intervals using measured pressures and overburden stress. Next, we determined the pore pressure using Eaton’s method (Eaton, 1972), which we applied defining three velocity normal-compaction trends based on lithology and geological age. Finally, we integrated the pore pressure and effective vertical stress with results from rock-physics modelling and the elastic properties resulting from simultaneous inversion. This characterization permitted the separation of lithologies and pressure regimes in all Mesozoic formations, in addition to the separation of the pressure mechanisms within the Hugin reservoir.
1- Identifying the overpressuring mechanisms based on overpressure-induced changes
Overpressure in a sediment is a disequilibrium state that evolves constantly during the generation and fluid dissipation phases. The system’s evolution is controlled by complex and interdependent physical and chemical processes related not only to the overpressure mechanism, but also to the permeability, fluid type, and timing (Swarbrick, 2008).
Within the study area, the Hugin sandstone reservoir has an average porosity of 23% and is located at an average depth of 3000 m with a temperature of 95 °C. These depth and temperature conditions allow for thermal processes (kerogen to oil and gas conversion, oil to gas conversion, and mineral diagenesis). The reservoir caprock is formed from the low-permeability, organic-rich Upper Jurassic Draupne and Heather formations of the Viking Group, which are the main oil-prone source rocks of the Norwegian North Sea (Badics et al., 2015). Underlying the reservoir is the Triassic Skagerrak Formation, a sandstone with very tight porosity due to extensive cementation (Statoil, 1993), which may act as a vertical pressure barrier.
Within the reservoir, permeability varies greatly due to variable grain size and clay content. Because the pressure system is dynamic and tends to evolve towards hydrostatic conditions, it is greatly influenced by permeability, which controls the rate of pressure dissipation. As an example, overpressure dissipates more rapidly in high permeability sand units but more slowly in fine-grained sediments like shales, which typically have relatively lower permeability. In addition, the sedimentary cover contains a combination of clastics and carbonates with different compaction ways and differing mineralogical compositions. Therefore, predicting pore pressure can be complicated due to the possible superposition of several overpressuring mechanisms, and their cumulative influence on rock properties such as velocity and density.
In analyzing the overpressure mechanism, we focused on the Jurassic section as well as five wells with measured pore pressures in the Hugin Formation with sonic and density logs extending within or above the Cretaceous carbonate sequences. Two of these wells, located on the eastern side of the structure, were in hydrostatic conditions. The other three wells were in an overpressure regime, from which two wells had hydrostatic pressure gradients, and one well had a pressure gradient approximately four times higher, possibly due to a lack of lateral pressure communication from sealing faults or changes in facies.
The mechanism analysis is based on the behaviour of hydrostatic pressures and overpressures seen on the density, velocity, and vertical effective stress crossplots (Fig. 6). We estimated the vertical effective stress based on pore-pressure data and sonic and density log information. The relationships for the five wells between acoustic velocity, density, and vertical effective stress are shown in the form of Bowers diagrams. These diagrams show the following:
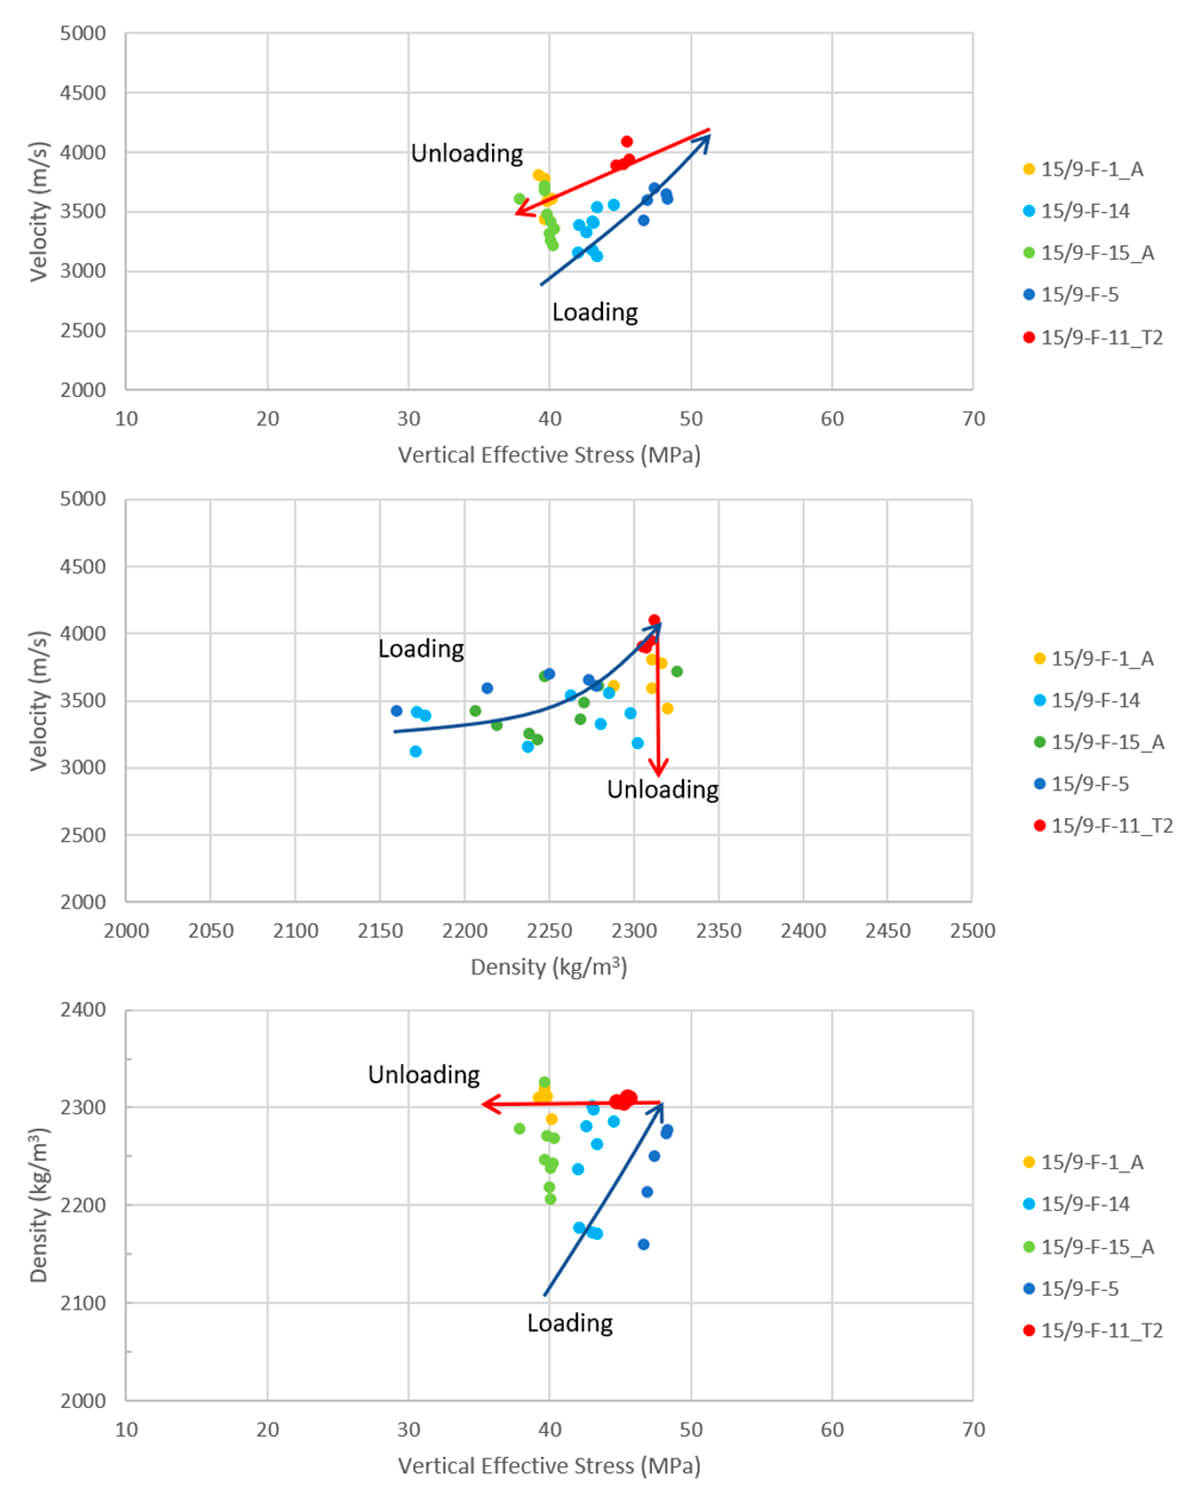
- On the acoustic velocity-vertical effective stress crossplot (top):
- velocity increases with increases in vertical stress for the two hydrostatic wells shown in light and dark blue;
- there is a slight decrease in velocity with a decrease in effective stress for the two overpressured wells shown in orange and yellow; and
- there is a reduction in velocity while the effective stress remains constant for the high-gradient pressure well in green.
- On the velocity-density crossplot (middle):
- the two hydrostatic wells (light and dark blue) show a significant decrease in density with decreasing velocity;
- the high-gradient overpressure well (green) mimics the behavior of the hydrostatic wells; and
- the overpressure wells with hydrostatic pressure gradient show no effect on density with decreasing velocity (orange and yellow).
- On the density-vertical effective stress crossplot:
- the normal pressure wells (light and dark blue) show a decrease in density with decreasing vertical effective stress;
- the overpressure wells (orange and yellow) show no density variation with decrease in vertical effective stress; and
- there is significant density variation for the high-pressure gradient well (green), although the effective stress remains constant.
The abnormally high porosities, and variations in density and velocity with the vertical effective stress for the two hydrostatic wells and the high-pressure gradient well, suggest a correlation between porosity and vertical effective stress, indicating that the main source of overpressures is disequilibrium compaction. The hydrostatic conditions on the eastern side occur where the structural spill point has been identified (Statoil, 1993). This location may indicate that the elevated fluid pressures, although initially generated throughout the entire area, could have dissipated.
Additionally, the constant density and decrease in velocity in the two overpressured wells suggest a secondary unloading mechanism. The three main unloading mechanisms are discussed below.
1. Mineral transformations
The mineralogical analysis of the reservoir cores shows small amounts of K-feldspar (4% vol.), kaolinite as the main clay mineral (3.84% vol.), and small amounts of mica-illite (1.2% vol.) (Statoil, 1993). Although the K-feldspar may react with kaolinite to form illite (increasing porosity and releasing water) (Huggett, 2005), the small quantities of these minerals and the complex factors controlling this and other clay mineral reactions – time, overpressure, pore fluid composition, and hydrothermal activity – suggest that it is unlikely that the observed elevated pressures could have a significant contribution from mineral transformations in this area, particularly when there is no corresponding increase in density.
2. Fluid expansion
This mechanism would involve the increase in fluid volume resulting from the transformation of the organic matter present in the caprock – formed by the low-permeability source rocks of the Jurassic Viking Group – and downward vertical migration of hydrocarbons into the adjacent reservoir sands. This expansion would have to be extensive over a thick interval to create high internal pore pressures, so that the overpressure would not be contained only locally within the caprock (Burrus et al., 1993).
3. Lateral pore pressure transfer
This is a pressure redistribution mechanism through which deeper higher pressures (possibly from the caprock source-rocks) are transferred to shallower depths through the dipping high permeability reservoir rocks or faults. This mechanism would cause higher reservoir crestal pressures than in the surrounding low-permeability layers, and their magnitude would depend on both the structural relief from the reservoir crest to the reservoir base and the burial rate and structural evolution (Yardley and Swarbrick, 2000; Swarbrick, 2008).
Of the mechanisms discussed above, we believe that the most probable secondary source of overpressure within the Hugin sandstones is a combination of fluid expansion followed by pressure transfer. The fluid expansion is most likely initiated in the overlying source rocks. Based on the relative permeabilities, the pressure of the source rocks is then likely transferred both downward to the reservoir and laterally towards the structural highs. This hypothesis is supported by the high-magnitude pressures measured in the caprock Heather Formation, with magnitudes around 10 MPa above hydrostatic pressure. If, instead, we assume that the increase in fluid volume starts in the reservoir and not in the caprock (e.g., from the conversion of oil to gas) this pressure component would not be confined to the structural highs but would also extend to the lower areas, where the reservoir and caprock are several times thicker.
This analysis considered, along with the large thickness and high-sedimentation rates of the Cenozoic shale-dominated sequences, the higher Cretaceous excess pressures compared to the reservoir pressures and the reservoir’s anomalous porosities. All together, these factors suggest that the primary overpressure mechanism is disequilibrium compaction, combined with pressure release over time, and a probable secondary mechanism, as described above. The initial overpressuring from disequilibrium compaction and de-pressurization of the reservoir over geological time has been previously identified by O’Connor et al. (2011b) in the Ula oilfield in the Norwegian North Sea. A previous study by Tingay et al. (2009) also found two overpressuring mechanisms in the Baram Delta Province in Brunei, corresponding to two different geographic and geologic domains using vertical effective stress and sonic velocity crossplots.
2- Pore pressure calculation method
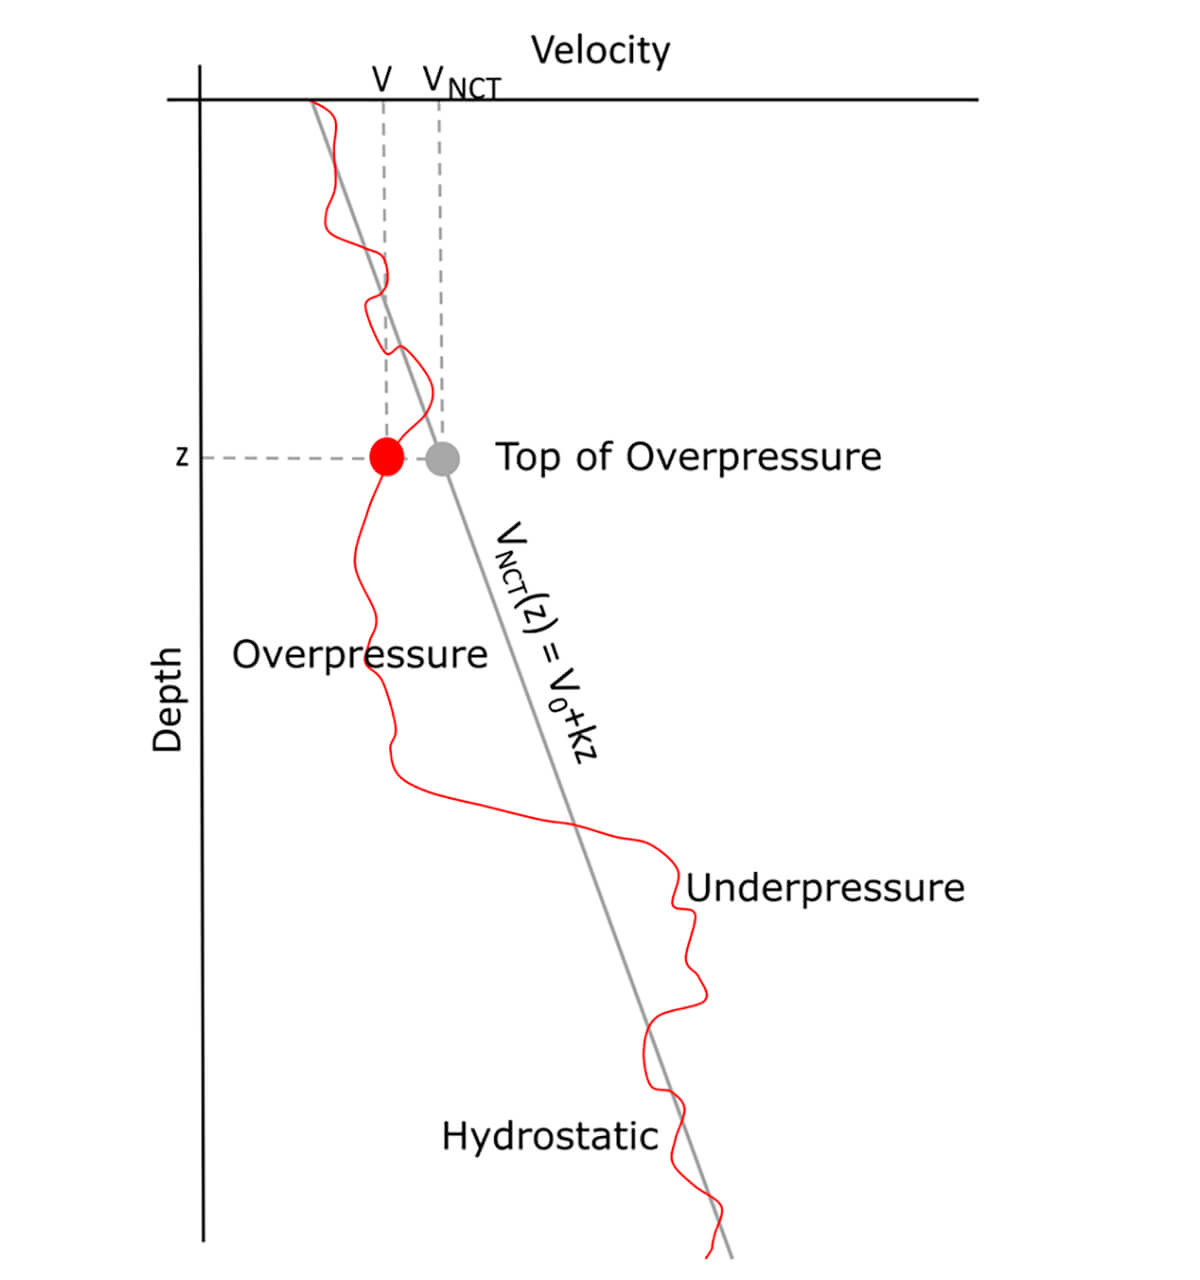
All pore pressure prediction methods, either empirical or basin modelling-based, contain uncertainties related to lithology, fluids, and the burial, exhumation, and uplift history of the rocks (Swarbrick, 2008). In this project, detailed analysis of the geological history, combined with results from the overpressuring mechanism analysis, suggest that disequilibrium compaction is the main mechanism for the generation of overpressures, and that, unlike density, the acoustic velocity is sensitive to the pressure transfer mechanism. As a next step, to model and match the pore pressures at wells, we used Eaton’s equation,

which relates the changes in the magnitude of the effective stress to changes in acoustic velocity, as a proxy parameter for porosity. In this equation, PP is the pore pressure, σv tot is the total vertical stress, Phydro is the hydrostatic pressure, α is the effective stress coefficient, and x is Eaton’s exponent, used as a calibration factor. The exponent is related to the velocity sensitivity to pressure (Sarker and Batzle, 2008), and is fitted so that a good match is obtained between the velocity and effective stress ratios resulting from equation (2). This method considers that differences between the measured velocity v and velocity predicted by the normal compaction trends vNCT may indicate that a formation is overpressured due to rapid burial resulting in a lower velocity than expected (Fig. 7).
We estimated the total vertical stress by integrating the rock densities over depth and correcting for water depth and atmospheric pressure:

where P0 is the atmospheric pressure, g is the gravitational acceleration, ρ is the density, and z is the depth.
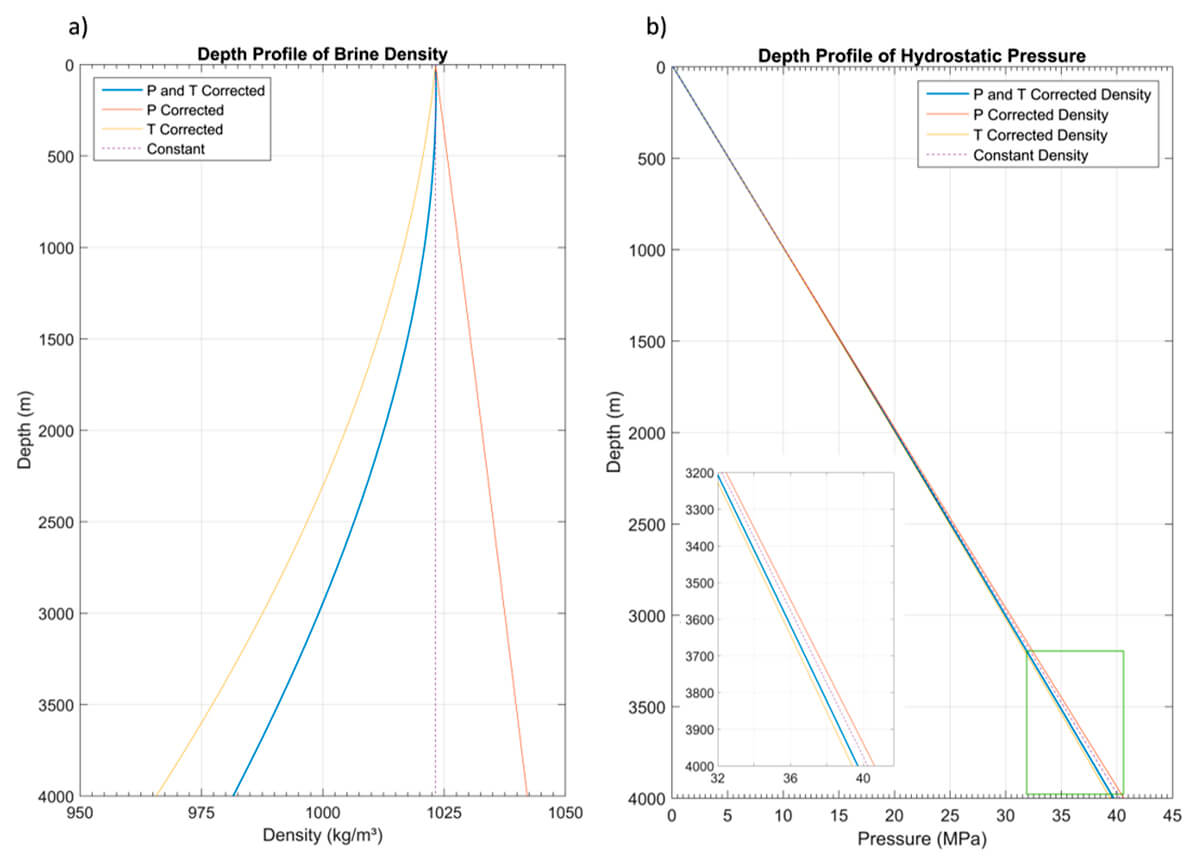
The hydrostatic pressure was determined using the density of saline water ρb(BW), corrected in depth for the local temperature and pressure conditions using the Batzle-Wang equations for fluid density (Batzle and Wang, 1992):

We assumed a water salinity constant with depth and equal to the salinity of the North Sea water (35,000 ppm), a temperature gradient of 0.03 °C/m, an atmospheric pressure of 0.1 MPa, and a temperature at seafloor of 7 °C. Within the reservoir, the hydrostatic pressure resulting from brine density being adjusted for geothermal gradient and pressure was nearly 1 MPa lower than for the uncorrected density (Fig. 8).
Normal velocity-depth trends are lithology-specific but challenging to interpret because mechanical compaction depends on whether the sediments are compliant or stiff at the time of deposition. For example, shales are deposited at an initial porosity of 65-80% and compact slowly, depending on the clay mineralogy, while sandstones have an initial porosity of 40-45%, decreasing rapidly to a depth of approximately 2500 m, below which any further porosity decrease is related to diagenetic changes (Swarbrick, 2008).
Predicting pore pressures in the environment around the Volve Field is complicated because the sediments are not exclusively siliciclastic, but alternate with shales and carbonate rocks. We used three separate normal compaction trends corresponding to the Tertiary, Cretaceous, and Jurassic sequences (Fig. 9). We interpreted the normal compaction trend within the shallow, predominantly shale clastics using the velocities measured in these shale intervals at four wells down to the Ty Formation, which is an underpressured Tertiary sandstone. Using this trend to estimate the pore pressures in the Cretaceous carbonates below this interval would predict abnormally low values, in contradiction with the measured pressures which are above hydrostatic. The normal velocity-depth trend used for the carbonate Shetland and Kromer-Knoll Groups was introduced by Japsen (1998), who suggested that the dominant mechanism for the observed overpressure within carbonates is mechanical and is caused by the preferential collapse of the larger pores. Japsen’s trend was obtained from data covering the entire lateral extent and depth range of the Chalk Group across the North Sea (the equivalent of the Shetland Group from the Norwegian sector) and was used in this study.
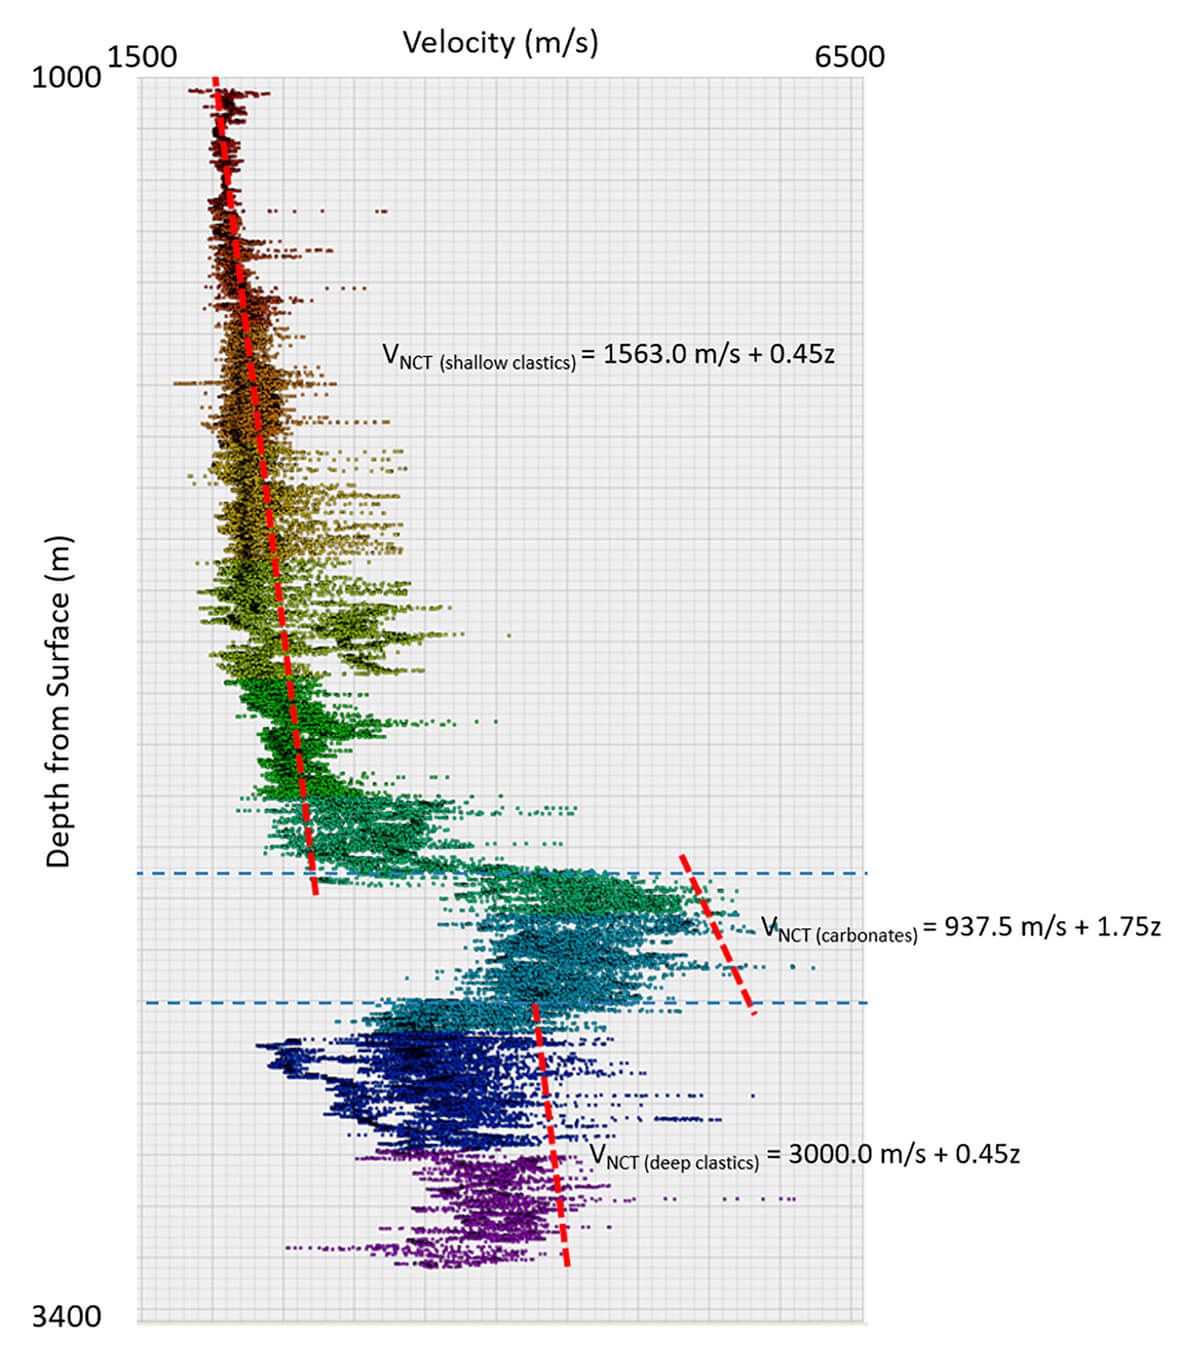
For the deeper Jurassic clastics, including the reservoir, the normal trend was a shift of the carbonates normal trend line with the intercept chosen based on the velocity measured at the base of the carbonates, as suggested by Weakley (1991) and Bowers (1995).
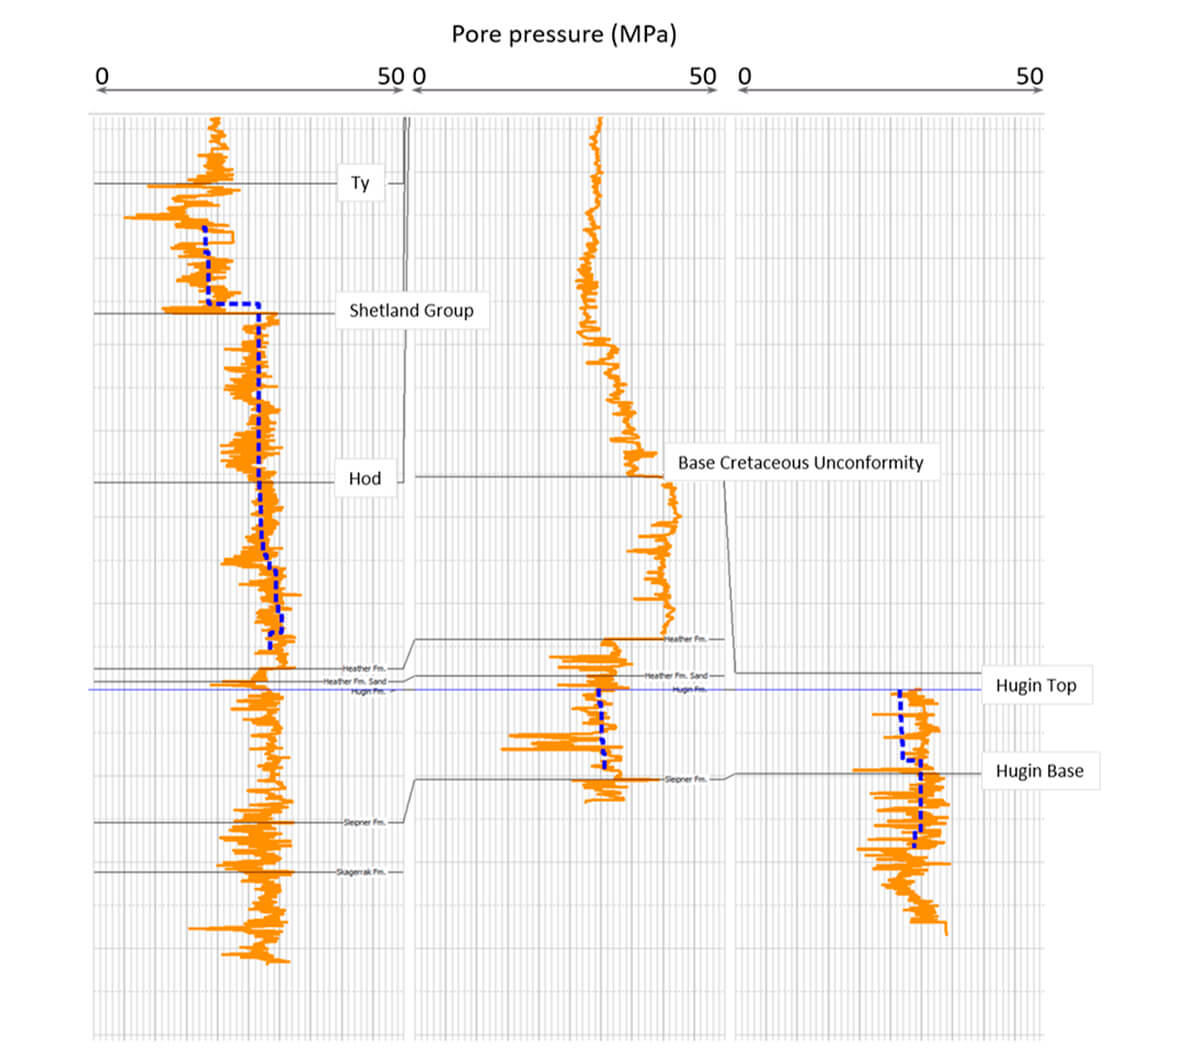
Figure 10 shows a comparison between the measured (blue) and predicted (orange) pore pressures for the Tertiary, Cretaceous, and Jurassic sequences. The exponent in the Eaton’s equation that best predicted the measured pressures was determined to be one, by fitting the data in all three cases. The same value of the exponent was found by Sarker and Batzle (2008) when modelling the pore pressure from sonic velocities in an overpressured well from the Norwegian sector of the North Sea. They suggested that, when using effective stress, the pressure and velocity have a 1:1 relationship and no exponent is needed to enhance the velocity response. Therefore, velocities are most sensitive to pressures when Eaton’s exponent is one.
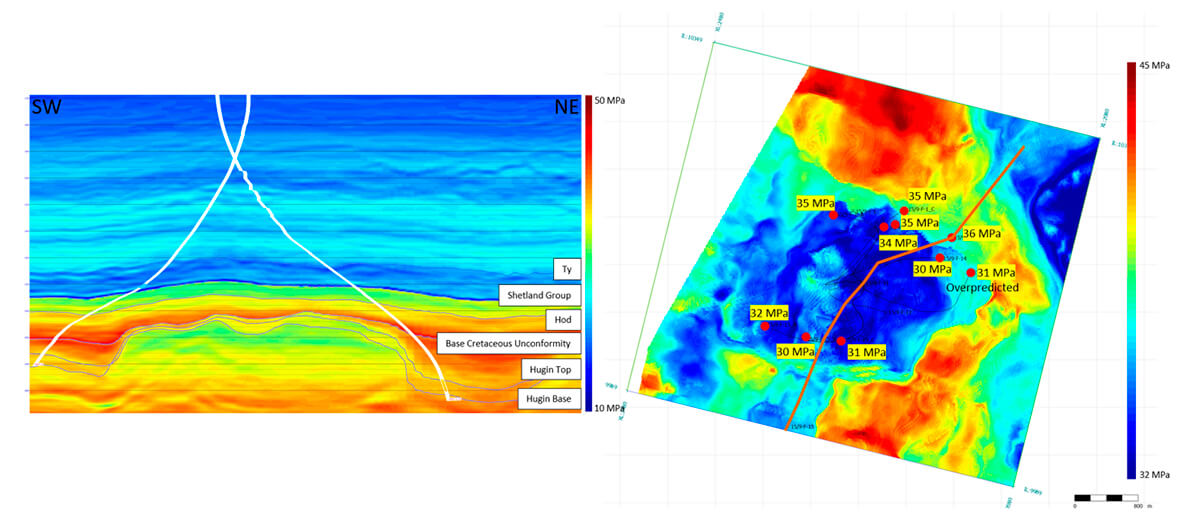
After the calibration, we estimated the formation pore pressure within the 3D volume using the prediction model obtained at the wells and the density and velocity volumes obtained from the simultaneous inversion of seismic data (Fig. 11). The vertical stratification of pore pressure shows that the younger Ty Formation has pressures 3-4 MPa lower than hydrostatic, while the Cretaceous limestones transition into pressures exceeding hydrostatic values by 6-9 MPa, indicating hydraulic disconnection from the overlying Ty Formation. The pressure magnitude for the two hydrostatic wells has been overestimated by 10 to 15%. This discrepancy suggests that pressure in the compartment these wells encountered has leaked off, likely by lateral migration.
To evaluate the pore pressure regimes and the amount of overpressuring, we estimated the total and effective vertical stresses as well as the ratio of pore pressure to overburden stress ( λP ) (Zoback, 2015):

Depending on salinity, the hydrostatic pressure gradient is around 10 MPa/km, or almost half of the overburden stress gradient. Therefore, this parameter can reveal the connectivity or disconnection between formations based on how the pore pressure regime varies laterally and with depth. For example, a ratio of pore pressure to overburden stress of about 0.5 indicates that pressures are hydrostatic, whereas a lower ratio suggests underpressures and a higher ratio suggests overpressures.
3- Classification of lithology and pore pressure mechanism and regime
The estimated pore pressure and overburden stress were integrated with reservoir properties obtained from inversion and log-to-core calibrations. This analysis produced a unified classification that predicted lithology, pressure regime, and overpressure mechanisms. Within this workflow, lithological classification uses rock-physics modelling to relate the rock properties to the seismic attributes. One of the challenges of evaluating the facies and mapping the thickness of the Hugin reservoir is the low resolution of seismic data below the Base Cretaceous Unconformity.
To build the rock-physics model of the Hugin reservoir, we used a constant-cement sand model (Dvorkin and Nur, 1996) to estimate the bulk and shear moduli of the dry sand and Gassmann fluid substitution for the saturated moduli. The rock-physics modelling was used to create rock physics templates that covered the range of mineralogy, and porosity specified in the Well Discovery Report (Statoil, 1993). Figure 12a shows the clay content and porosity as functions of the elastic attributes MuRho and Rho. The well log data are superimposed on the template and colored by porosity.
The seismic attributes are added to the rock-physics template in Figures 12b and c. The points are coloured by their crossplot density and lithology class, respectively. It is observed that sands with high porosity and lower clay content have lower densities and MuRho, while carbonates have larger MuRho values than clastics. The most important distinctions were the two facies within the Cretaceous limestone formations, separating the limestones from the basal marl and claystone, and the two facies within the Jurassic deeper clastics, the silty claystone caprock versus the porous reservoir sandstone. The Hugin reservoir facies were further separated into low-, medium-, and high-porosity ranges. Results of lithology classification suggest that inversion results have higher resolution and allow a more accurate interpretation of the top reservoir than when using only seismic amplitudes. The lithology interpretation also suggests that the reservoir could be thicker than previously thought, particularly in the western part of the structure.
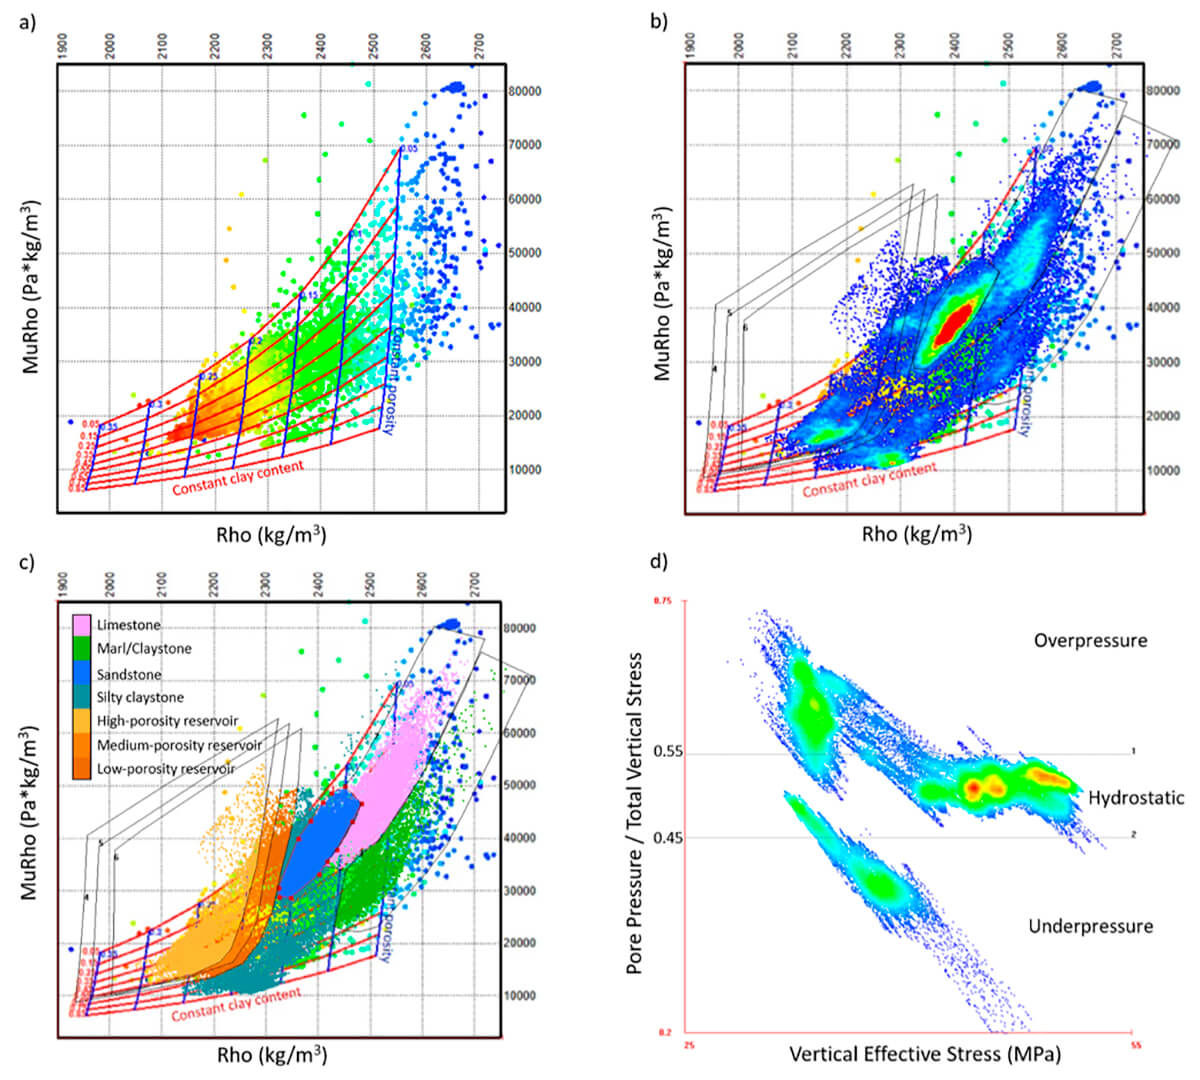
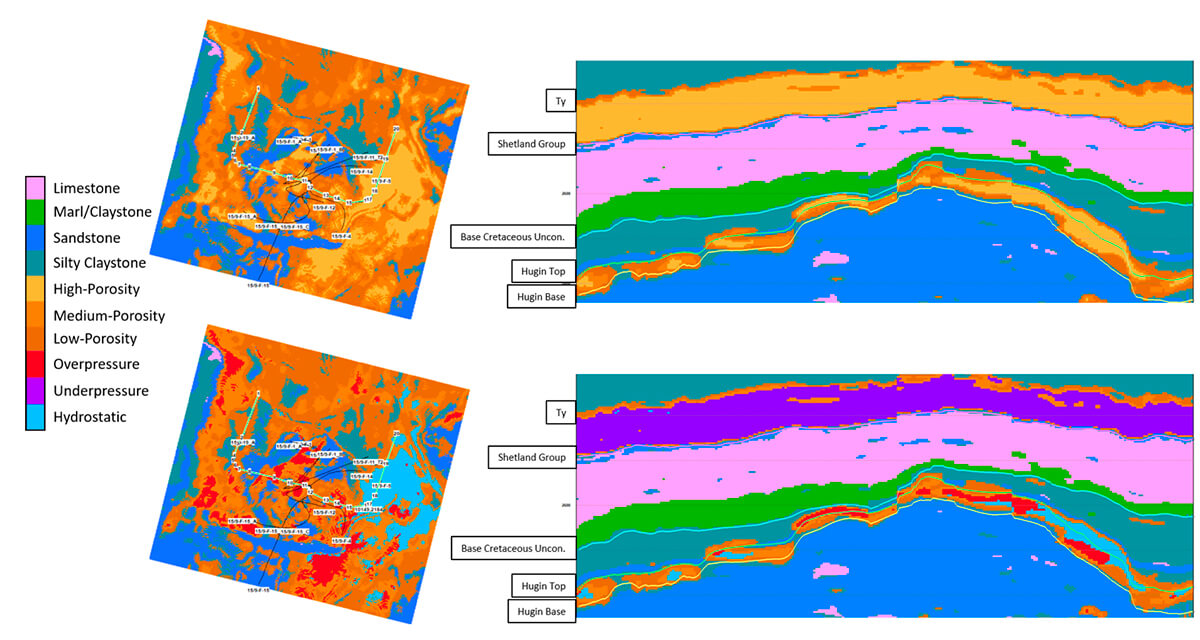
The lateral and vertical distribution of pressure regimes was delineated using the λP parameter. The pressure regimes were classified on the λP versus vertical effective stress crossplot, as shown in Figure 12d. The estimated average λP shows that the caprock has larger excess pressures than the reservoir, with the degree of overpressuring generally increasing from NE to SW. Within the Hugin Formation, pressures are generally at the hydrostatic/overpressure boundary (λP ~ 0.55), with preferential development of moderate overpressure (λP = 0.6) on the crest and southwestern flank of the structure (Fig. 13). The reservoir sands with a λP between 0.45 and below 0.55 were classified as hydrostatic. Figure 14 shows cross-sections and map views both through the lithology volume and through the pressure regime distribution within the high porosity sands.

The reservoir compartmentalization is suggested by the lateral extent of high-pressure anomalies and seems primarily controlled by faults. Small, or no pressure contrast between adjacent reservoir compartments indicates possible fluid flow between compartments, while higher pressure differences suggest sealing faults. There is no apparent preferential orientation for the sealing faults, although there are some overpressure/hydrostatic contacts with approximately NE-SW orientation. The extent of the overpressure regime suggests connectivity to the NW area, through the west side of the structure, and to the south via the south-east structure area. Interestingly, this is coincident with the two possible hydrocarbon migration routes described in the evaluation report of the discovery well (Statoil, 1993). Understanding the sealing conditions of each compartment is important, as hydrostatic pressures and high pressures can coexist at the same depth. Sands in the eastern area seem to be in a hydrostatic regime, in agreement with the pore pressure measurements presented in Figure 5.
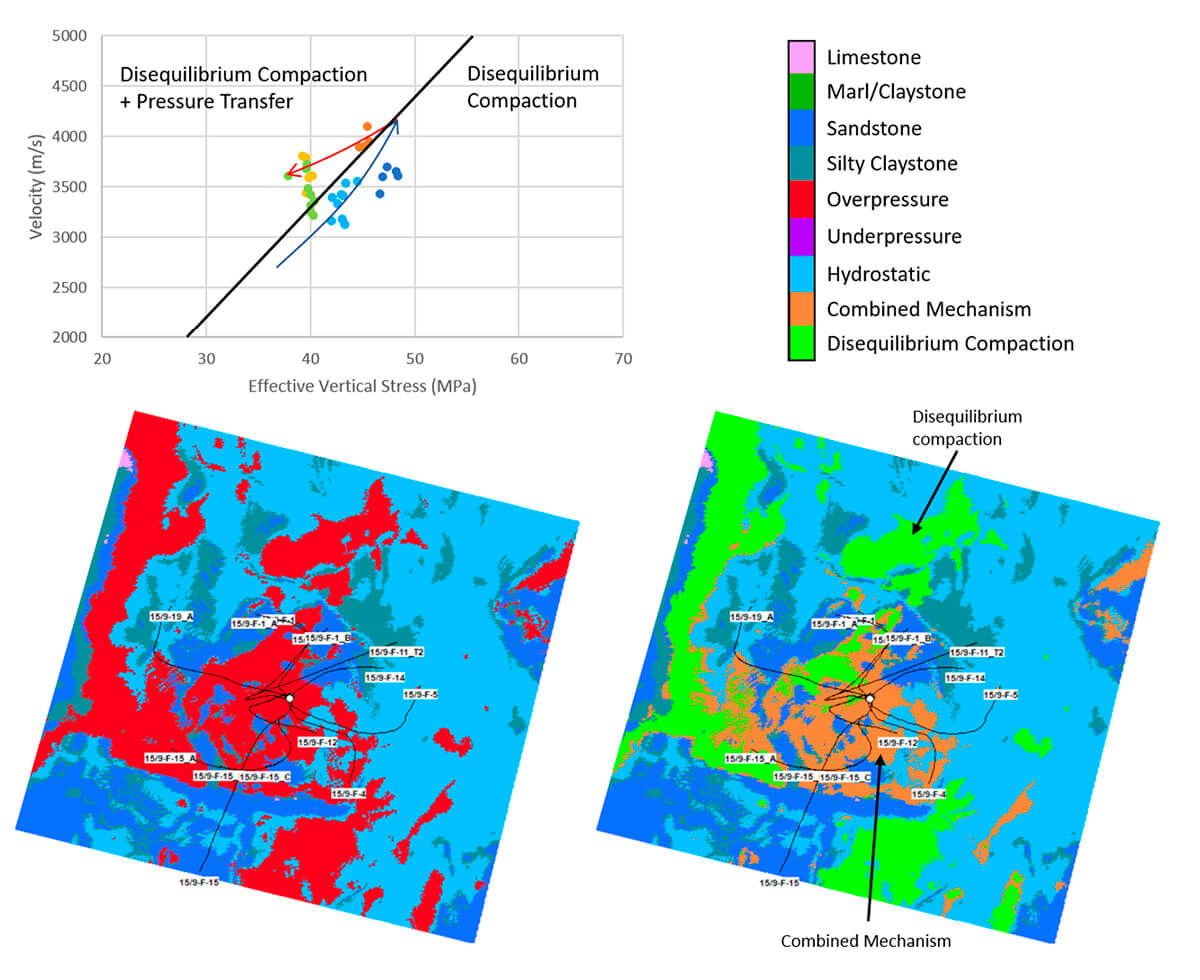
Within the overpressure regime, the loading and unloading mechanisms were also separated on the velocity and vertical effective stress crossplot. Overpressures following the loading curve were classified as being generated from disequilibrium compaction, and overpressures above the loading curve were classified as having a dual mechanism – both disequilibrium compaction and fluid expansion/pressure transfer. The spatial distribution of the interpreted mechanisms shows that overpressures on the structural high are generated by the combined mechanisms, while away from the main structure, the disequilibrium compaction is predominant (Fig. 15).
Conclusions
This study involved estimating pore pressure and lithology for the entire sedimentary cover above the Triassic. Our investigation focused on the Jurassic sediments and showed the coexistence of a main and a secondary overpressure mechanism: disequilibrium compaction and fluid expansion/pressure transfer. Discrepancy between high Cretaceous overpressures and moderate Jurassic reservoir overpressures implies pressure release from the reservoir over geological time. The pore pressure could be reasonably predicted from seismic velocity because of its dependence on the vertical effective stress.
Predicting lithology and pore pressure regimes based on seismic inversion data permitted the vertical and lateral delineation of structural, lithological, and permeability barriers within the Hugin reservoir, either as distinct shale/sand contacts or subtle, but strong, permeability changes with no corresponding change in porosity. These rapid permeability changes are only recognized by changes in the pore pressure regime from hydrostatic to overpressure within the high porosity sands and not by changes in lithology. These observed rapid permeability variations correlate with observations from core analysis, showing that more than two orders of magnitude difference in permeability can exist in samples situated only 1 m apart and having only 0.5% difference in porosity (Statoil, 1993).
Mapping the pore pressure distribution shows overpressure conditions, with mild overpressure magnitudes dominating the crestal structural area, transitioning towards a hydrostatic pressure regime along the eastern margin. The normal pressure regime has been correctly identified in this area. The extent and connectivity of the overpressure regime within the reservoir structure and adjacent areas indicate a correlation with the two hydrocarbon migration paths from west and south identified in the area. The non-uniform pressure magnitudes suggest that the reservoir is compartmentalized by the complex fault system. The analysis of possible overpressure mechanisms indicates a contrast in mechanisms between the structural high and rest of the field, suggesting a hybrid fluid expansion and pressure transfer as a secondary mechanism, in addition to the primary disequilibrium compaction.
The overall results suggest that this pore-pressure model is a good approximation of the complicated real pressure field of the area. Its integration with reservoir characterization, facies distribution, structure, and fault system configuration could help to clarify the pressure system and explain why the pressure is confined or transferred across faults or lithological boundaries. Awareness of the interconnection between the pressure field and geological framework is also important to the discovery and evaluation of other hydrocarbon fields in the North Sea or in similar rift-related basins.

Acknowledgements
We would like to thank Equinor, ExxonMobil, Bayerngas, and Norwegian Petroleum Directorate for making the Volve field data available for research, and Lumina Technologies for providing the software for coherency calculations. Comments by Greg Soule at Parex, Mehrdad Soltanzadeh at PetroGem Inc., Peter Japsen at Geological Survey of Denmark and Greenland, and Laurie Weston at Sound-QI and Dave Nordin, are gratefully acknowledged. Thanks to Ruth Peach for asking us to write this article.
Related Reading


Join the Conversation
Interested in starting, or contributing to a conversation about an article or issue of the RECORDER? Join our CSEG LinkedIn Group.
Share This Article