Texas has significant brackish groundwater resources estimated at over 2.7 billion acre-feet within 26 of the 30 designated major and minor aquifers. Brackish groundwater ranges from 1,000 to 10,000 milligrams per liter total dissolved solids (TDS) concentration, which includes the slightly saline and moderately saline zones (Table 1). The Texas Water Development Board (TWDB) began the Brackish Resources Aquifer Characterization System (BRACS) program in 2009 with the objective of providing stakeholders with the data necessary to develop this important resource.
| Groundwater salinity zone classification | TDS concentration |
|---|---|
| Table 1. Groundwater salinity classification used in the study (after Winslow and Kister, 1956). TDS concentration in milligrams per liter of total dissolved solids. | |
| Fresh | 0 to 999 |
| Slightly saline | 1,000 to 2,999 |
| Moderately saline | 3,000 to 9,999 |
| Very saline | 10,000 to 34,999 |
| Brine | Greater than 35,000 |
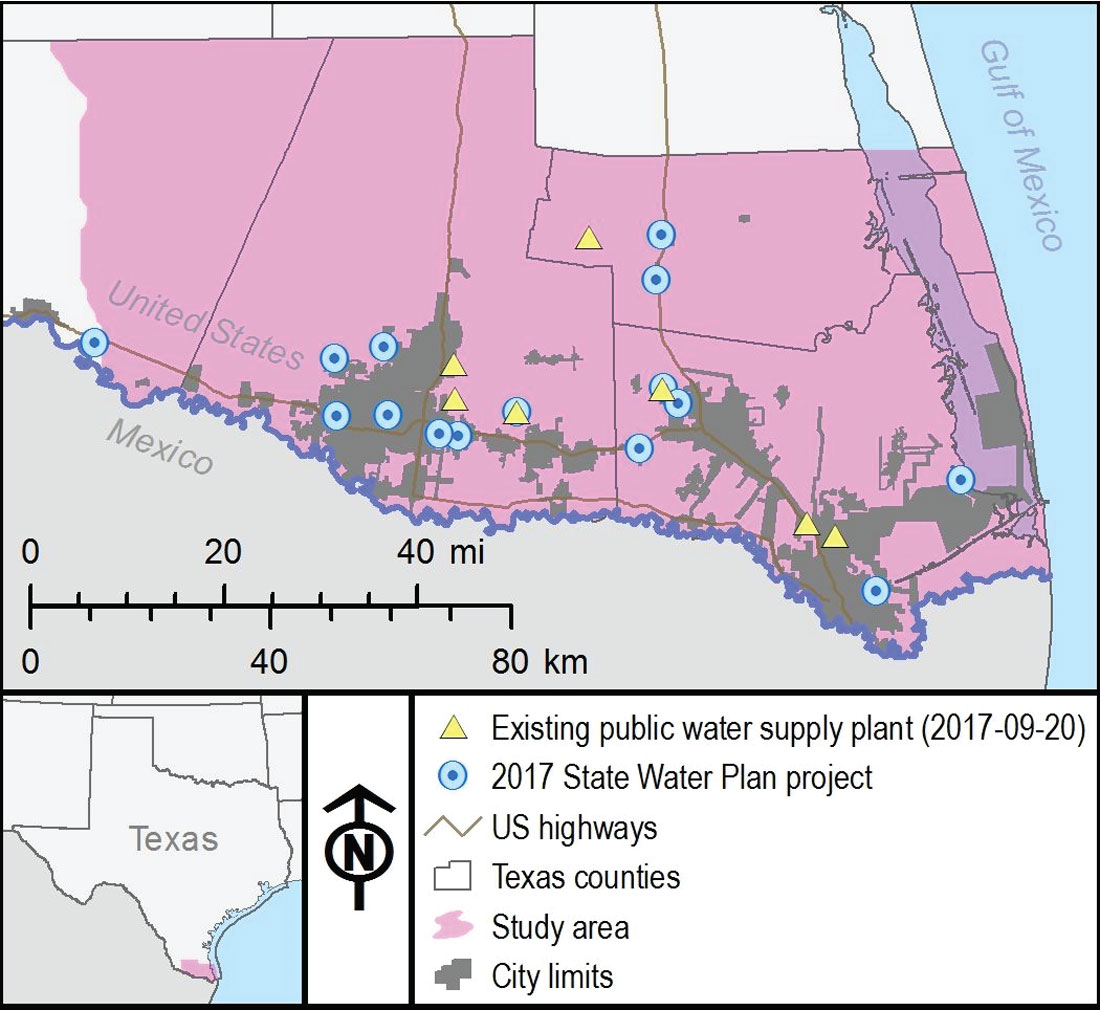
Seven of the 33 existing brackish groundwater desalination plants in Texas are located in the Lower Rio Grande Valley and produce 23.45 million gallons per day (Figure 1). According to the 2017 Texas State Water Plan, statewide groundwater desalination strategies will produce about 111,000 acre-feet per year of additional water supply by decade 2070 if implemented (TWDB, 2017). Fifteen projects related to those strategies are located in or near the study area (Figure 1). The Texas state water plan is updated every five years and identifies water needs 50 years into the future.
The majority of the groundwater in the Lower Rio Grande Valley is brackish (84 percent of the samples exceed 1,000 milligrams per liter TDS), with water wells averaging less than 300 feet. The Gulf Coast Aquifer System is composed of nine geological formations and ranges in depth from 0 (at outcrop) to over 13,000 feet. Geophysical well logs are the only tool readily available to evaluate the entire aquifer.
Even in areas with long-standing, historical brackish groundwater use there is a lack of detailed water quality measurements needed for meaningful regional mapping of brackish aquifers in the state. Texas has an abundance of oil and gas wells logged with geophysical tools, although it can be a challenge to get the necessary suite of publicly available tools logged in the aquifers, especially in the shallow sections.
Mapping the extent of brackish groundwater zones in the Lower Rio Grande Valley portion of the Gulf Coast Aquifer required collection of all available water quality samples and geophysical well logs (Meyer and others, 2014).
Methodology
We selected a technique to interpret TDS concentration from deep resistivity geophysical well logs that is a modification of the RWA Minimum Method (Estepp, 1998). The method is based on Archie’s Equation (1942) in clean, shale-free sandstone that is 100 percent saturated in water:
Rt = Rw • (a/Øm)•(1/Swn)
Refer to Table 2 for all parameters used in these equations.
| Parameter | Description |
|---|---|
| Table 2. Parameters used in equations | |
| Ø | porosity |
| a | Winsauer factor |
| ct | Cw – TDS conversion factor |
| Cw | conductivity of water |
| Df | depth of formation |
| Dt | depth total |
| Gg | geothermal gradient |
| m | cementation exponent |
| n | saturation exponent |
| Rt | resistivity fluid saturated rock |
| Rw | resistivity of water |
| Rwc | resistivity of water corrected |
| Rwc_Rw | mixed ion correction factor |
| Rw75 | resistivity of water at 75 degrees Fahrenheit |
| Sw | water saturation |
| Tbh | temperature of bottom hole |
| Tf | temperature of formation |
| Ts | temperature of surface |
The RWA Minimum Method was selected for mapping brackish groundwater in the Lower Rio Grande Valley portion of the Gulf Coast Aquifer since there were deep resistivity tools available, the aquifer lithology is interbedded sand and clay, and it produced reasonable and repeatable results based on our understanding of the aquifer. The deep resistivity tool is necessary to avoid the effects of mud filtrate invasion on the shallow resistivity tools.
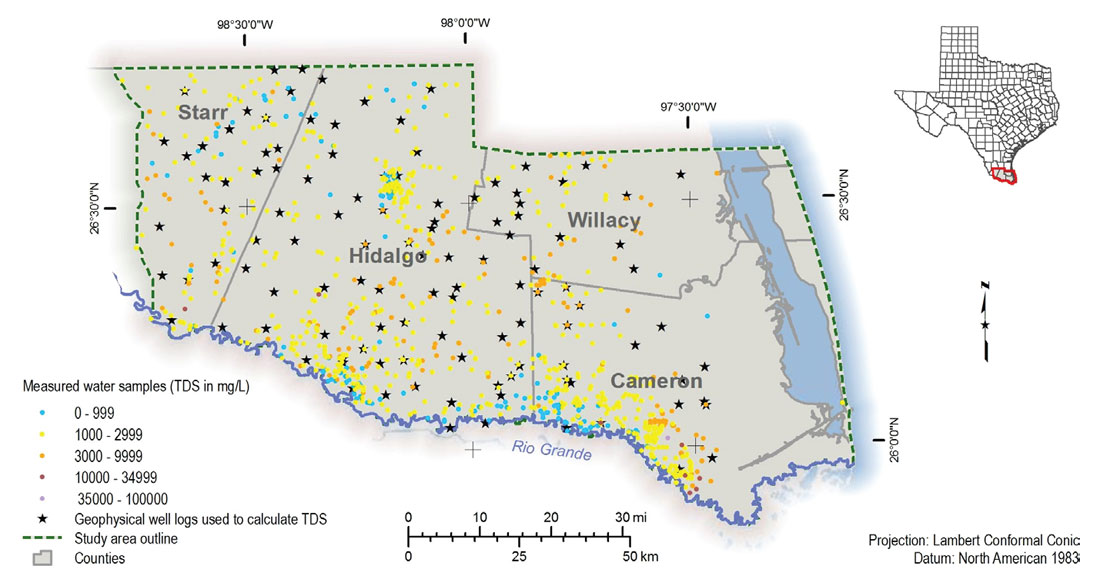
We collected all publicly available water quality measurements from water wells in the study area (894 wells with 1,322 samples). For each water quality sample, we determined (1) a ct factor (TDS divided by specific conductance), (2) a sodium chloride equivalent TDS concentration using Schlumberger Chart GEN-8, (3) a mixed ion correction factor (RwcRw = TDS /sodium chloride equivalent TDS), and (4) the correct geological formation(s) based on well screen or well depth. Because the common cations and anions contribute different amounts of resistivity to the groundwater, we correct the resistivity of formation water with this mixed ion correction factor. We organized this information by geological formation within defined ranges of TDS. The correction factors were used during subsequent calculations.
We evaluated the deep resistivity tool for each geological formation in clean, shale-free sandstone. We calculated Rw using the equation:
Rw = Rt • Øm
Because the formation is 100 percent saturated in water, we can remove the water saturation terms from Archie’s equation and the Winsauer factor is assumed to be one, simplifying the equation to the present form. We lacked porosity logs in the study area and used values from 20 to 40 percent, with values of 30 percent or more applied to formations less than 1,500 feet in depth. Estepp (1998) proposed an equation for m (cementation exponent) in Gulf Coast unconsolidated sediments:
m = 1.75 + (Df – 1,500)/10,000
The resistivity of water (Rw) is corrected for mixed ion concentrations with the equation:
Rwc = Rw / Rwc_Rw
We assumed that when TDS reached 10,000 milligrams per liter the correction factor approaches one, where the groundwater is dominated by a sodium chloride solution.
We calculated the temperature of formation (Tf) at the depth of formation (Df) with the following equations:
Tf = (Gg • Df) + Ts
Gg = (Tbh – Ts) / Dt
Tbh is determined from the geophysical well log header and Ts is the 30-year annual average temperature at the well site.
We converted the resistivity of the water at formation temperature to 75 degrees Fahrenheit (Rw75) with the equation:
Rw75 = Rwc • (Tf / 75)
We converted the resistivity of water to conductivity of water at 75 degrees Fahrenheit with the equation:
Cw = 10,000 / Rw75
Interpreted TDS is derived from the conductivity of water with the equation:
interpreted TDS = Cw • ct
We compared the log-derived interpreted TDS (115 wells) to water quality sample TDS from nearby wells taken for the same geological formation to test our interpretation methodology. The log analysis was carried out using custom data entry forms within Microsoft Access© BRACS Database and used Visual Basic© to crunch the equations. The BRACS Database is a custom application that contains all of the study well control, geologic and water quality data, and is used to process data and create datasets that can be exported to a geographic information system (GIS).
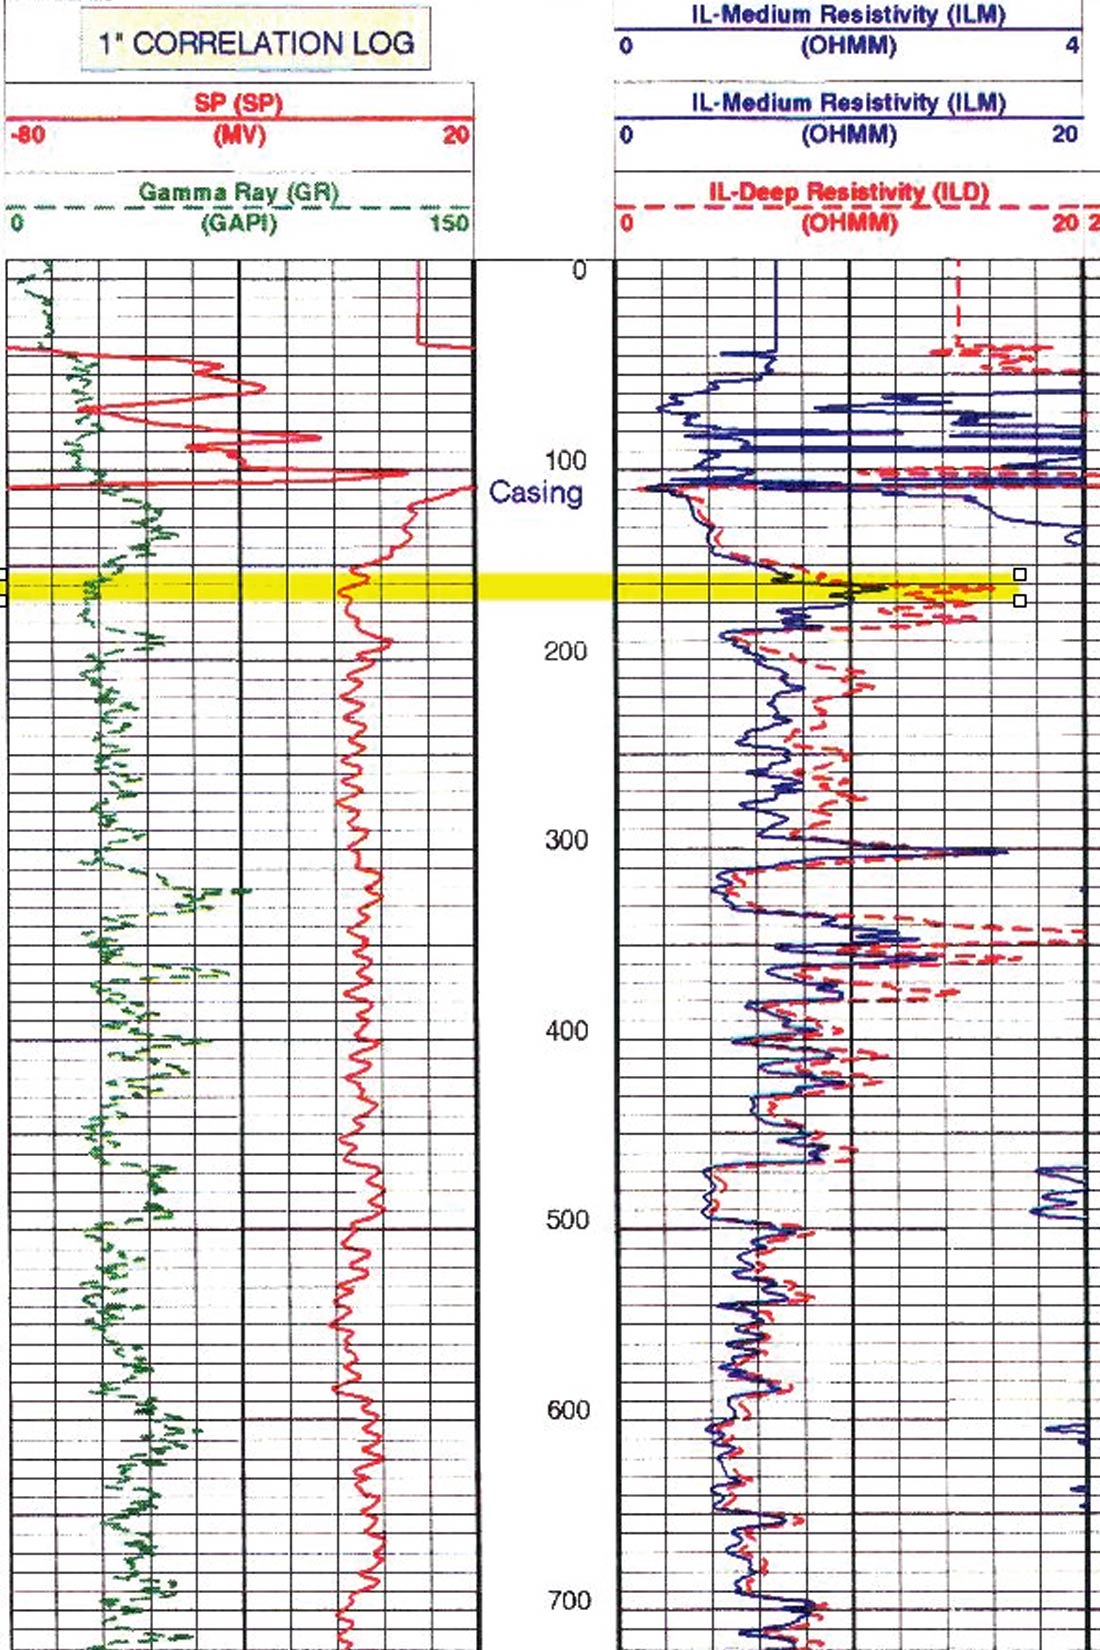
BRACS well 42889 is used as an example: the log includes gamma ray and spontaneous potential (SP) logs in the left track, depth in feet below ground surface in the center, and resistivity curves in the right track (Figure 2). At depth 160 feet (yellow highlight) the deep resistivity is 16 ohm-meters. Using the RWA Minimum Method, the interpreted TDS is approximately 2,353 milligrams per liter. A water well 2,000 feet to the southeast (BRACS well 39989) at approximately the same depth had a measured water quality sample of 2,264 milligrams per liter TDS.
The deep resistivity read from BRACS well 42889 log decreases with depth reflecting an increase in formation water salinity. At 1,200 feet it is 10 ohm-meters and at 2,000 feet it is 2 ohm-meters.
Results
We mapped three-dimensional salinity zones with GIS software based on the salinity classification (Table 1) using log-derived interpreted TDS and water quality sample TDS (Figure 3). The study area was subdivided into 21 geographic areas, each having a unique vertical salinity profile based upon log-interpreted and water quality TDS measurements. We discovered (1) salinity zones crossed geological formation boundaries, (2) some geologic formations contained multiple salinity zones, (3) areas with natural inversions of groundwater (more saline water above less saline water), and (4) possible anthropogenic modification of the natural formation water quality from activities including salt water disposal, agricultural irrigation, and leaking canals and pipelines.
We prepared net sand maps for the nine geological formations of the Gulf Coast Aquifer and the salinity zones. We estimate that the Gulf Coast Aquifer in the study area contains more than 40 million acre-feet of slightly saline groundwater, 112 million acre-feet of moderately saline groundwater, and 123 million acre-feet of very saline groundwater. Not all of this brackish groundwater can be economically produced. Nevertheless, these estimates provide indications of the potential availability of this important resource.
Conclusions
The estimated volume of brackish groundwater available for development is significant. The Lower Rio Grande Valley has the largest concentration of brackish groundwater desalination plants in Texas, and desalination capacity will increase in the future. This study has already supported regional water planning efforts to meet these goals.
Measured water quality samples used for calibrating the log analysis technique were only available for shallow parts of the aquifer in a limited area. The deeper portions of the aquifer relied exclusively on log interpretation.
To solve the calculations, we estimated some of these parameters (for example, porosity and cementation factor, m) based on similar geologic conditions existing elsewhere or using best professional judgment.
The salinity zones were only partially controlled by sand body distribution within the nine geological formations in the Gulf Coast Aquifer. Inverted salinity profiles (more saline above less saline) represent 15 of the 21 mapped salinity profile zones covering 22 percent of the study area.
With each brackish study conducted by TWDB staff or performed by contractors we gain invaluable insight into log analysis techniques and aquifer structure that will be applied in future studies. Application of log analysis techniques is and always will be dependent upon the availability of publicly available tool suites. Because sand units containing layered and dispersed clay/shale decreases resistivity response (Torres-Verdín, 2017), one of the most important considerations in future studies of Tertiary formations in the Gulf Coast is accommodating this problem in porosity and resistivity log analysis.
Brackish groundwater exploration test well drilling should include a comprehensive logging suite and water quality sampling program. Logging is expensive and often limited or overlooked during water well drilling; however, the added expense may pay for itself in large well field development. Brackish groundwater test wells should be drilled deeper than the target formation to evaluate the underlying strata. Long-term production of brackish groundwater may lead to upconing of more saline groundwater from lateral or underlying strata, and understanding the deeper parts of the aquifer can help mitigate this effect.
Test well drilling data, including calibration of geophysical well log tools with water quality samples, can be extrapolated to existing well control in the area of interest. Because study area well control and interpretations are contained in the BRACS Database, adding new well control and re-calculation of parameters is straightforward. Finally, long term groundwater monitoring should include water quality and quantity data to evaluate well field production and potential changes.
To learn more about this study, visit the TWDB website, www.twdb.texas.gov, and navigate to the Innovative Water pages for the BRACS program. All study deliverables may be downloaded.

Acknowledgements
The authors would like to thank John Estepp for his insight into log analysis and access to a significant collection of geophysical well logs. A special thanks to Janie Hopkins, Doug Coker, and Chris Muller for water quality sampling and Jorge Arroyo, Dr. Sanjeev Kalaswad, and Dr. Robert Mace for management support of this study.


Join the Conversation
Interested in starting, or contributing to a conversation about an article or issue of the RECORDER? Join our CSEG LinkedIn Group.
Share This Article