Abstract
Recent interest in unconventional reservoirs motivates our work in laboratory measurements of seismic anisotropy. Seismic anisotropy is the variation in speed of a wave as a function of its direction of propagation. Analyzing anisotropy in unconventional reservoirs is important since anisotropy leads, for example, to differential stresses upon loading and could affect hydraulic stimulations. In this sense, laboratory measurements are an important tool to study seismic anisotropy at small scales which can aid in the characterization of larger formations.
The purpose of this work is to describe the laboratory methodology used to measure travel times of P and S waves when travelling through rock samples. Elastic anisotropy of a series of four carbonates and one evaporite from a Canadian sedimentary basin are investigated. In sedimentary basins seismic anisotropy is influenced by depositional and diagenetic processes as well as local and regional stress fields. In the laboratory those effects manifest by layering, preferred mineralogical alignment or preferred orientation of cracks and pores.
Assuming a transversally isotropic medium, three plugs were cut at directions perpendicular, parallel, and oblique to the materials layering. One P wave and two mutually orthogonal S waves were measured as a function of confining pressure using a conventional ultrasonic pulse transmission method. Results show a lack of anisotropy in all samples, however, it is possible to observe significant differences in both P and S wave velocities in the same samples. These differences are due to diagenesis of the rock rather than anisotropy. Dependence of travel times and hysteresis effects can be observed when pressurizing and depressurizing.
Introduction
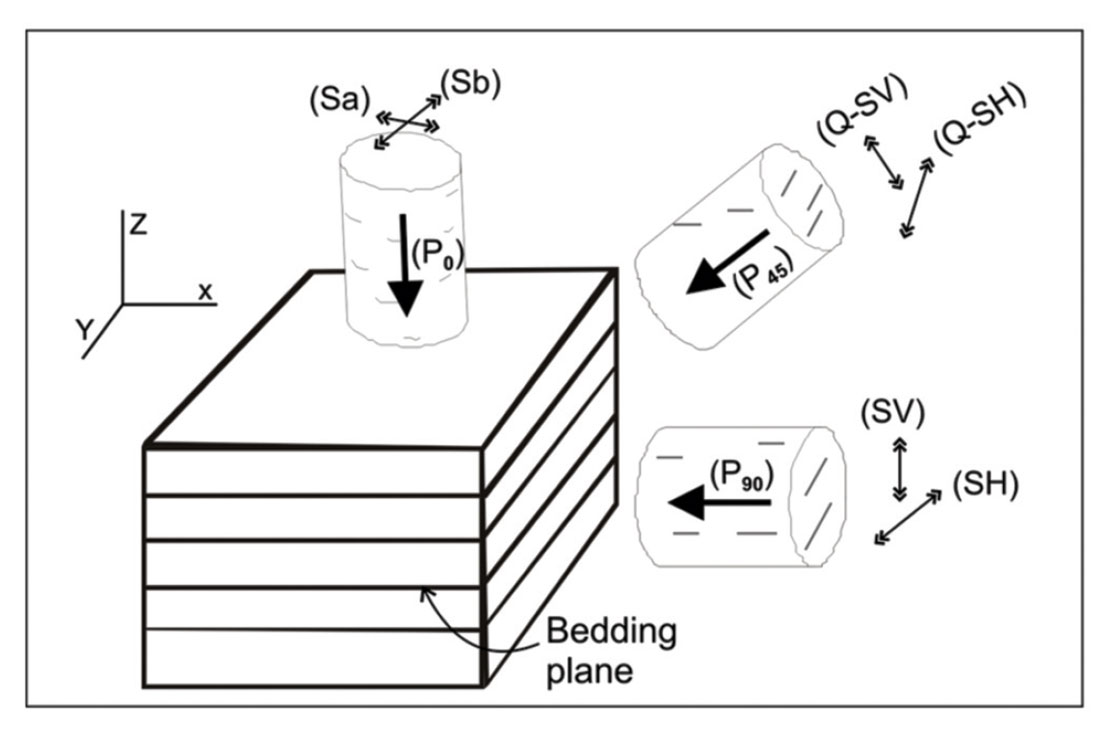
Seismic anisotropy and its dependence on pressure are studied ultrasonically by using the pulse transmission method. The pulse transmission method is the most common method of ultrasonic measurements used to estimate velocities in geologic materials (Dey-Barsukov et al., 2000; Mah & Schmitt, 2001; Wang, 2002b). This method involves measuring the travel time of an ultrasonic wave traveling through three plugs that are cut at directions perpendicular (0°), parallel (90°), and oblique (45°) to bedding (sediments). In order to recreate in situ pressure conditions similar to those in the Earth’s interior, the P wave and the two orthogonal S wave velocities are measured as a function of confining pressure by using a pressure vessel in two different cycles: compressing (Up Cycle) and decompressing (Down Cycle).
Methodology
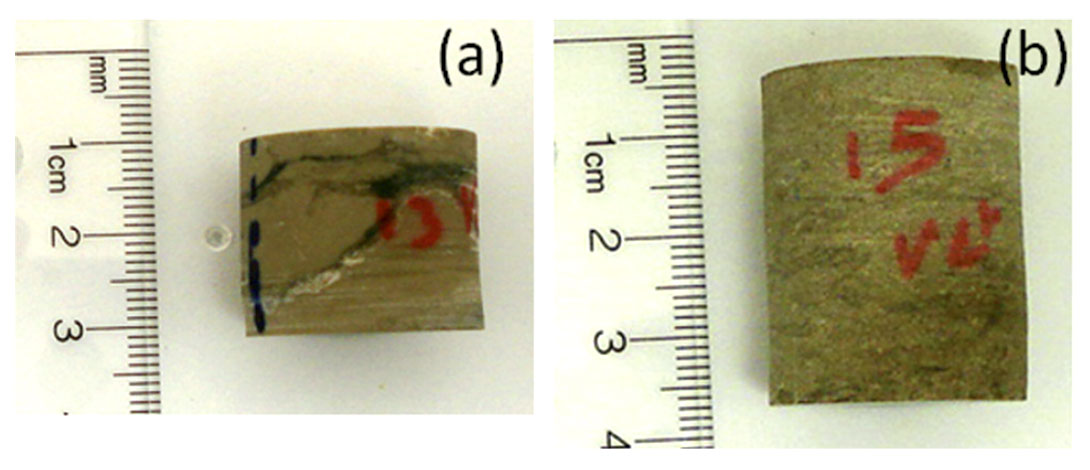
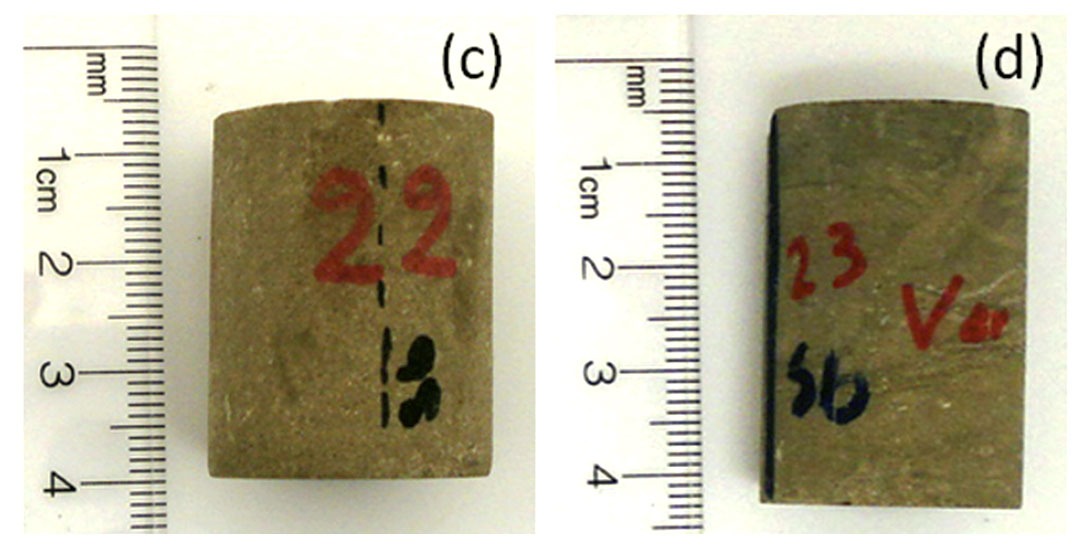
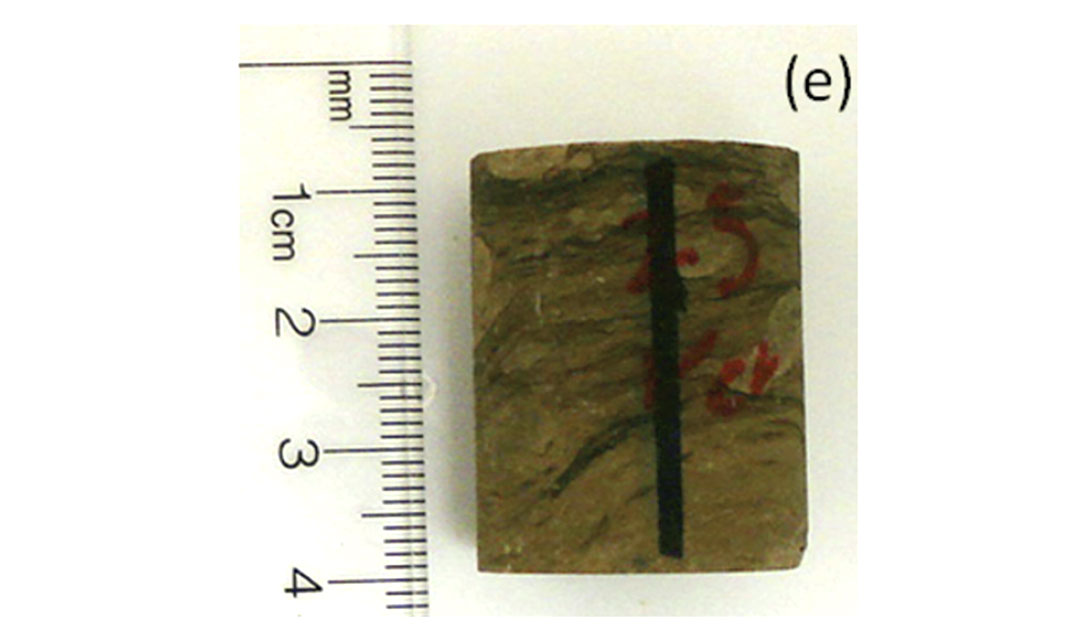
Three samples of cylindrically shaped cores were obtained from a main sample (Figures 1 and 2). In order to minimize errors in the velocity measurements, the top and bottom of the samples were grounded to be parallel to one another (within +/- 2 mm). In addition, to avoid the presence of water in the samples, cores were dried under a vacuum at 70° C for 48 hours before carrying out the measurements.
Sample preparation
In obtaining the measurements, the samples were pushed inside a Tygon™ in order to exclude the confining pressure oil from entering the rock’s pore space. Then two ultrasonic transducers (end-caps) are set at the ends of the sample (Figure 3). Such transducers are made from piezo-electric ceramics that allow a simultaneous measurement of the P and S wave velocities.
Experimental Setup
The experimental setup consists of a pulser generator/receiver system, a digital oscilloscope and a pressure vessel that can apply a confining pressure of up to 200 Mpa (Figure 4). The transmitter is activated by applying a fast rising 200 V square wave to the piezoelectric ceramic which produces a mechanical disturbance. The generated elastic wave is then recorded by the digital oscilloscope after travelling through the assembly buffers of the end-caps and the sample.
Results
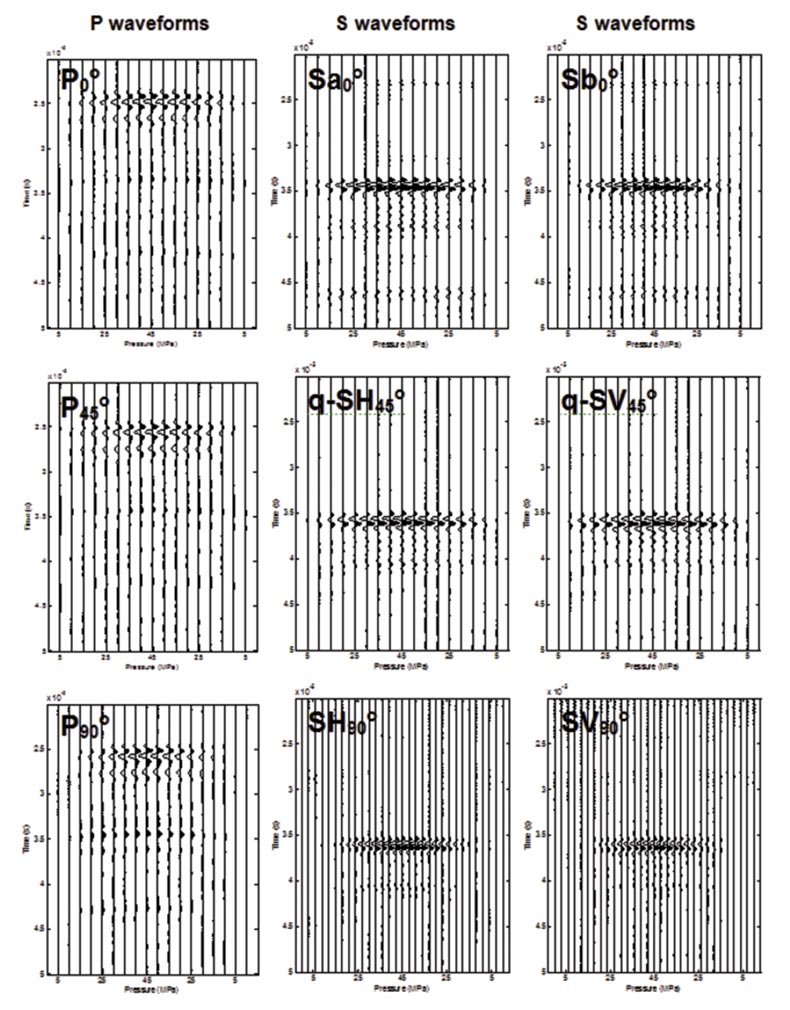
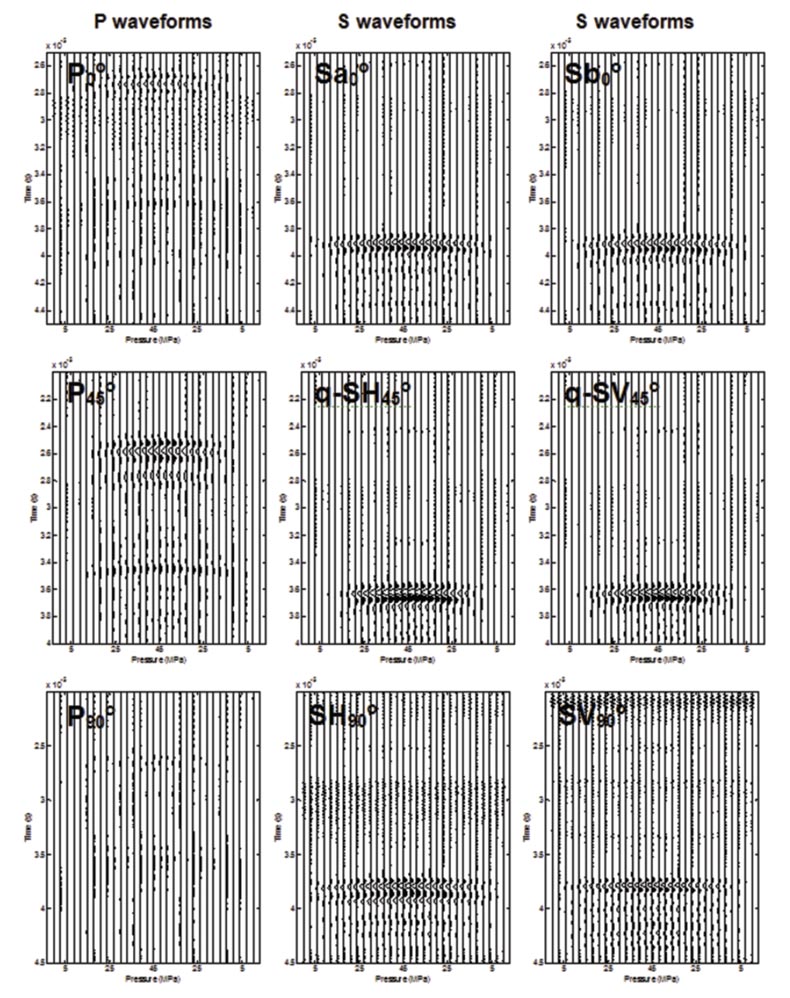
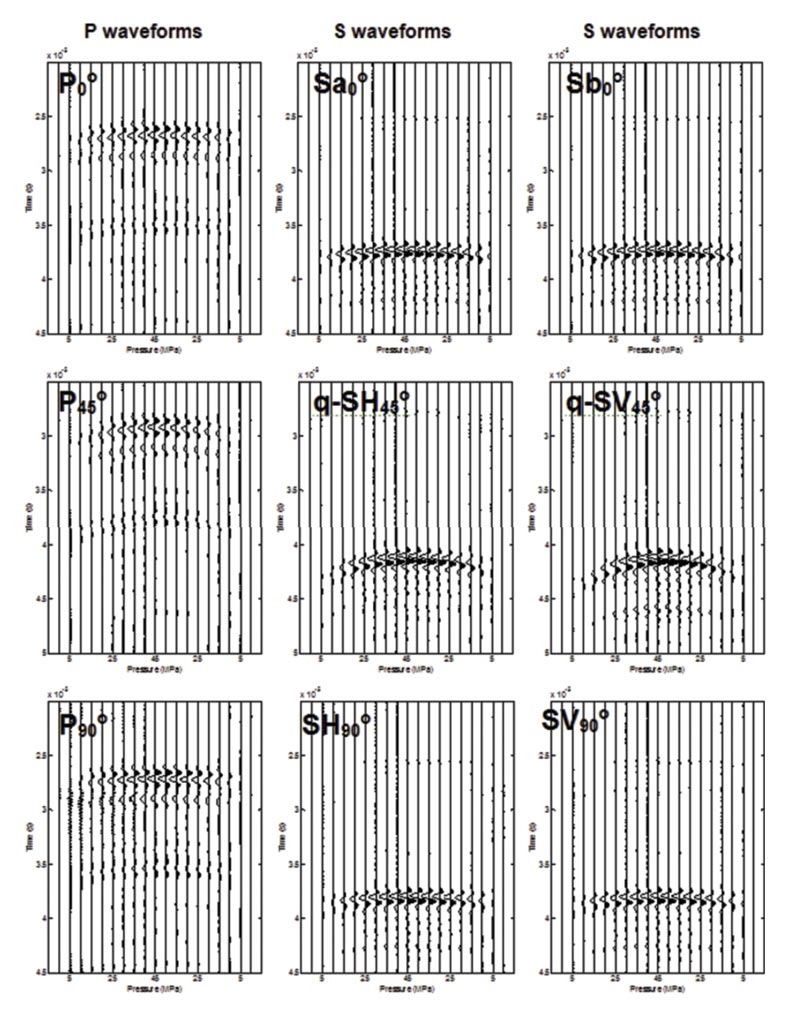
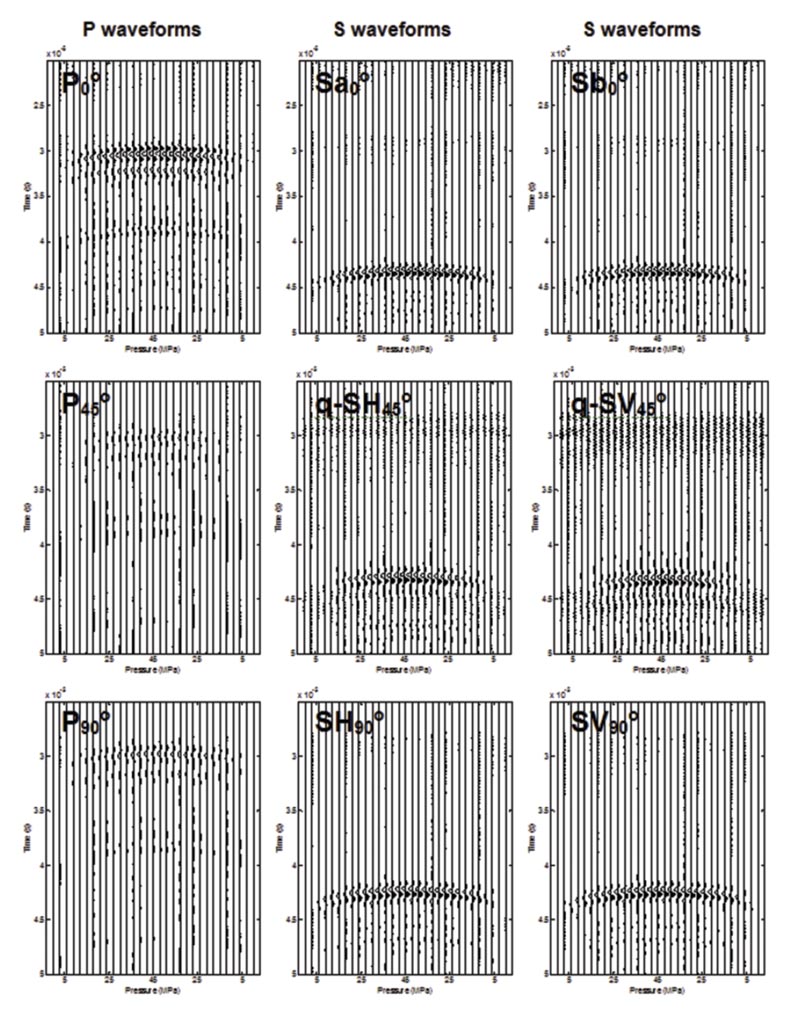
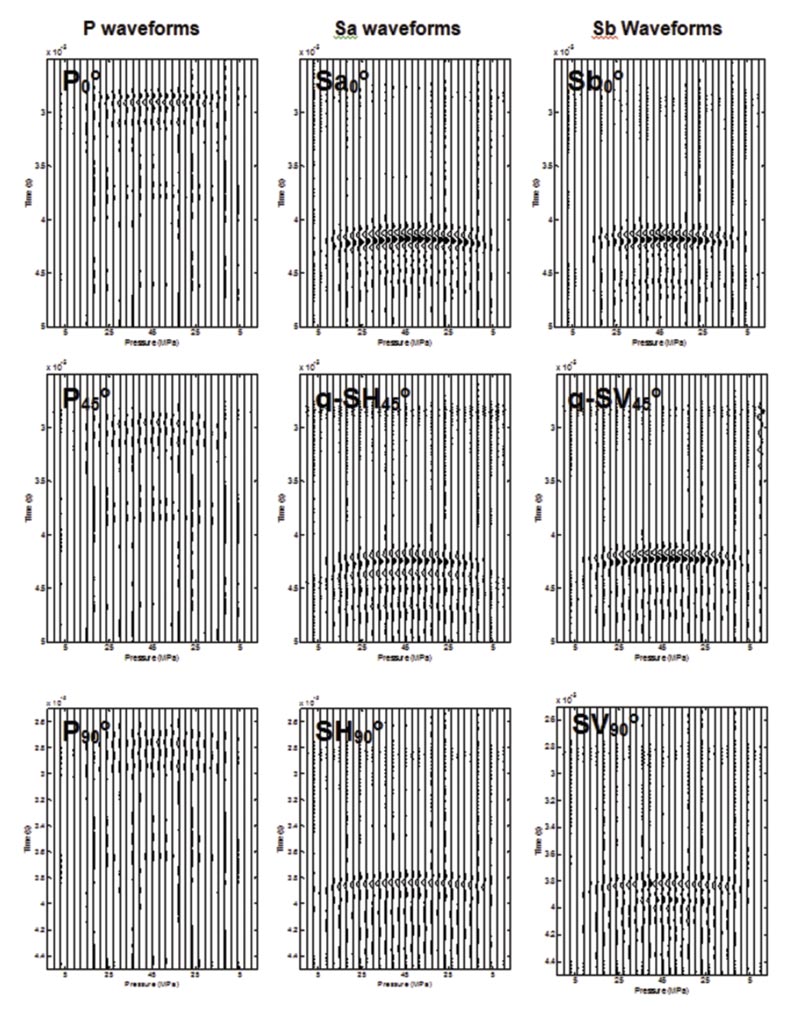
One P wave and two mutually perpendicular S wave velocities were estimated in all cores (i.e. Perpendicular to bedding, parallel to bedding and 45 degrees with respect to bedding). Figures A1 through A5 (Appendix) show the entire set of waveforms for the five samples used in this study.
Velocities were calculated using the travel time of the waveforms by picking the first peak of the signal and then taking the quotient of the travel time picked and the distance travelled. Since travel time also involves the signal traveling through the end-caps, it is necessary to take into account this effect when estimating velocities.
Travel times were measured both during pressurization and depressurization. An incremental change in velocity can be observed as pressure increased. Pressurization velocities are slower than depressurization velocities; this effect is called hysteresis (Gardner et al., 1965). When a sample is pressurized, microcracks and pores begin closing at a certain rate, however, when depressurizing, due frictional forces, the opening rate of microcracks and pores is lower than the closing rate for a given pressure.
Figure 5 shows P and S wave velocities for the evaporite along with the estimated experimental error at three different orientations. Lack of anisotropy is evident for that sample since error bars intersect for both P and S wave velocities.
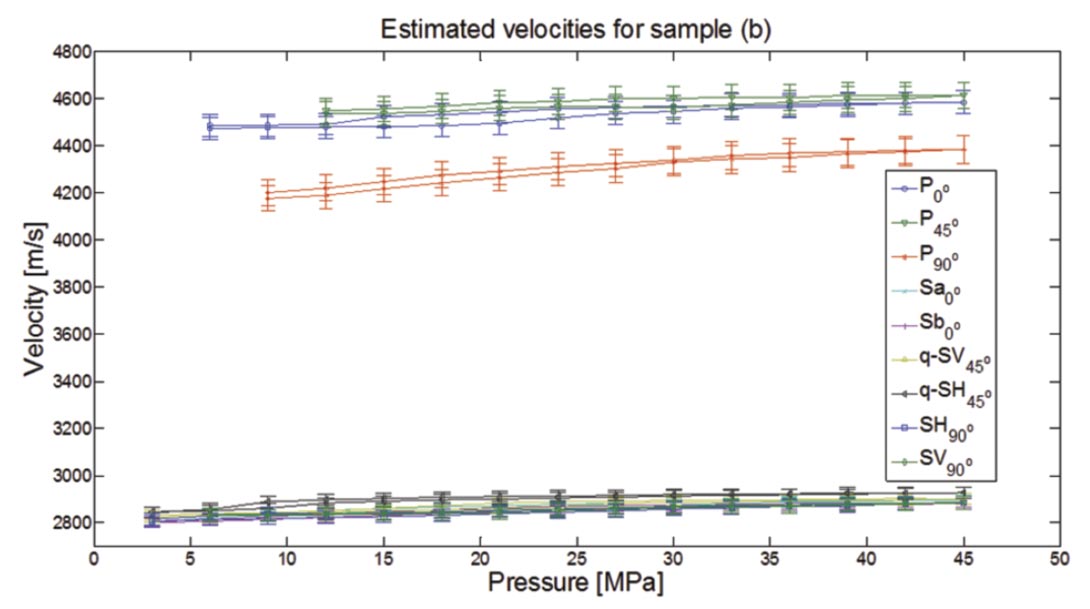
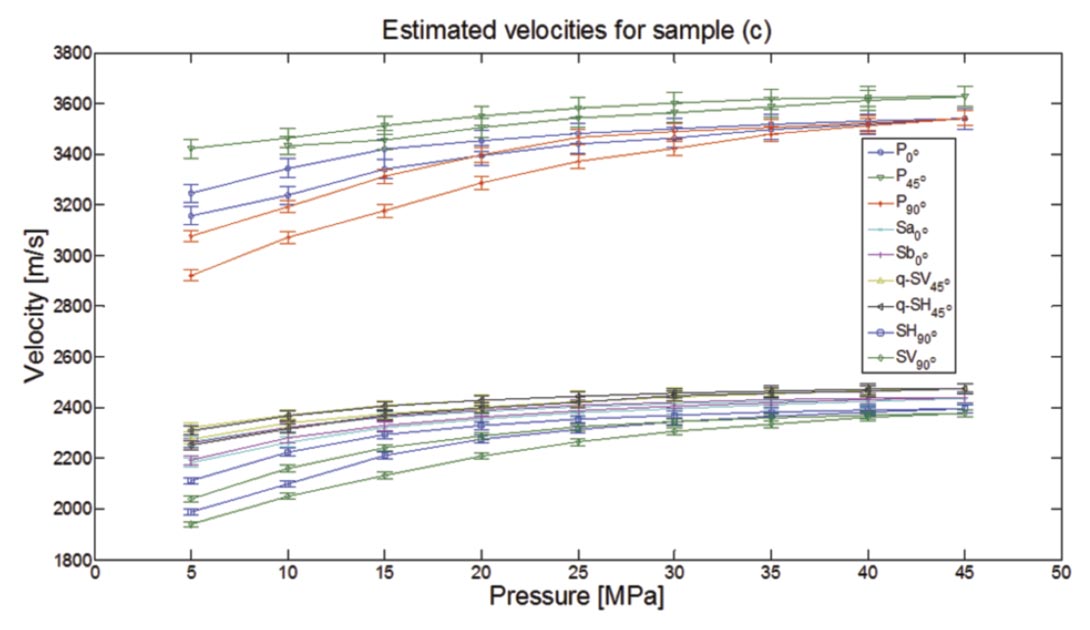
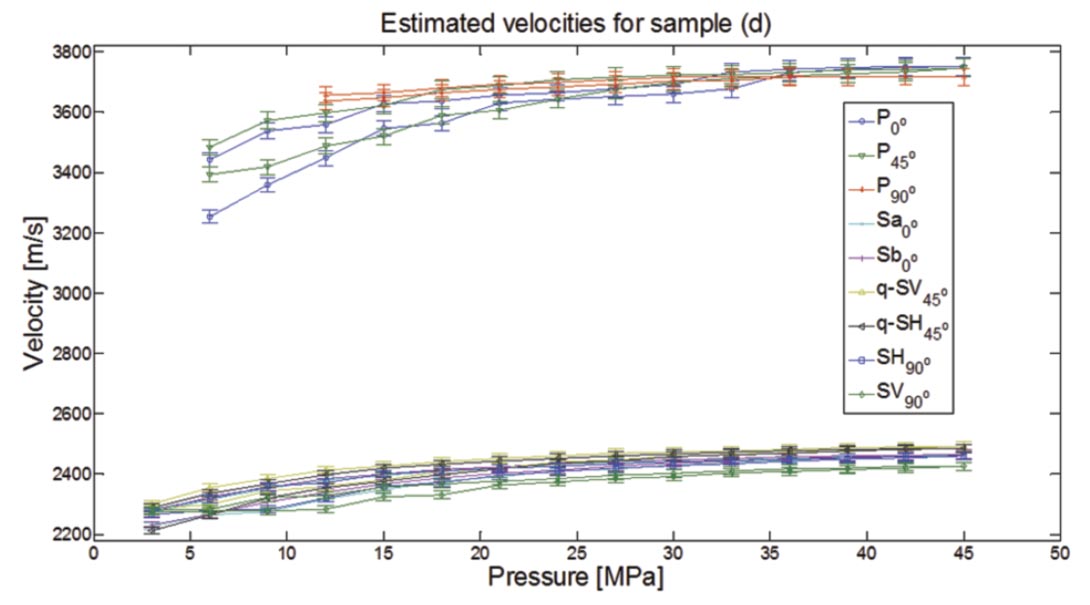
Velocities for samples (b), (c) and (d) (Figures 6, 7 and 8) also show an isotropic behavior, with the exception that the P wave velocity parallel to bedding is significantly lower than those in the perpendicular and oblique directions. This can be due the diagenesis of the rock. Another possibility is that the core properties were altered when cutting and manipulating the samples.
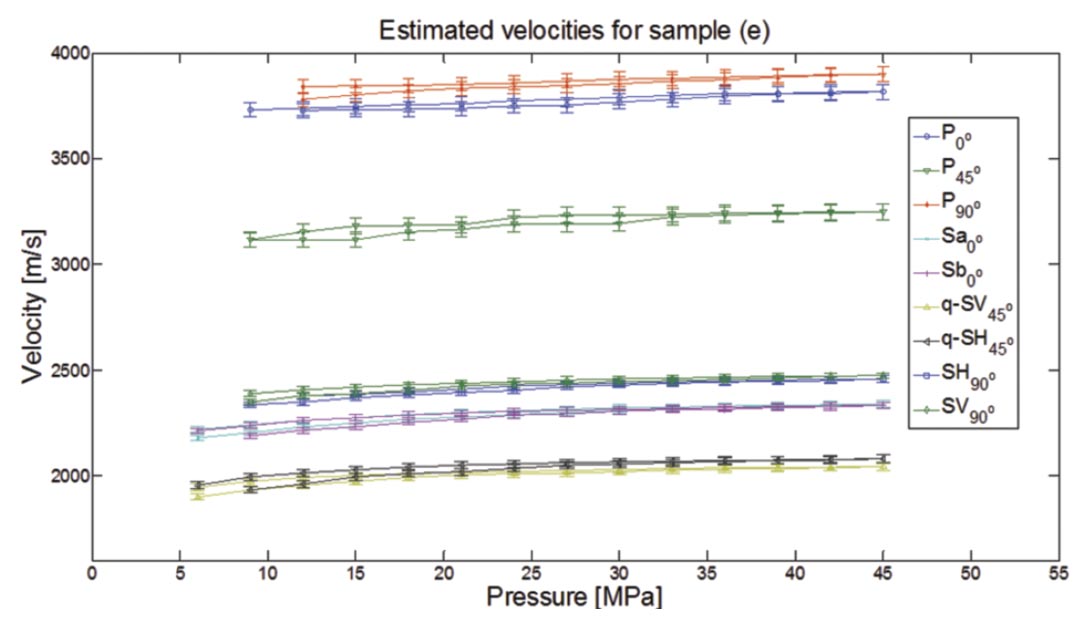
Figure 9 shows P and S waveform velocities for sample (e), error bars of P0° and P90° cross each other. Lower P45° velocities and the fact that the S velocities error bars do not cross each other, cannot be necessarily interpreted as anisotropic behavior, (Note that, for example, SH90° and SV90° have practically the same velocity, when actually SH90°>SV90° if a vertical axis of symmetry is considered) but rather as a consequence, again, to the diagenesis of the rock.
Discussion
Results show that samples analyzed are not anisotropic (assuming a vertical axis of symmetry); however, we found that diagenesis played a major role in the P and S wave velocities in samples (b) and (e). Analysis of velocities shows a dependence of travel times for both P and S waves, where this behavior is more evident in carbonates than in the evaporite. Pressurization and depressurization of samples show that microcracks and pores open and close at different rates for the same pressure (hysteresis). This effect is more evident for pressures < 35 Mpa in all samples. Results obtained allows for the understanding of the nature of the sedimentary rocks in specific sedimentary basins, which can be used to avoid misinterpretations in seismic processing (i.e., seismic anisotropy can be discarded when processing seismic data obtained from that area).
Acknowledgements
The author thanks IMP (Instituto Mexicano del Petróleo) and the University of Alberta for supporting this research. Also thanks to Doug Schmitt, Gautier Njiekak and Randy Kofman for their valuable recommendations and for letting me use some of the figures portrayed in this work and Lucas Duerksen for his help in the Rock Physics Laboratory of the Experimental Geophysics Group (EGG) at the University of Alberta.
Conclusions
Estimates of permeability in hydraulically induced fractures were performed through spectral analysis of a time-lapse seismic survey. Estimates are based on theoretical predictions that the effect of fluid mobility results in a frequency dependent attenuation response. Comparison of time-variant amplitude spectra for baseline and monitor surveys shows a bandlimited spectral anomaly consistent with theoretical expectations. The attenuation analysis is consistent with microseismic observations and 4D seismic amplitude and traveltime anomalies, suggesting that fluid was transported through the fault, diverting energy from the hydraulic fracture treatment to re-stimulate the NW end of the well pad.

Acknowledgements
The authors would like to thank the management of Apache for permission to publish this work. The support provided by the sponsors of the CREWES project is also acknowledged.
Related Reading


Join the Conversation
Interested in starting, or contributing to a conversation about an article or issue of the RECORDER? Join our CSEG LinkedIn Group.
Share This Article