AVO attributes (elastic rock properties) crossplotting and simultaneous seismic inversion are used in an integrated approach to discriminate dolostone from limestone lithologies in the carbonate Leduc bitumen reservoir located in northeastern Alberta. The profile sections of density, compressional and shear impedance are generated through the simultaneous seismic inversion procedure. The outcome is used later in computation of elastic parameters such as rigidity, incompressibility, and Young’s modulus. 3D crossplotting of different elastic properties shows that Vp/Vs ratio, LambdaRho (LR), Young’s modulus product (ER) and compressional impedance (Zp) attributes constitute the best indicators of the subtly differing lithologies of the Leduc Formation, and careful application of these allow dolostone to be successfully distinguished from limestone.
Introduction
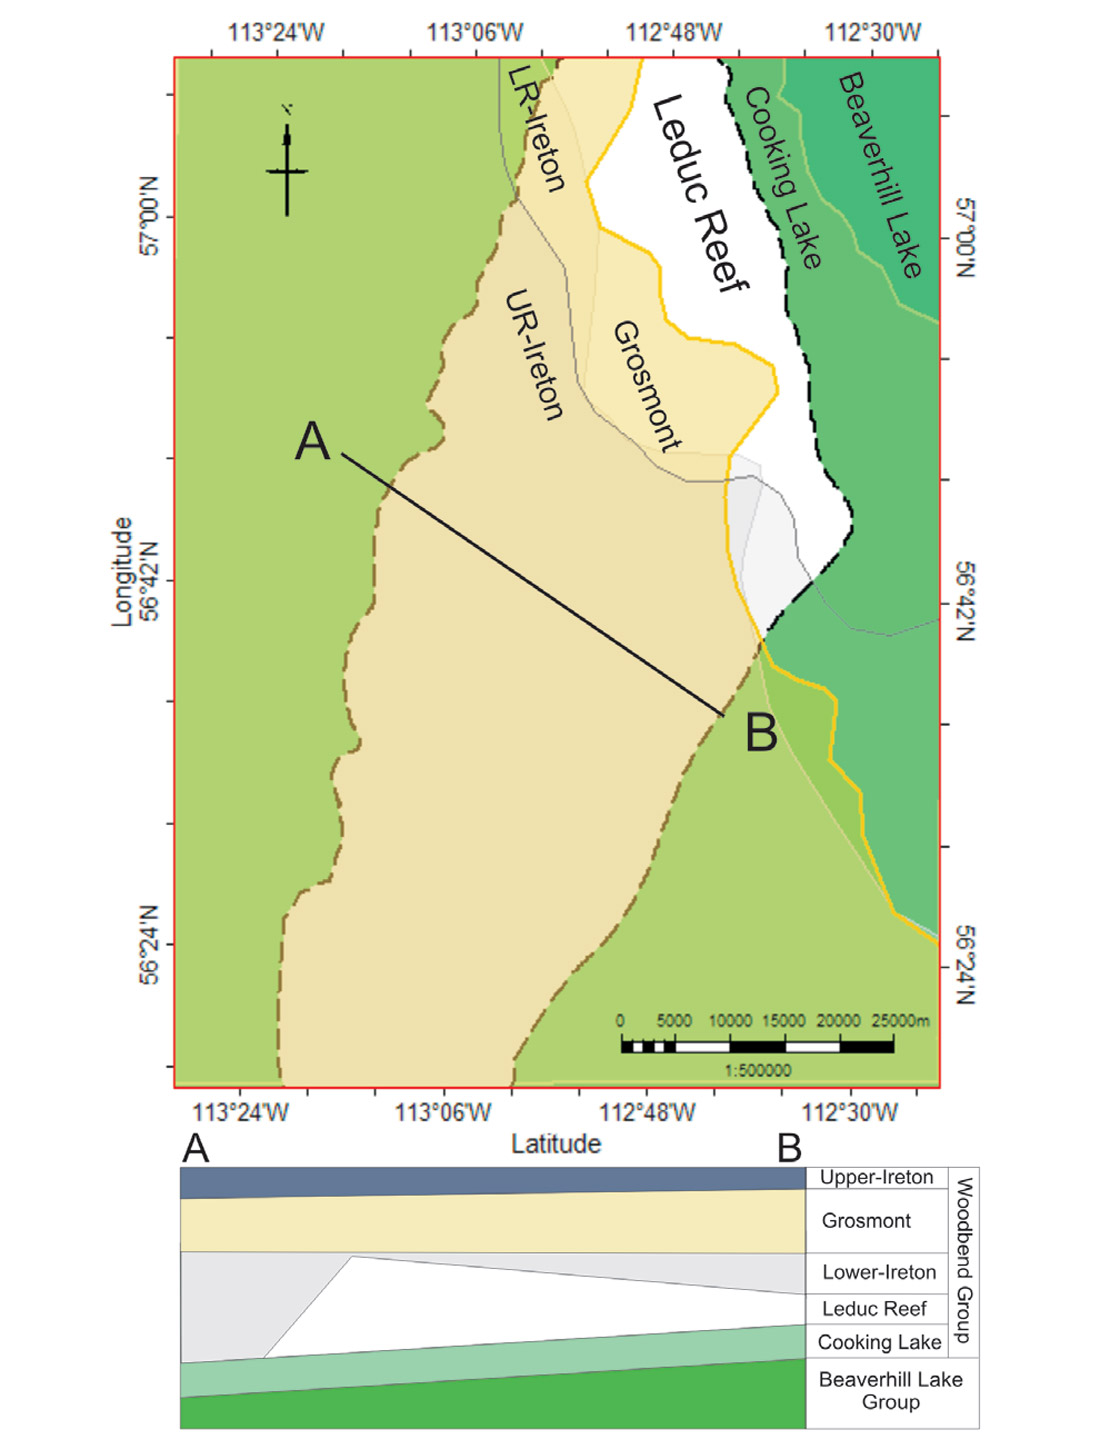
The Devonian Leduc Formation is one of the carbonate bitumen reservoirs in the Athabasca region of northeastern Alberta. Seismic characterization of the Leduc Formation in this area shows that it is a single continuous northeast-southwest trending reef complex (Dembicki and Podivinsky, 2012). The Leduc Formation, which belongs to the Upper Devonian Woodbend Group, conformably overlays the Cooking Lake Formation and subcrops beneath the Grosmont, Ireton and younger Cretaceous sediments (Figure 1). The cross section A-B crossing the Leduc reef (outlined in stippled black line) in Figure 1 represents the generalized geologic structure of this study area. This formation is extensively dolomitized along the western reef margin. In contrast, limestone is the dominant lithology east of the reef margin. Dolomitization is an important diagenetic process in this reservoir because the dolostone is more porous and permeable than the limestone. Therefore, understanding the distribution of the dolostone and limestone lithology in the Leduc Formation is critical in predicting reservoir quality and in directing exploitation of the bitumen resource.
Well logs only provide local information; and for this reason AVO attributes generated from the seismic data are often used to discriminate lithology and predict rock properties away from the wellbore. This methodology has been used for many years in the petroleum industry to distinguish lithologies such as siliciclastics from carbonates or gas from liquid filled sediments (Fatti, 1994; Goodway et al., 1997; Madiba, 2003) where material contrasts are generally large. Here, however, we attempt in this area to differentiate dolostone from limestone.
Methodology
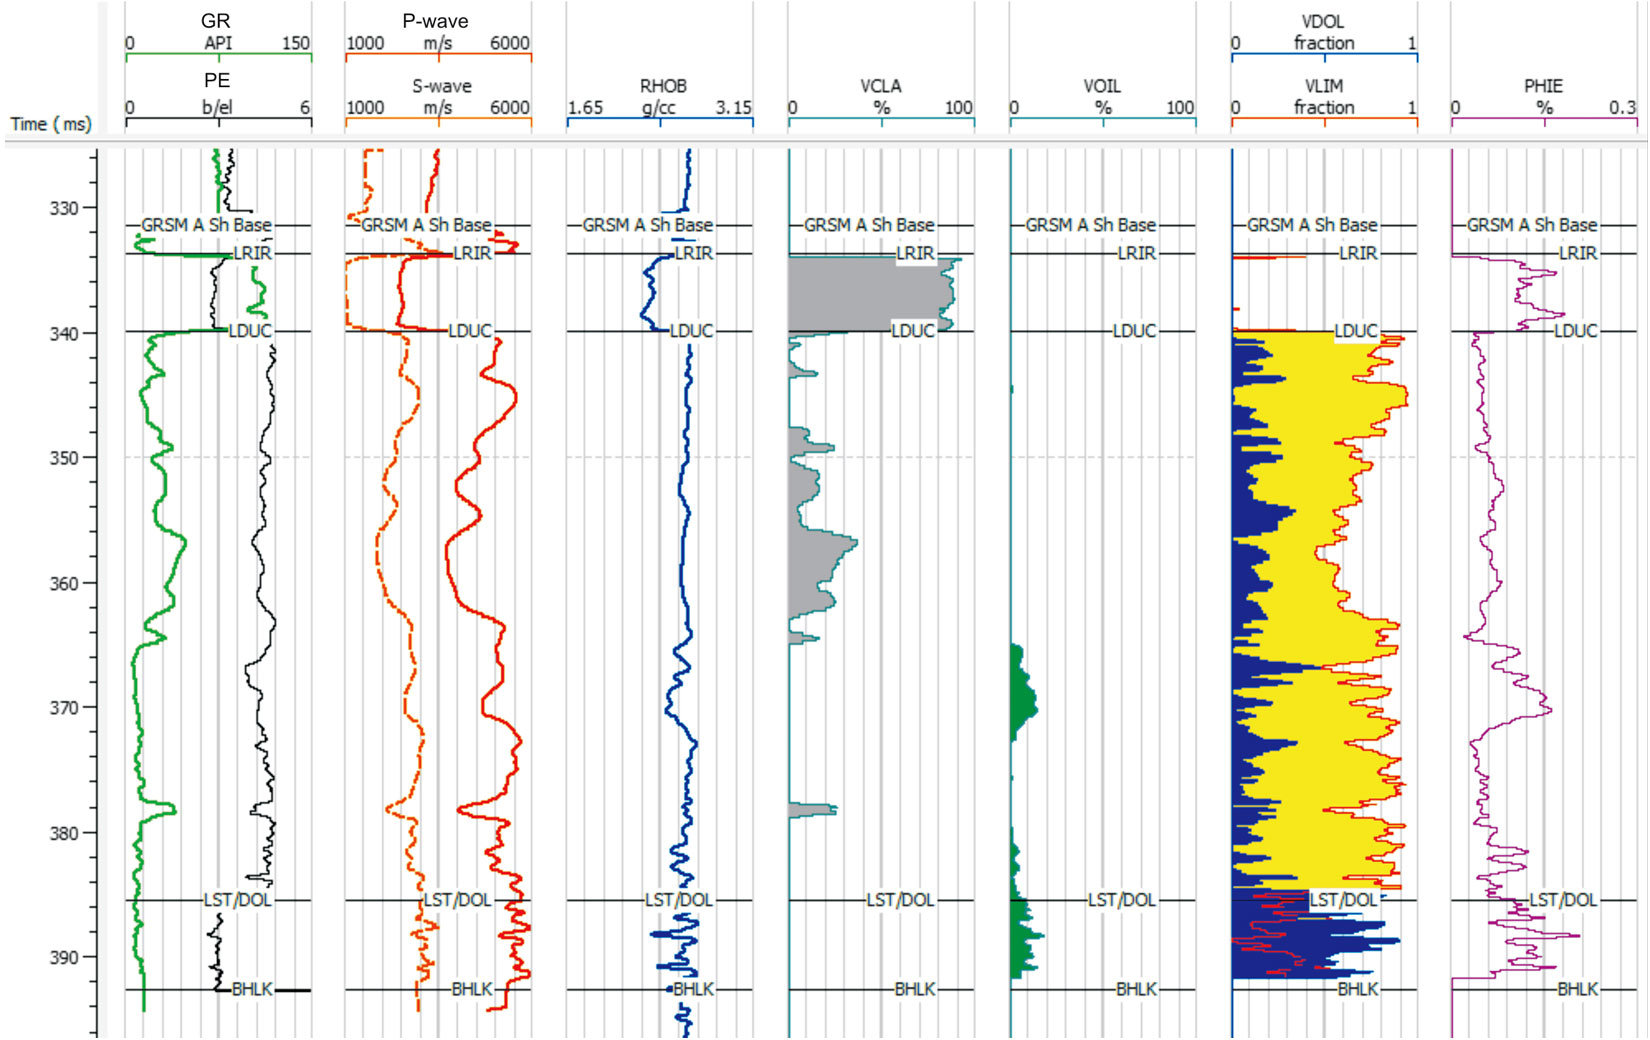
The work carried out in this study can be divided into 4 steps: 3D crossplot analysis, seismic data conditioning, seismic inversion and rock physics analysis. The available data consist of a 2D seismic profile and a full well log data set of a well offset approximately 10 m from the seismic profile. Figure 2 illustrates the time plot of gamma ray (GR), photoelectric (PE), compressional (P-wave) and shear (S-wave) sonic velocities, density (RHOB), effective porosity (PHIE) and interpreted volumetric oil (VOIL) and lithology logs including VCLA, VDOL and VLIM which are volume of clay, dolostone and limestone respectively. Lithology logs are derived by pattern recognition of the gamma ray, sonic, density, and neutron-log responses. The LST/DOL line on the plot corresponds to the limestone-dolostone boundary in the Leduc Formation. The coordinates of the seismic profile and borehole cannot be revealed due to confidentiality.
3D crossplot analysis
3D crossplot analysis is the first step to find the appropriate AVO attributes that would efficiently differentiate dolostone from limestone. These elastic properties are calculated using the log-derived information. Quantitative analysis of the calculated parameters indicates that although dolostone and limestone have almost identical elastic properties the dolostone samples have larger values of compressional impedance (Zp), Young’s modulus product (ER) and Lamé parameters (LR and MR) compared with limestone (Table 1).
| Elastic property | Dolostone | Limestone | Comment |
|---|---|---|---|
| Table 1. Elastic properties of dolostone in comparison with limestone (log-derived information). | |||
| Compressional velocity-Vp (m/s) | 5150-6200 | 3200-5800 | from compressional sonic log |
| Shear velocity-Vs (m/s) | 2800-3550 | 1800-3150 | from shear sonic log |
| Compressional impedance-Zp (g/cc*m/s) | 12000-16500 | 9500-15500 | Zp= ρ*Vp |
| Compressional impedance-Zp (g/cc*m/s) | 6500-9500 | 4500-8500 | Zs= ρ*Vs |
| Shear impedance-Zs (g/cc*m/s) | 2.3-2.7 | 2.45-2.7 | |
| VpVs ratio | 1.7-1.9 | 1.76-2.1 | |
| Lame parameter*density-LR (GPa* g/cc) | 60-118 | 45-100 | LR=Zp2-2Zs2 |
| Shear modulus* density-MR (GPa* g/cc) | 42-90 | 22-70 | MR=Zs2 |
| Young’s modulus*density-Eρ | 130-250 | 30-160 | ER= MR [(3L+2M) / (L + M)] |
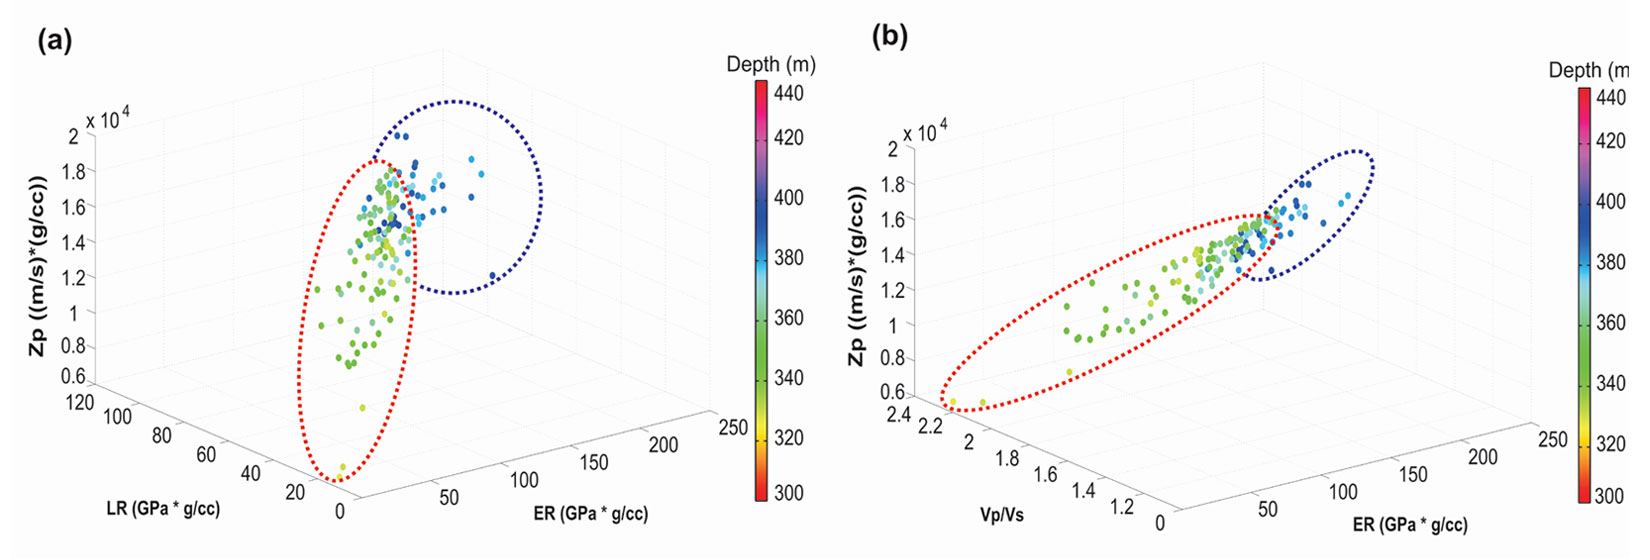
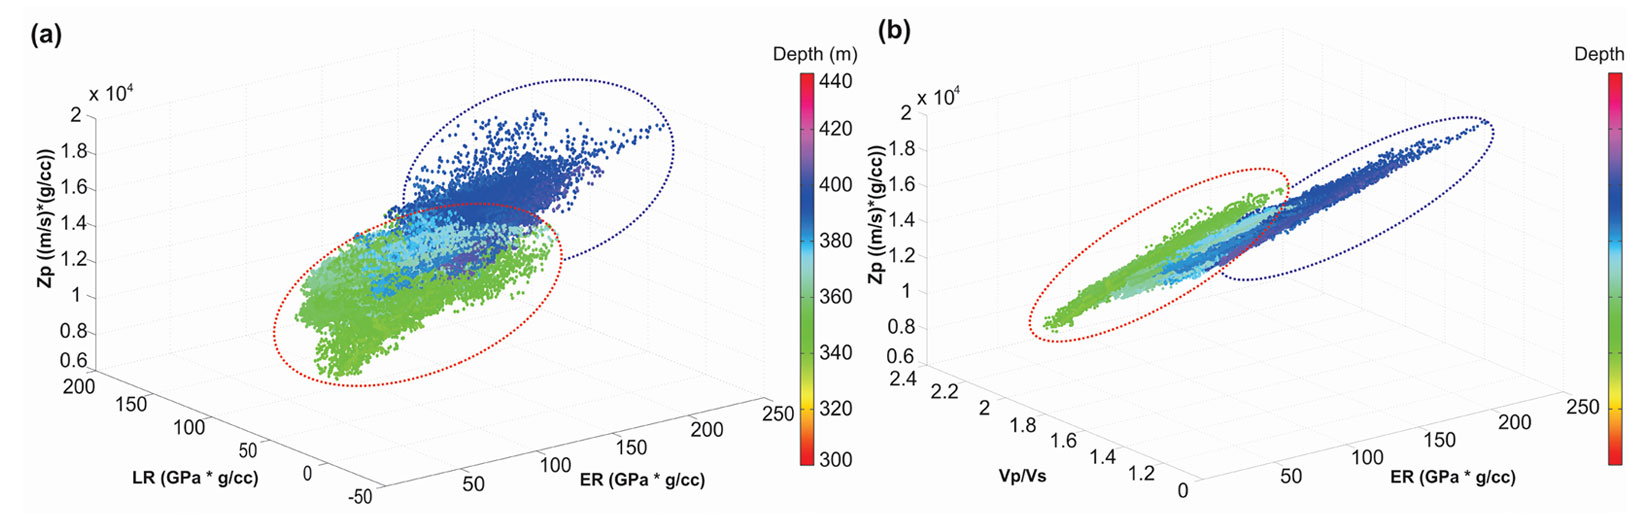
Having almost similar properties, plotting the appropriate combination of diagnostic parameters has a significant role to improve clustering dolostone from limestone samples. Evaluating different combinations of attributes indicates that 3D plots of Zp, LR, ER and Vp/Vs ratio are the best plots to distinguish clusters of these rock types (Figure 3a and b). The cross plot patterns identified at the well location are then used to further investigate cluster patterns on seismic crossplots (Chopra et al., 2003). The blue and red enclosures in Figure 3 define dolostone and limestone clusters respectively. The dolostone samples in these plots appear to have larger values of elastic attributes compared with limestone.
Seismic pre-conditioning and simultaneous inversion
The seismic data for this study is conditioned to preserve the amplitude versus offset response. For this purpose the super gathers created from the prestack data are transformed from the time-offset to the time-angle domain using the ray parameter algorithm. Bandpass filtering, Radon and trim statics are applied for noise suppression and migration move-out correction.
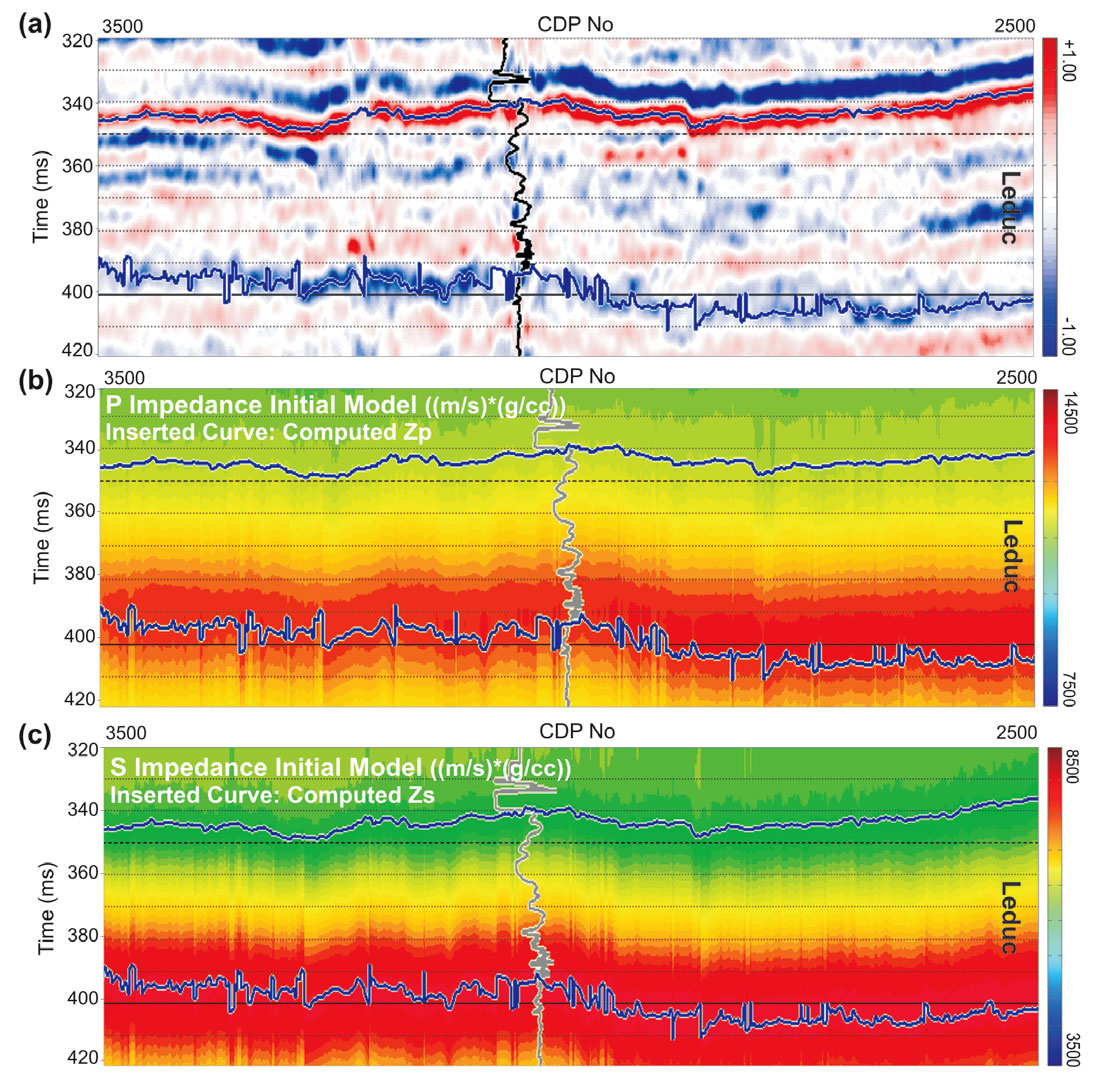
The processed seismic data (Figure 4a) is utilized later as an input for simultaneous inversion. Prior to low frequency impedance modeling (Figure 4b and c) and inversion we calibrate the logs to the seismic data using a synthetic seismogram and the near-angle traces from close to the well. Another input for seismic inversion is the angle-dependent wavelets extracted from multiple angle seismic data. The multiple angle seismic sub-stacks and their associated wavelets are then simultaneously inverted to compressional impedance, shear impedance and density as outputs. The low frequency initial model, partial stacks and wavelets are enabling inversion to effectively compensate for offset-dependent phase, bandwidth, tuning and NMO stretch effects (read more in Hampson, 2005).
Rock physics analysis
The Zp, Zs and density sections are used to derive elastic rock parameter profiles using the relationships in Table 1. Selected profiles for seismic crossplotting are presented in Figure 5. Although Zp (Figure 5a), ER (Figure 5b) and Vp/Vs ratio (Figure 5d) profiles illustrate distinctive facies (the arrow in Figure 5a is a limestone-dolostone boundary at the well location), the LR (Figure 5c) does not show a great deal of variation. One explanation is that LR is more sensitive to pore fluid and less to matrix properties (Schmitt, 2014). The Zp log is superimposed on all the profiles of this Figure. Crossplotting the elastic rock properties derived from seismic, limestone and dolostone lithology clusters (Figure 6) similar to log-derived ones (Figure 3) appear in the 3D space.
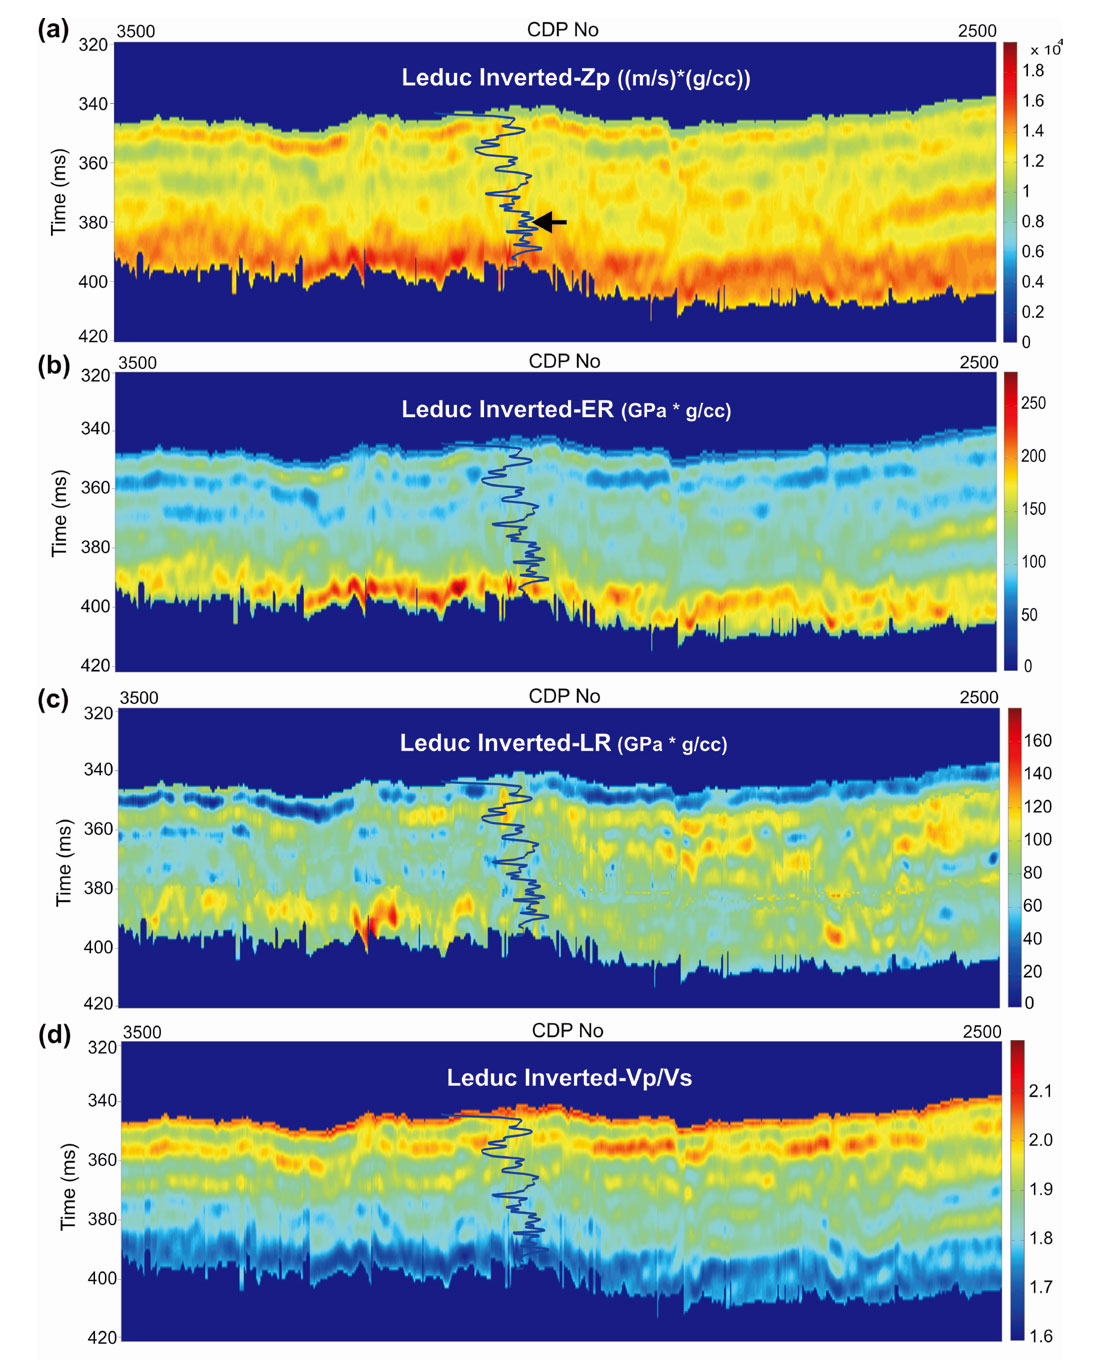
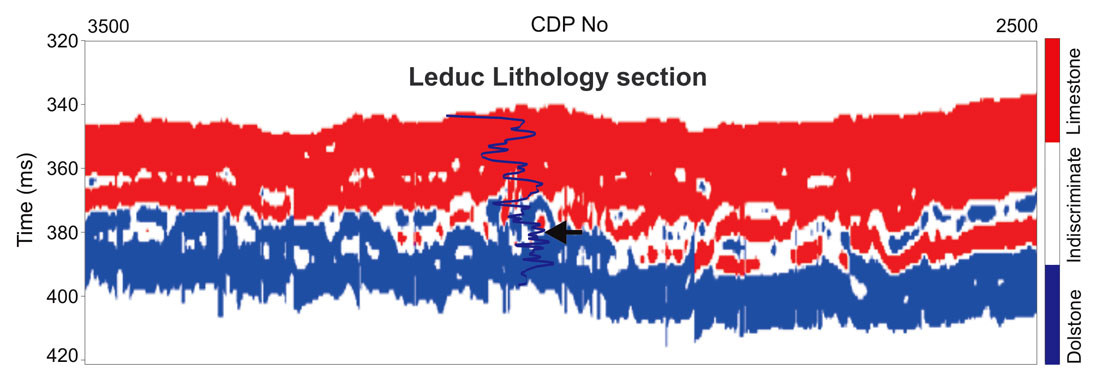
Having the seismic section color coded according to the enclosures observed on the 3D crossplots in Figure 6, the limestone and dolostone parts of the Leduc reservoir are well discriminated (Figure 7). White color areas in Figure 6 represent indiscriminate lithology due to either overlapping enclosures or outliers in the 3D seismic cross plots.
Conclusions
This study demonstrates the value of elastic rock properties for detailed mapping of reservoir lithology in the Leduc Formation. After applying constrained prestack inversion to the seismic 2D profile, we simultaneously generate compressional impedance, shear impedance, and density profiles. The calculated ER, LR, Vp/Vs ratio and Zp are recognized as the best attributes in dolostone-limestone discrimination. Leduc reservoir lithology mapping allows the identification of additional areas of potentially good reservoir quality for future drilling.

Acknowledgements
The authors wish to thank Athabasca Oil Corporation for providing the data set, relevant software, and permission to publish the work. We also thank Eugene Dembicki and Muhammad Ashfaq for many discussions and Lisa Robinson for the workflow assistance and support.


Join the Conversation
Interested in starting, or contributing to a conversation about an article or issue of the RECORDER? Join our CSEG LinkedIn Group.
Share This Article