Introduction
Historically, the design of land seismic surveys has been subject primarily to two influences: the overall dimensions and station spacing of the survey for both sources and receivers has been governed by the depth and configuration of the geological target zone; and suppression of the ever-present source-generated coherent noise has dictated the design of source and receiver arrays, and sometimes influenced the multiplicity (fold) of the survey. The overriding principles were to avoid spatially aliasing geological structure in the image, and to avoid recording coherent noise. However, while we still honour the principle of not aliasing structure, we are beginning to adopt a different view with respect to noise. With high dynamic range seismic acquisition equipment and current processing techniques, it now appears that noise can be most effectively eliminated by recording it as accurately as possible, without aliasing, and then by estimating and subtracting it. For design purposes, this means that only the overall dimensions of the survey are determined by the geological target, and that with no surface arrays, station spacing is determined by the requirement that we do not alias coherent noise. The anti-aliasing criterion for coherent noise is almost always more stringent than for geological structure and will almost certainly ensure that geological targets are more than adequately spatially sampled.
Over the past several years, we have performed three different seismic acquisition experiments, whose goal was to explore the advantages/disadvantages of various seismic field geometries with single, closely-spaced geophones, as well as to explore the best way in which to deploy the source with these high-resolution spreads. Concurrently with the field experiments, we developed processing sequences for taking advantage of the particular characteristics exhibited by the acquired data and obtaining the best possible subsurface image.
While the scale of our experiments was relatively small by exploration standards (the longest profile was only about 1 km in length), due to our limited resources, we feel that our results should, nevertheless, provide guidance to anyone interested in pushing the resolution limits in seismic imaging, particularly for important prospects or known targets.
Slaying some sacred cattle (or at least frightening them a little)
Those of us in the seismic exploration business are just as prone to following ‘traditional’ ways of doing things as most other folks; and methods for acquiring and processing seismic data are often quite entrenched in our culture. In this article, we hope to spur the reader to examine some of the ‘sacred cattle’ of seismic acquisition and pre-stack processing, in search of improved seismic imaging.
The geophone array
If ever there was a sacred cow that needed confronting, it is the use of the geophone array as the principal weapon against coherent noise generated by the seismic source. To be sure, a geophone array does attenuate coherent noise, but array performance almost never approaches design specifications for noise suppression, due to the inevitable irregularities in phone spacing, phone coupling, and near-surface velocities encountered in an actual field situation. Furthermore, arrays work best when the station spacing is large enough that an array length can see at least one complete wavelength of the noise; and they become less effective as we shorten the station interval (and array length) for higher spatial resolution. We propose to slay this aging beast by recording seismic data with single well-planted geophones or accelerometers, and subsequently applying processing algorithms which are inherently more effective for suppressing coherent noise than the simple hard-wired summation employed in geophone arrays (Hoffe et al., 2002).
Spatial sampling criteria
Another ‘holy bovine’ concept that we intend to challenge is the criterion used to design most seismic surveys: that the spatial sampling of the wavefield on the surface should be determined solely by the size and shape of the geological target to be imaged, and the bandwidth of the seismic source signal. We propose, instead, that the overall dimensions of a given survey should, indeed, reflect the target size, depth, and dip; but that the spatial sampling should be primarily determined by the requirement that we protect the recorded coherent noise against significant aliasing. In almost every case, we will find that the anti-aliasing requirement for coherent noise is more stringent than the structural antialiasing requirement for imaging, and that by satisfying the former, we automatically satisfy the latter.
Conventional processing
A third, less imposing sacred cow that we will at least confront is the use of certain conventional processing techniques to prepare raw data for imaging, specifically coherent noise attenuation methods like f-k filtering; which are sometimes used more because they are ‘traditional’ than because they are truly effective. Our questioning of conventional noise attenuation techniques is not unique; but we present here a particular alternative processing sequence, which has proved quite effective in preparing noisy field data for imaging; and we demonstrate it on our experimental data. We do not deal with one important aspect of pre-stack processing: the derivation and application of static corrections, a topic worthy of much more detailed consideration.
The experiments
In 2006, we performed the first of three field experiments, using the University of Calgary seismic acquisition system, on a section line road northeast of the town of Longview. Based on extensive analyses of the results of that survey, we subsequently performed a smaller, higher resolution survey with the same equipment at our field test site near Priddis early in 2008, followed in early 2009 by a larger survey at the same site, with significantly different field parameters. Below, we will describe each of these experiments in detail, spending the most time on the 2006 experiment, because of its more extensive analysis; but describing what additional knowledge we obtained from the subsequent experiments.
2006 Longview survey
In August 2006, several members of CREWES, as well as staff from the Department of Geoscience conducted a small seismic survey on a 1 km portion of a section line road intersecting secondary road 543 east of the town of Longview, Alberta. The experiment was intended as a shakedown test of the University’s new seismic acquisition system prior to the 2006 Department field school, as well as a test of high resolution survey methods. Because of promising results from an earlier experiment using 5 m geophone spacing, the new survey was designed for 2.5 m spacing. The spread was 937.5 m in length, with 376 single geophone stations. For this survey, shots were spaced every 5 m along the line, which was shot from one end to the other without moving any portion of the spread. The source was the University’s new mini-vibrator, emitting 4 sweeps per shot location, each linear sweep being 10-200 Hz over 8 seconds. Listening time was 2 seconds, and the data were diversity-stacked and correlated in the field.
Creating data sets with coarser station spacing
Our strategy for examining the possible benefits of high-resolution seismic techniques was to first image the complete high-resolution data set, then to compare it to four other data sets corresponding to coarser spatial sampling. We created these data sets by using all of the same original shot gathers, but decimating the receiver stations to simulate shot gathers with receiver intervals of 5 m, 10 m, 20 m, and 40 m. The decimation was done by applying appropriate trace mixing to the input gathers before decimation, to simulate deploying the original geophones in arrays, to attenuate non-horizontal wavefronts (coherent noise). All the traces of the original survey were used in creating each decimated data set, and the stack fold (in terms of individual receivers) at each decimated CDP was the same as the stack fold of the corresponding CDP in the original data set. In other words, the data set for each of the four simulated geometries actually had higher fold than an actual field experiment using that geometry. Each of these four new data sets was processed identically, allowing only for the differences in acquisition geometry.
Processing—noise removal and deconvolution
The processing flow for each of the data sets was identical, except that parameters obtained from visual examination of a particular data set (like noise velocities) were used to process only that data set. The shot gathers were first visually analysed for coherent noise. All visible noises were sequentially estimated and subtracted using radial trace filtering (Henley, 2003). Our choice of radial trace filtering was motivated by our past experience that coherent noises, especially first arrivals and shallow refractions, are often better separated from signal in the radial trace (RT) domain than in the f-k domain. Single trace Gabor deconvolution was then applied to the shot gathers (Margrave et al., 2002). Since Gabor deconvolution operates in overlapping time windows, residual coherent noise appearing in one or two windows tends to be further diminished by a Gabor decon operator derived from the whole trace. Gabor deconvolution was also applied in the radial trace domain to all the gathers in each data set to remove residual air blast, reduce short period multiples, and equalize reflection strength over angle.
Processing—moveout velocity and statics
NMO velocity analysis and statics derivation were performed only on the 2.5 m data set and subsequently shared with the other sets, in the interest of providing comparable stack and migrated images in which the simulated receiver array geometry would be the only significant difference between the data sets. When forming the simulated geophone arrays, a single average static was applied for each array, as would be the case in a real experiment.
Processing—stacking and display
Each data set was CDP stacked with the common NMO velocity function, using the newly decimated CDP bins created for each data set. In order to create displays with comparable appearance, the four decimated raw stacks were interpolated to the same trace density as the original 2.5 m stack before plotting with variable density. FX phase spectra were computed for each raw stack, at the original lateral resolution of each individual stack, in order to identify the highest coherent frequency for each stack. Poststack migration then provided the final images for each data set, in which to compare bandwidth and lateral resolution.
Results—raw shot gathers
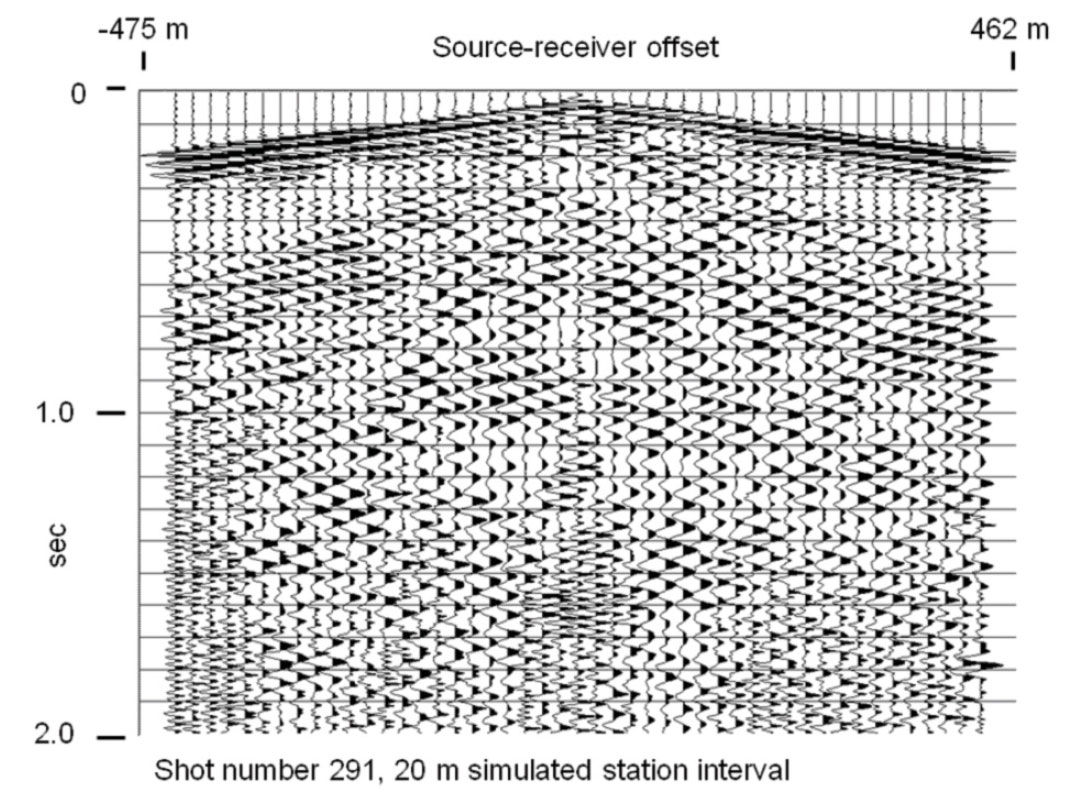
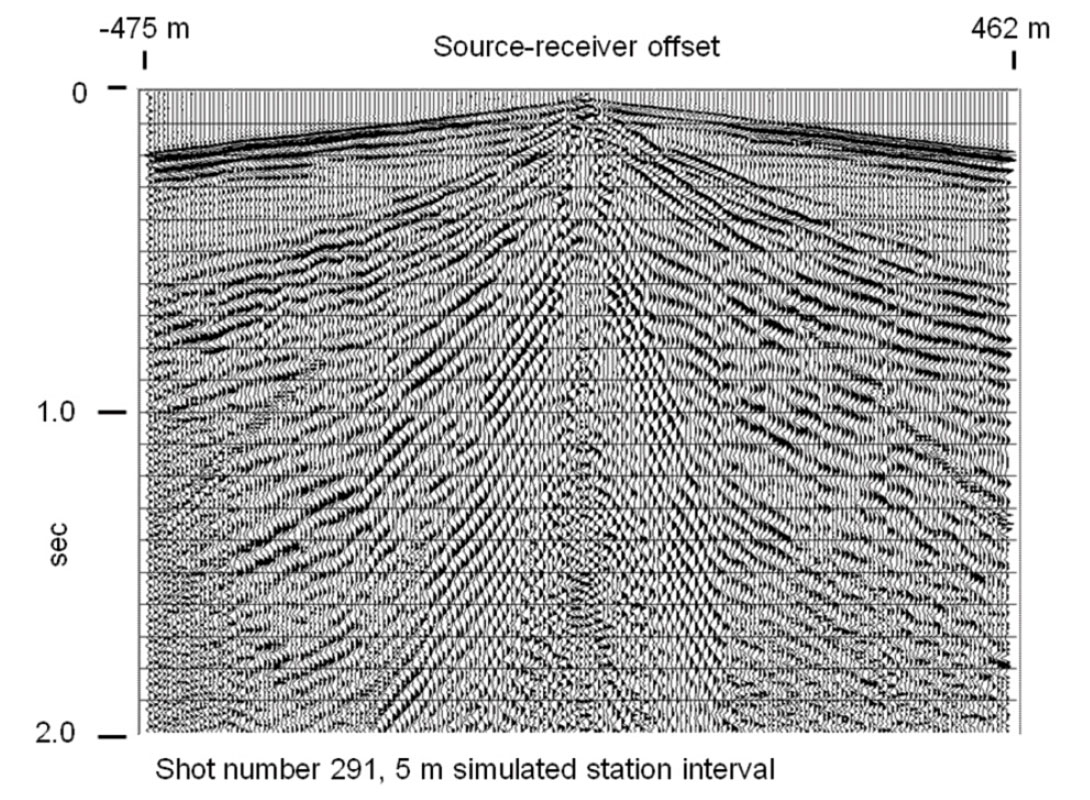
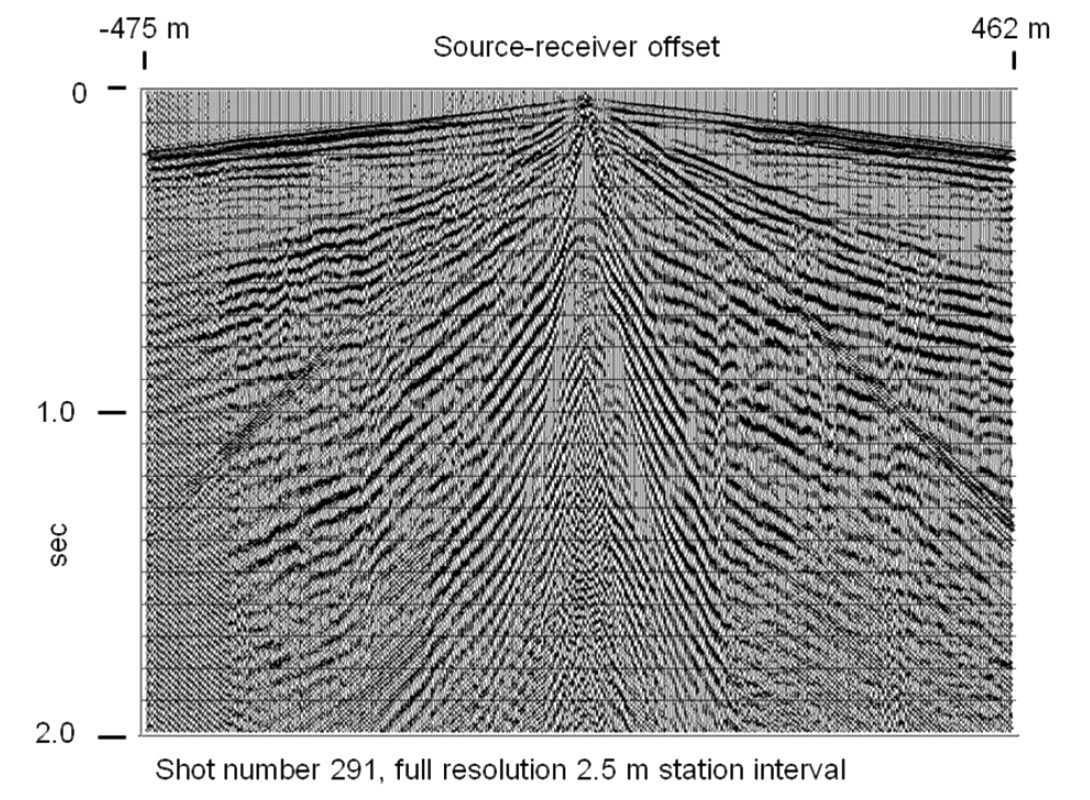
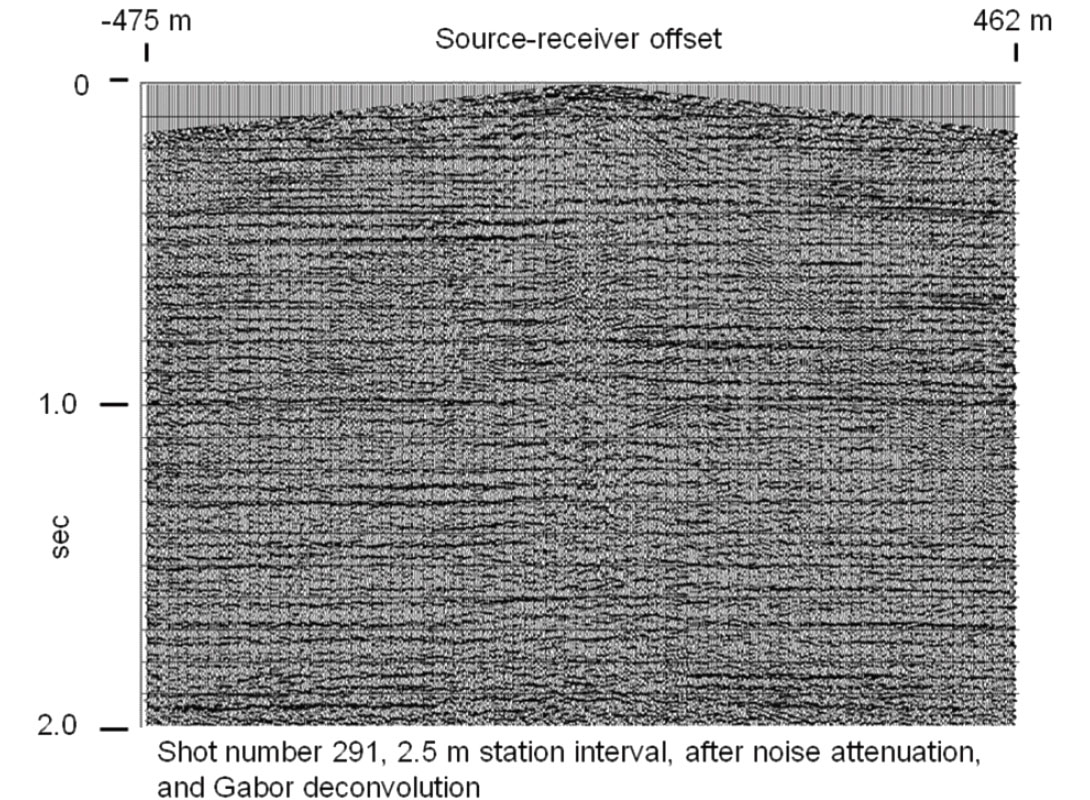
Figure 1 shows the shot gather from source point 291 as it would appear had it been acquired with 20 m receiver spacing using 9- phone arrays of geophones spaced 2.5 metres apart. Faint reflections can be found at about 0.4 s in the wedge-shaped zone between the first arrivals and the deeper cone of linear coherent noise. Many of these slower coherent noises are badly aliased— but this cannot be seen reliably on the display. The same gather acquired with 10 metre simulated station spacing with 5-phone arrays is shown in Figure 2, where some of the hidden aliased noise becomes more apparent. Figure 3 shows 5 metre spacing and even more noise. The ultimate, however, is Figure 4, which displays the original shot gather with 2.5 m receiver spacing. Very little aliasing affects this gather, and as a result, most of the coherent noise can be visually detected and accurately characterized, even including air-borne 60 Hz noise from the generator mounted on the acquisition truck, on the left end of the gather. Almost no reflection energy can be detected on this gather. While some might argue that Figures 1 and 4 are evidence that geophone arrays are effective, we argue that the noise which can be seen in Figure 4 and not in Figure 1 is not much attenuated by the simulated arrays, but instead is aliased and is simply not recognizable, even though it still contaminates the data.

Results—processed shots
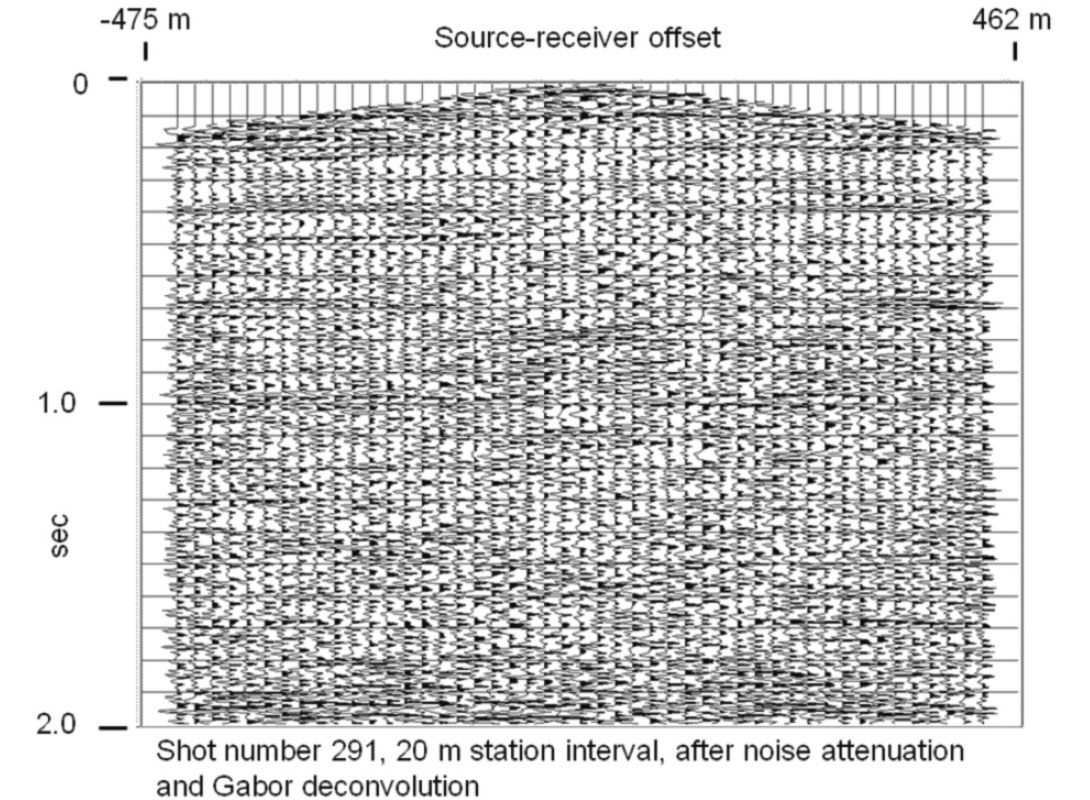
To emphasize our point, Figures 5 and 6 compare the shot gathers for 20 m spacing and 2.5 m spacing after each has undergone a complete sequence of processing, including: multiple passes of radial trace filtering to model and remove successive layers of coherent noise (all filters designed by measuring velocities of visible noise on the gathers); Gabor deconvolution; then Gabor deconvolution in the radial trace domain. Clearly the 2.5 m gather is superior, exhibiting much more reflection continuity and a lower level of residual noise.
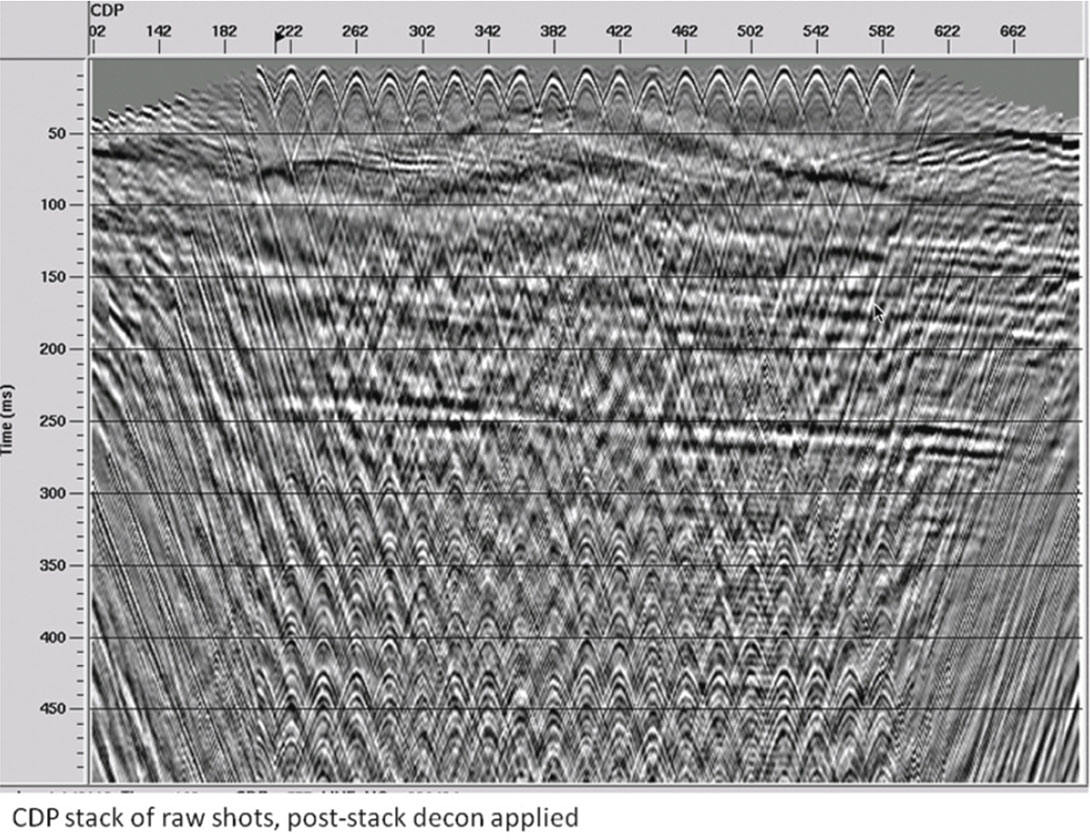
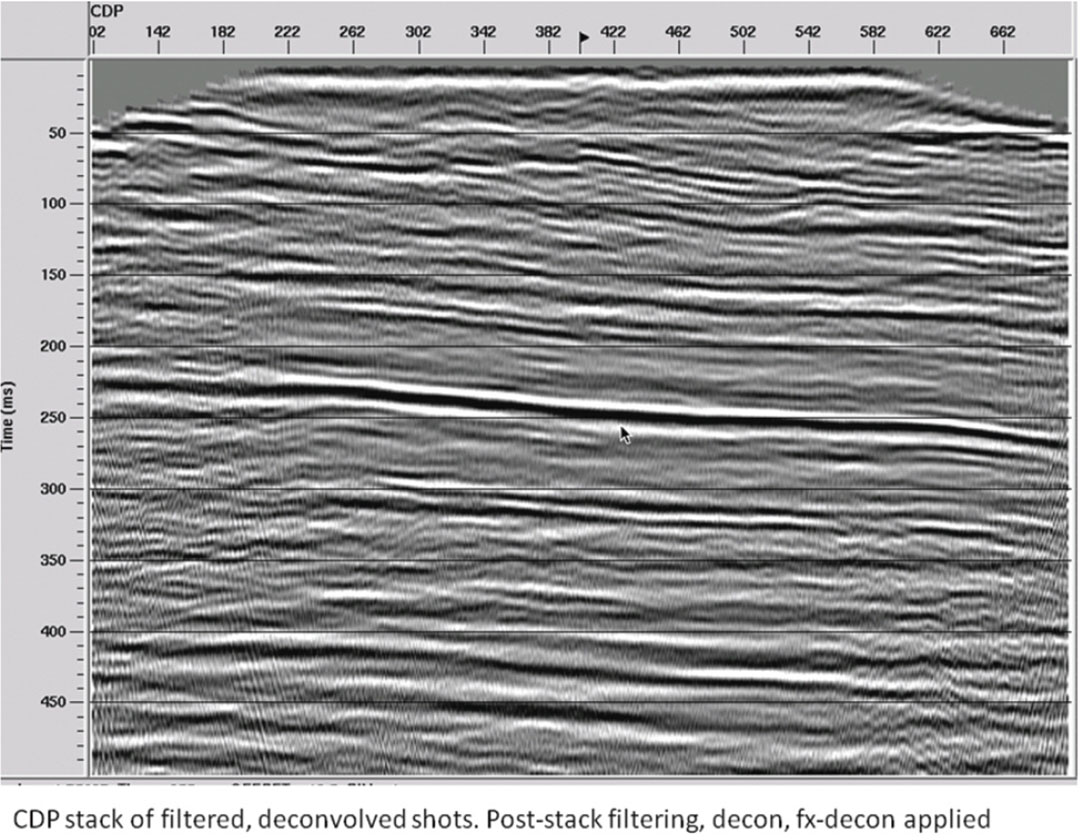
Results—CDP stack
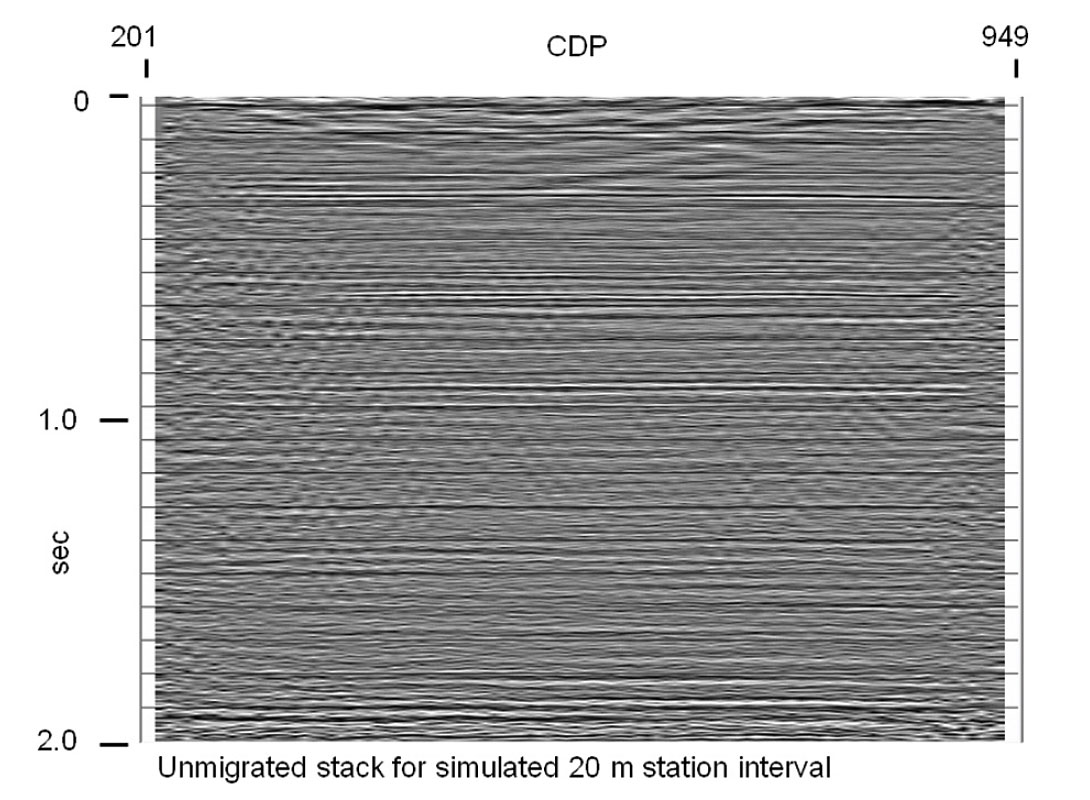
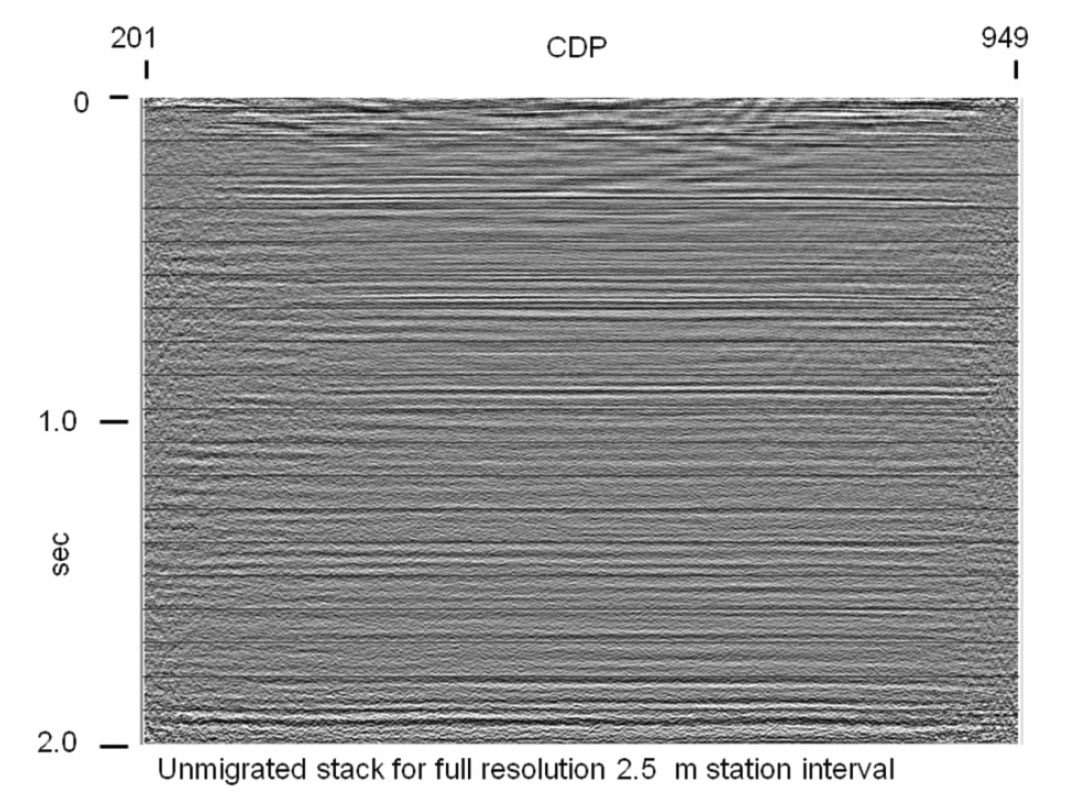
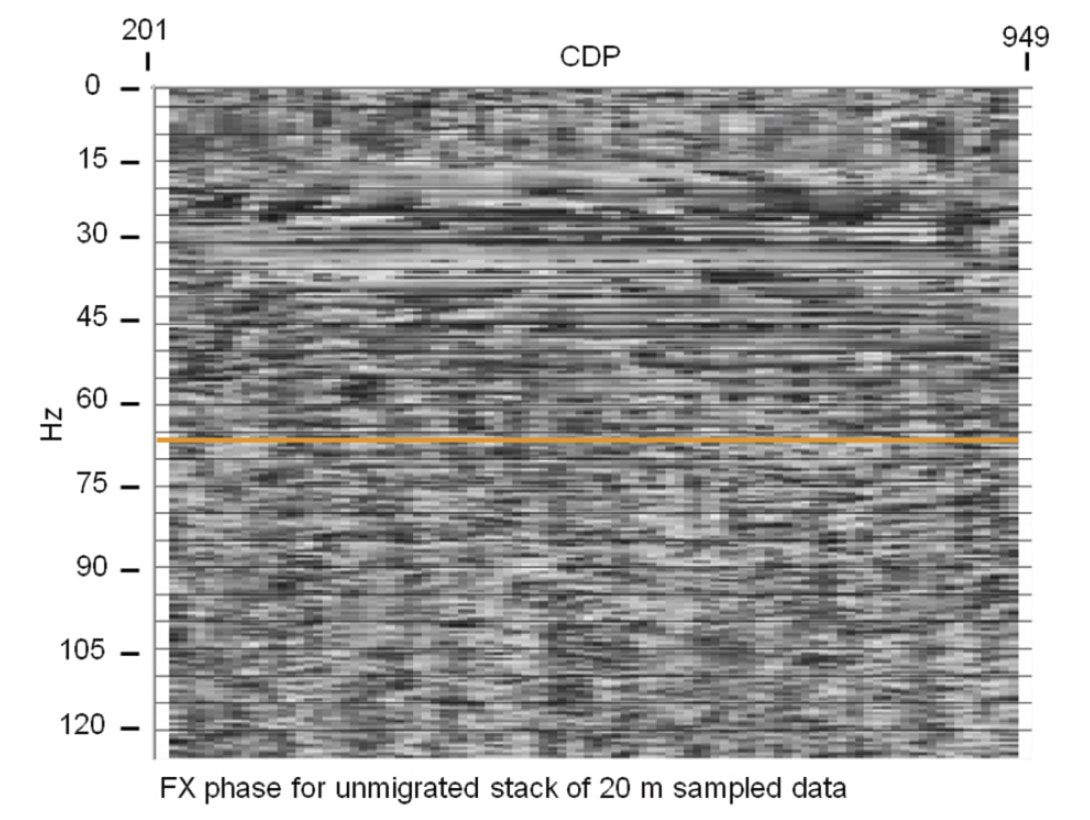
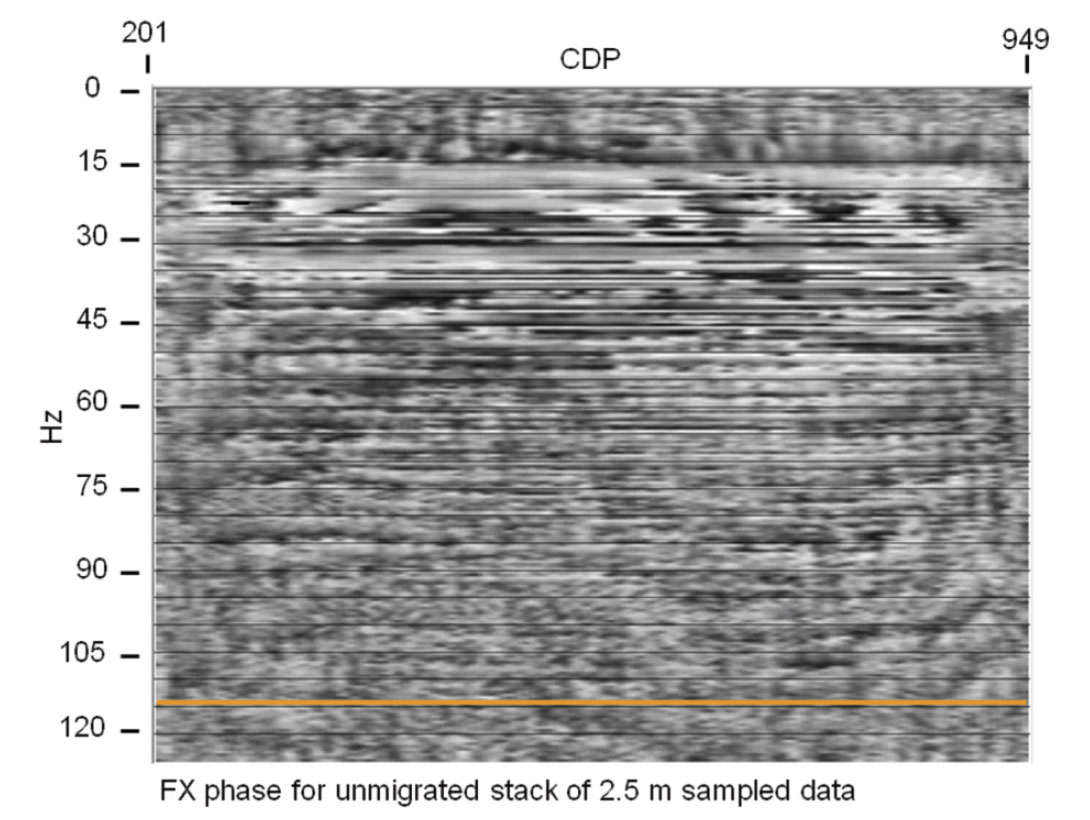
Figure 7 is the CDP stack of the 20 m survey after all shot gathers were processed like the one above, and Figure 8 is the comparable CDP stack of the 2.5 m survey. Surprisingly, at this scale the 20 m stack does not look much different than the 2.5 m stack, except for a little residual coherent noise. The FX phase spectra tell a different story, however. Whereas the highest frequency at which phase is laterally continuous on the 20 m CDP stack is about 65 Hz (Figure 9), the 2.5 m CDP stack contains coherent information up to 110 Hz (Figure 10).
Results—migrated stack
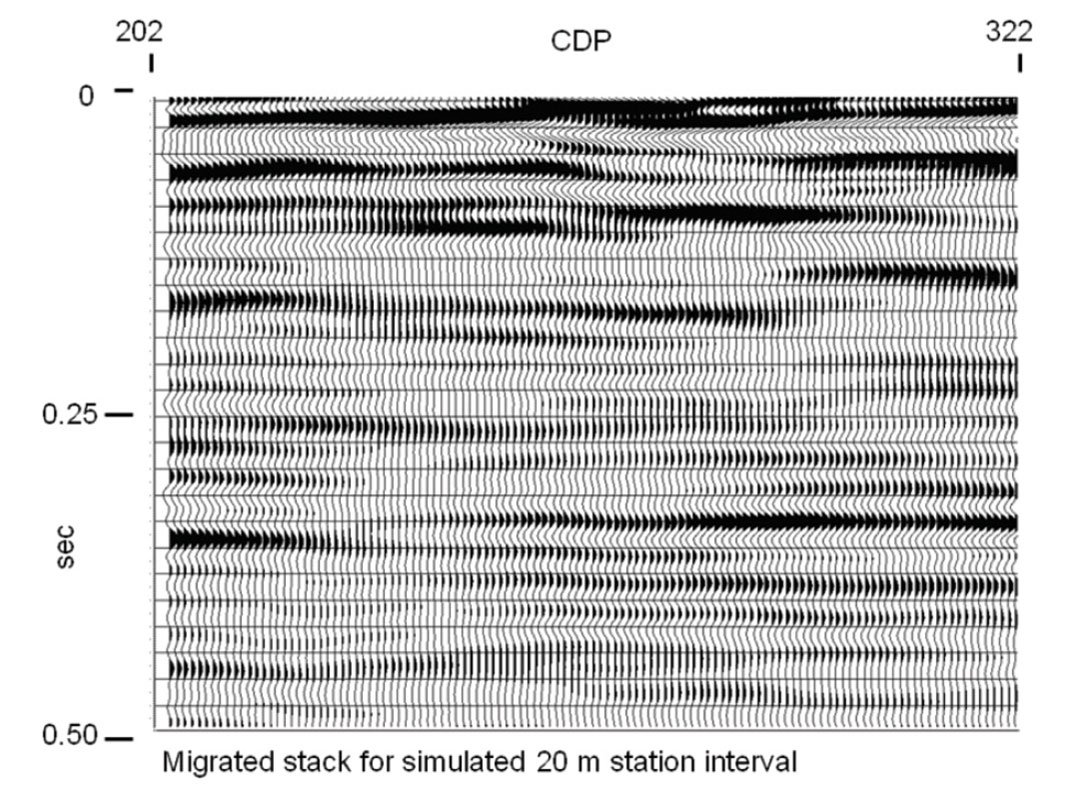
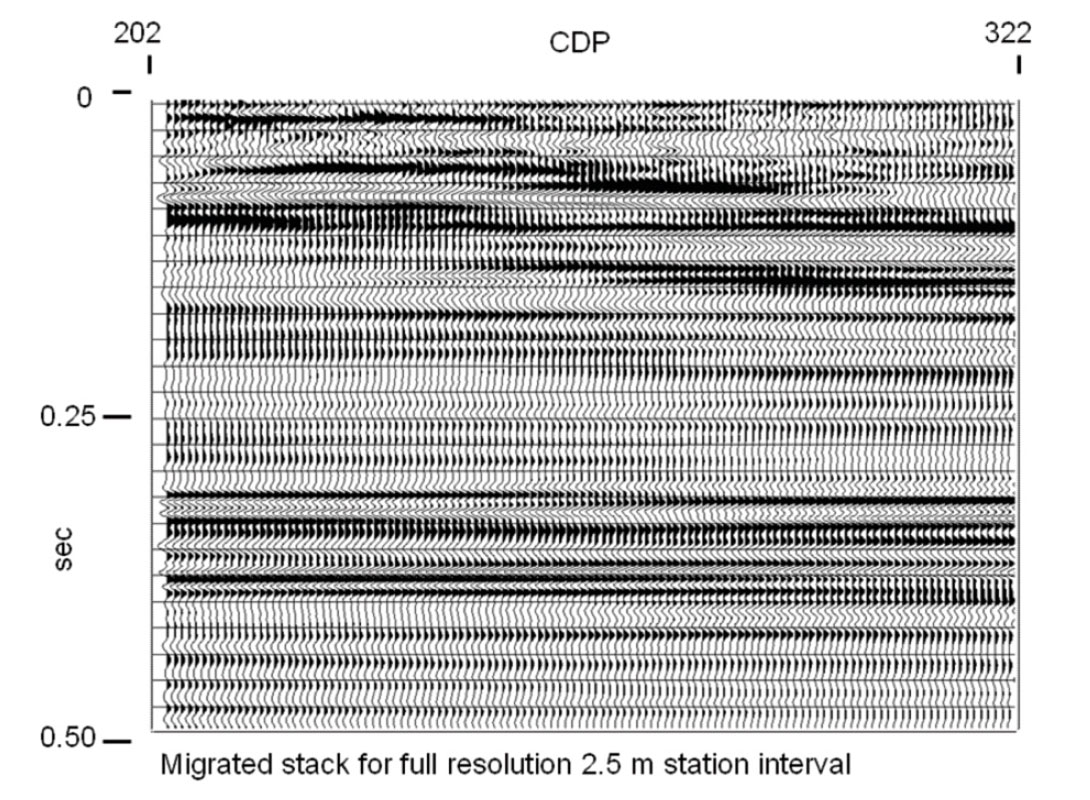
The most persuasive argument for using the 2.5 m receiver spacing, however, can be seen on the migrated stack. Figures 11 and 12 are comparable zoomed portions of the post-stack migrated 20 m CDP stack and the migrated 2.5 m CDP stack, respectively. It is clear from these figures that the finer spatial sampling has led, after processing, to improved seismic resolution, not only laterally, but also vertically.
Summary
Several important lessons were learned from our Longview survey:
- Decreasing the spatial sampling interval improves not only the lateral resolution of a seismic image, but its vertical frequency content, as well.
- Horizontal summing (geophone arrays) is almost never as effective for attenuating coherent noise as modeling the noise and subtracting it, using noise characteristics measured on a properly sampled source gather.
- The mini-vibrator is a surprisingly effective source, allowing us to obtain reflections from as deep as 2 seconds.
- Layout and pickup time for the receiver spread for this line was significantly longer than it would have been for a more conventional line using geophone arrays, with the same number of geophones and geophone spacing. Most of this extra time was spent arranging slack cable to prevent tangles, as we used cables with 12.5 m takeouts for our 2.5 m geophone spacing.
- If similar source effort had been used for a conventional survey on this line, actual acquisition time would be very similar to the acquisition time for our experiment. Only the move-up schedule for the vibrator would have been different, due to fewer source points, but more sweeps per point.
2008 Priddis survey
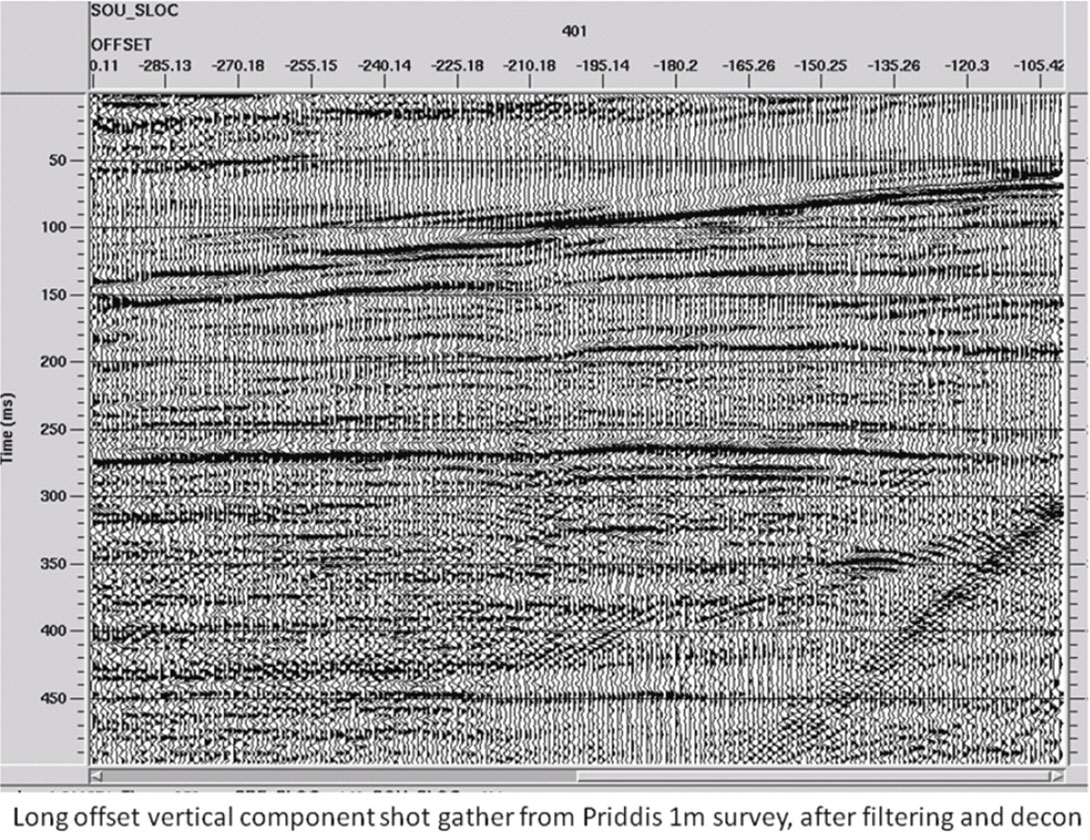
Although the bulk of the coherent noise in the Longview experiment was captured and removed using 2.5 m station spacing, we could still detect some aliasing, particularly for noises travelling at air velocity or less. Thus, we decided to reduce the sampling interval even more; and in March 2008, we conducted a small survey at the University of Calgary Priddis geophysical test site in which the surface sampling was 1 m. Unlike the Longview experiment, we used 3C geophones so that we could examine the resolution issue for horizontal seismic components, as well as vertical. Due to a limited geophone supply, our fixed spread was only 200 m long. The data were recorded using a source line offset 5 m laterally from the geophone line. The source positions along this 400 m long line, centred on the geophone line, were distributed every 10 m, to accommodate a concurrent experiment. Thus, source-receiver offsets ranged from 5 m for the geophone closest to the source position to 300 m for the source positions at the extreme ends of the source line; and the length of the CDP stacked profile for this line was 300 m. The source for the entire experiment was the U of C mini-vibe, using a sweep range of 5 – 250 Hz. The vibrator repeated each source point ten times, and we then employed diversity stacking to obtain a ten fold vertical stack for each source point.
Raw shot gather
Figure 13 shows one shot gather for the vertical component for this experimental line. Similarly to the shot records for the earlier Longview experiment, this gather exhibits almost entirely noise, with little evidence of any underlying reflections. On the other hand, almost all the noise on the record is well-sampled, with no evidence of aliasing. We can even see a scattered air-borne noise created by the direct arrival impinging upon a small depression in the surface of the earth about halfway along the spread. Having recorded the coherent noise so faithfully, we now have the capability to measure its characteristics and attenuate it effectively.

Processed shot gather
We followed our established procedure for noise attenuation on raw seismic data by designing a cascade of radial trace filters to sequentially model and subtract each of several layers of coherent noise, then applying Gabor deconvolution to further reduce residual noise, whiten the trace spectra, and sharpen reflection events. The result of these operations is shown in Figure 14, where we can now see many reflections, from just beneath the first arrival all the way down to 500 ms. Because of the effectiveness of our direct arrival attenuation with radial filtering, it is seldom necessary to apply initial muting to the shot gathers before applying NMO and stacking. Typically, we allow the NMO stretch muting (usually set to 50%) to do all the muting on shot gathers.
The CDP stack
Since the stack fold is quite high on this line (about 200 near the centre), we decided to see whether stacking alone could attenuate the coherent noise without any pre-stack processing. Figure 15 shows the result of stacking the raw shot gathers by CDP, then applying Gabor deconvolution to attempt to whiten the results. Remarkably, even though we can see no reflections on the raw records, they are evident on this CDP stack. However, the residual coherent noise is quite distracting and makes this image only marginally useful. As the stack fold diminishes toward the ends of the line, what reflections are visible disappear into the noise. When we apply pre-stack noise attenuation and deconvolution before stacking, we obtain the image in Figure 16—a result which is superior in every way, showing reflections with higher resolution and greater lateral extent, as well as deeper in time.
Summary
The 2008 Priddis experiment confirmed the following:
- Unaliased coherent noise can be very effectively removed from seismic data, even when its amplitude is very strong relative to the underlying reflections.
- 1 metre receiver spacing is likely the shortest distance needed for anti-alias protection for shot-generated noise—2 or 3 metres would probably be acceptable for most practical purposes.
- The horizontal components of this data set exhibited no unambiguous converted wave events, probably due to inadequate source-receiver offsets (not shown).
2009 Priddis Survey
The March 2009 Priddis 3C-2D survey was laid out on a NE-SW trending line, 800 m long, which crossed the potential site of a future permanent 3D test site at the University of Calgary Priddis property. While we might have liked to conduct this survey using the 1 m receiver spacing of the previous Priddis survey, we had only 200 3C geophones; and we did not have enough channel capacity in our system to record 800 3C phones, in any case. We decided, instead, to space the receivers at 4 m and to reduce the source spacing to 2 m to compensate. We reasoned that if source and receiver coupling were uniform, we should be able to attenuate coherent noise on receiver gathers instead of shot gathers. Because of the frozen ground, all 200 3C geophone positions had to be drilled into the surface, requiring about 1 ½ days for complete deployment (planting the 800 phones needed for 1 m spacing would have been quite tedious). In addition, a vehicle lane was ploughed through the snow down to bare ground just adjacent to the receiver line on its north side, in order to accommodate the line trucks and mini-vibrator source. The data were recorded over a period of about a day using our mini-vibe with a sweep of 8-150 Hz, four sweeps per source point. The source points were spaced 2 m apart, and there were a total of 400 source positions for the line. Since the ground was frozen, good coupling was observed for the source at all positions, as well as for all 200 receivers. Good reflections could be seen even on the monitor records, after application of a simple low-cut filter.
Raw gathers
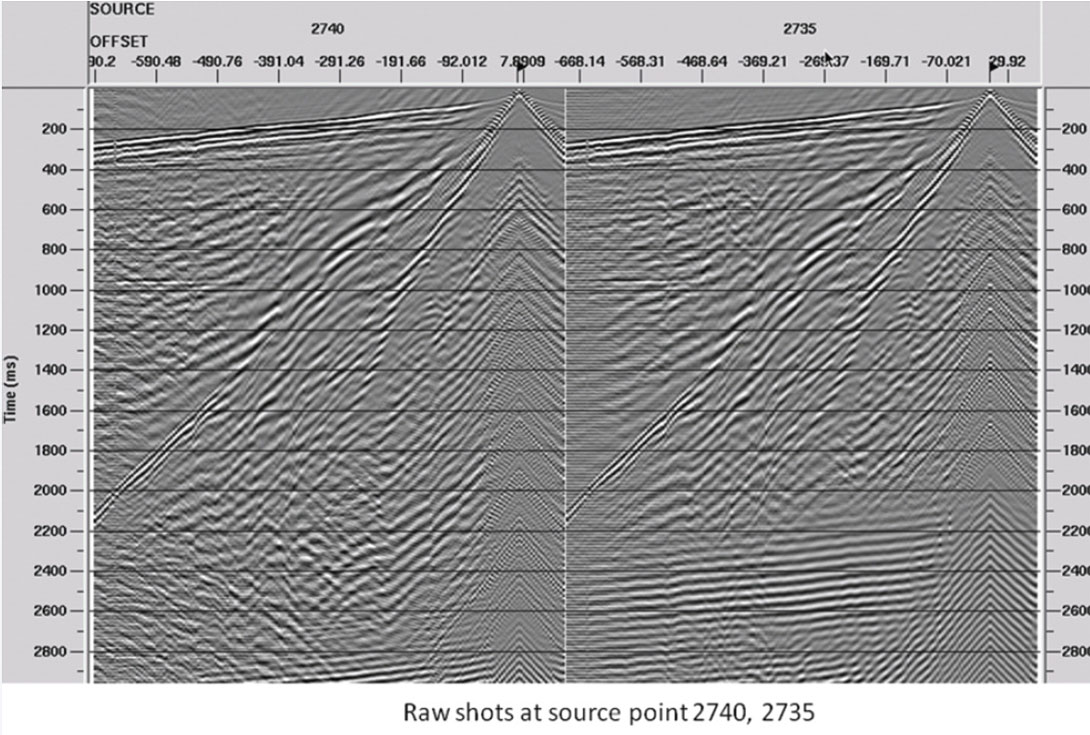
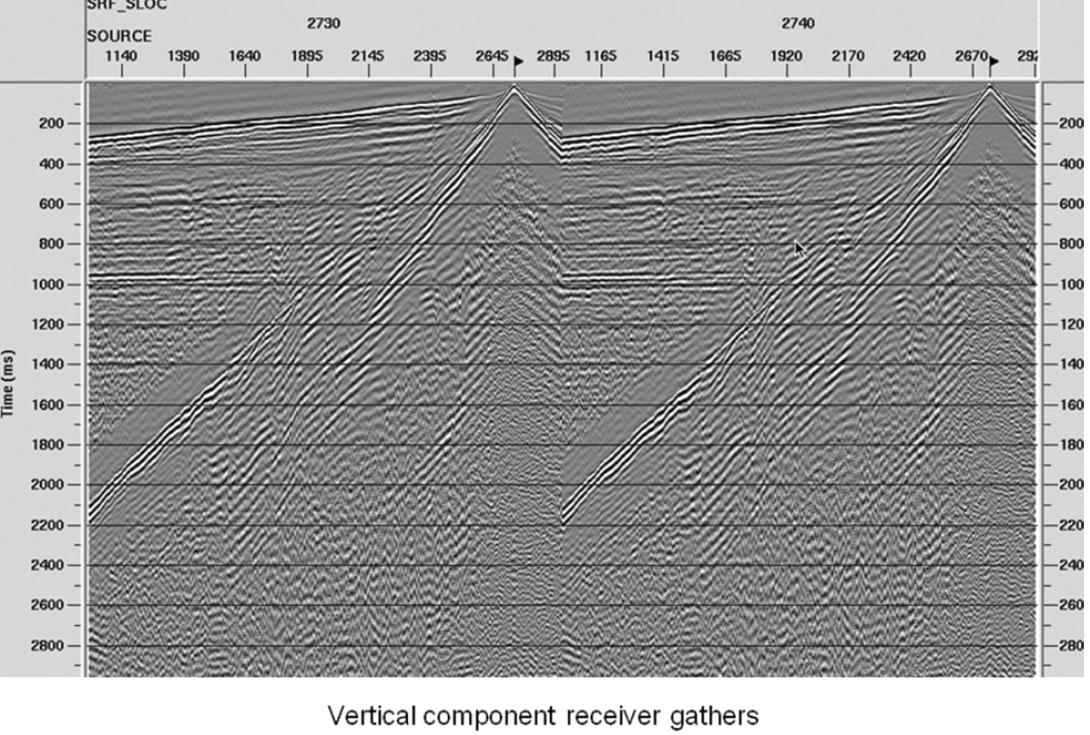
Figure 17 shows an example of two unfiltered raw shot gathers from the 2009 Priddis line. Though coherent noise is abundant, some reflections can be seen in the gap between the direct arrivals and the low velocity noise cone at the longer offsets. A close examination of the gather, however, reveals that at least some of the lower velocity noise is aliased. Figure 18 shows that the aliasing is reduced when the data are sorted to receiver gathers, with their smaller spatial sampling.
Processed gathers
Applying cascaded radial trace filters, as well as Gabor deconvolution, to the receiver gathers results in the filtered data shown in Figure 19. While some residual coherent noise can be seen on these gathers, the reflections are now quite clear and are further enhanced by the CDP stack. Furthermore, reflections can be seen as deep as two and a half seconds.
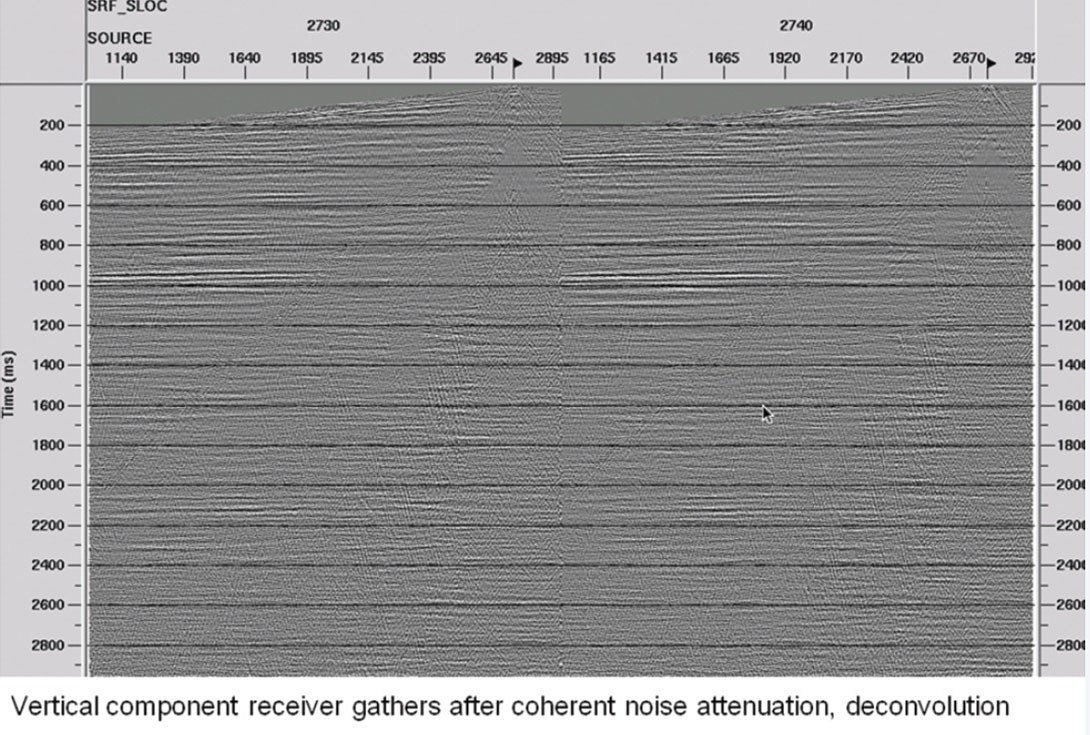
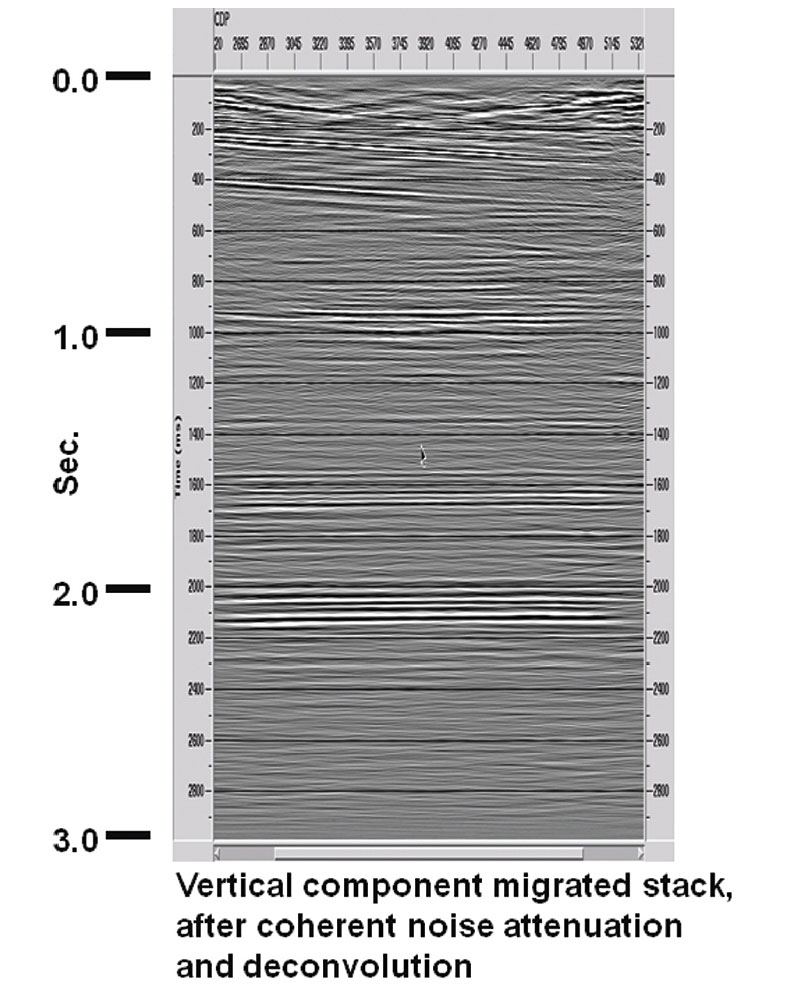
The CDP stack
Figure 20 shows the CDP stack of the vertical component receiver gathers after noise attenuation and deconvolution. It is interesting to note the many clean reflections on this section, and to see that we are able to image these data down to nearly two and a half seconds with remarkable lateral resolution and vertical bandwidth. The section displayed is shown in an aspect ratio that is nearly 1:1, so geological structure is accurately portrayed.
Summary
In addition to confirmation of findings from our earlier surveys, the 2009 Priddis experiment showed us that:
- Small source spacing can be substituted for small receiver spacing to improve spatial sampling of the surface wavefield, as long as both source and receiver coupling are good. Noise attenuation can then be performed on receiver gathers with their finer spatial sampling. Under proper conditions, spatial sampling for noise removal needs to be deployed in either the source or receiver domains, not necessarily both.
- A secondary benefit of decreased source spacing can be increased source effort. Perhaps the most valuable lesson learned from the 2009 experiment was that when field conditions or equipment limitations dictate changes in the layout parameters for a survey, other parameters can often be adjusted to compensate and provide an acceptable or even superior result.
In this survey, if there had been 800 3C phones and 2400 channels of recording capability available, we would likely have planted phones every 1 m and spaced source points at 4 m or more. Considering the difficulty of planting geophones in frozen ground, the layout effort would likely have taken a week, and pickup as much as 2 days. Acquisition would have taken a day. Because we had only 200 phones, layout actually took 1 ½ days, pickup ½ day, and acquisition about 1 ½ days. So, for a relatively small increase in acquisition time, we acquired a survey which exceeded our expectations. A survey with 1 m phone spacing might have shown slightly increased lateral resolution, but may not have imaged some of the deeper reflectors, due to the reduced source effort.
So are those cattle dead, yet? Some conclusions
We have presented evidence from three experimental seismic surveys that we hope will at least frighten a seismic sacred cow or two. In our first experiment, we showed that while geophone arrays do undoubtedly attenuate some coherent noise, we can almost always do better by recording single phones and processing the output. At the very least, we can simulate geophone arrays in the computer, and at best, we can accurately model and subtract large amounts of noise by using the visible characteristics of the noise. As soon as improved seismic field equipment (more channels, less cumbersome station connections) makes single phone recording more attractive logistically, we can safely declare this sacred cow dead.
Once we begin routinely recording single phone surveys, the anti-aliasing requirement for sampling noise will make the antialiasing criterion for imaging structure irrelevant; so that particular sacred cow will simply die of old age.
Single-phone acquisition methods force us to focus more on prestack processing, particularly on coherent noise attenuation, since the whole method is based on the premise of measuring the noise accurately in order to estimate it and subtract it. Conventional processing tools, like f-k filtering, may be inadequate for removing the amount of noise seen on high-resolution records, so we must be willing to experiment with new processing tools directed explicitly at this task.

Acknowledgements
The authors wish to acknowledge the continuing support of CREWES sponsors, and to acknowledge the assistance of CREWES staff and students with the field work described above. We would also like to thank Landmark Graphics (Halliburton) for the use of ProMAX.
Related Reading


Join the Conversation
Interested in starting, or contributing to a conversation about an article or issue of the RECORDER? Join our CSEG LinkedIn Group.
Share This Article