Summary
An array of geophones on the surface above the reservoir was used to map hydraulic fractures by locating microseismic events in order to estimate the effectiveness of the stimulation. In general, hydraulic fracture orientations can be inferred from the geometry of the events when microseismicity forms linear or planar trends along a particular azimuth. In reservoirs where the induced microseismic events have a low signal-to-noise ratio (either due to low magnitude events or propagation effects) individual event locations can have a high degree of uncertainty. In comparison, microseismicity mapped in reservoirs with high signalto- noise quality can generate many more detectable events under similar treatment pressures and rates, with linear and planar event trend geometries also much more common. Because low signal-to-noise ratio events are not as accurately located in the reservoir, or may not be detected at all, the extent of induced fracturing in the reservoir may be underestimated. In the Bakken Formation of the Williston Basin, USA, we combine geological analysis with process-based and stochastic discrete fracture network (DFN) modeling to build multiple fracture realizations to be validated via history matching iterations. Validated DFN models are used to calculate a geometrically-constrained volume of rock matrix with fracture permeability from which estimated ultimate recovery (EUR) can be calculated. This paper presents a methodology for modeling induced fracture permeability and estimated production in the Bakken Formation based on calibrated stimulated reservoir modeling that can be applied to other reservoirs with low signal-to-noise microseismicity.
Introduction
The Middle Bakken oil reservoir presents a challenge for microseismic mapping. The low magnitudes of the induced microseismicity may be explained by the apparent low regional stress anisotropy in the Williston Basin and the average thickness of less than 100 feet in many productive fields. In addition, the depth of the reservoir combined with large vertical velocity/density variations within the basin fill contribute to the acoustic challenge. Small magnitude events at depth result in low signal-to-noise ratios for microseismicity generated during hydraulic fracture stimulations monitored at the surface.
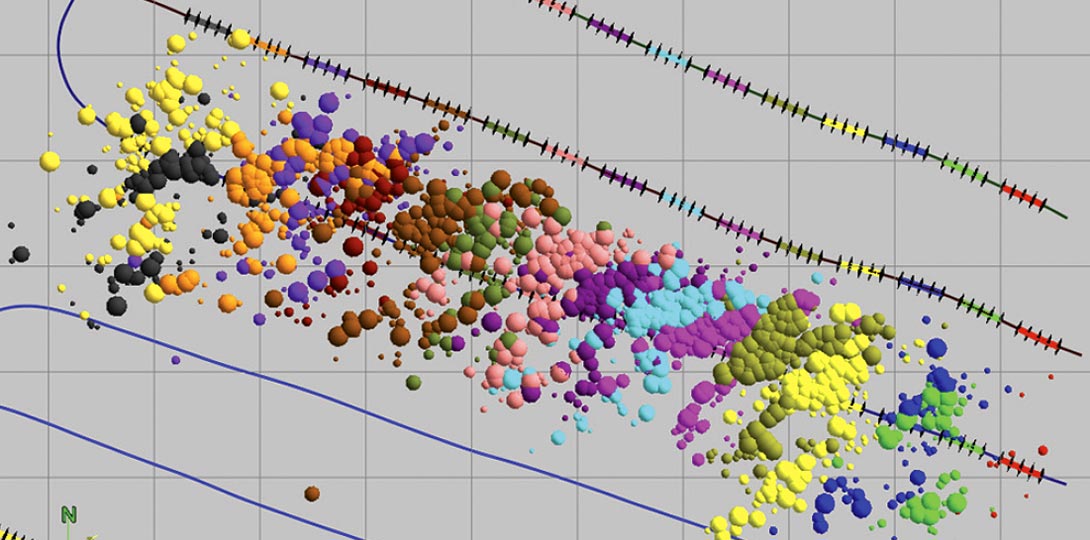
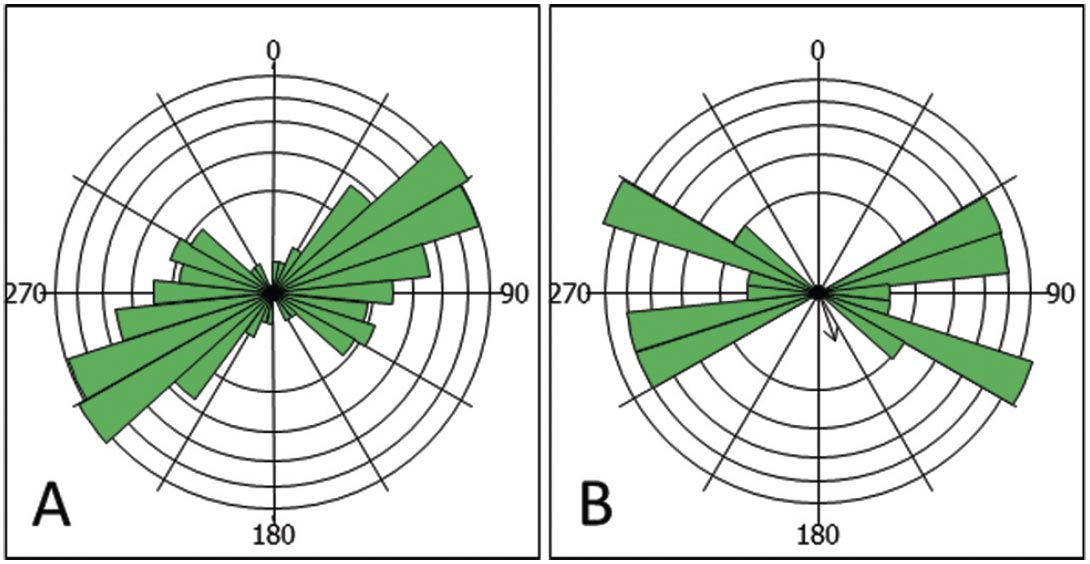
The Bakken formation is naturally fractured, so it is likely that the hydraulic fracture treatment is dominated by reactivation of existing fractures, rather than creation of new fractures. Stimulation of existing fracture networks is well documented in the literature in the Barnett Shale (Gale, 2007and Cipolla et al., 2008). In another example, microseismic monitoring results acquired from the Marcellus Shale, in eastern USA, have significantly stronger signal to noise ratio, and microseismicity trends along both of the established fracture sets in the Appalachian Basin are apparent in the microseismic results (Figure 1).
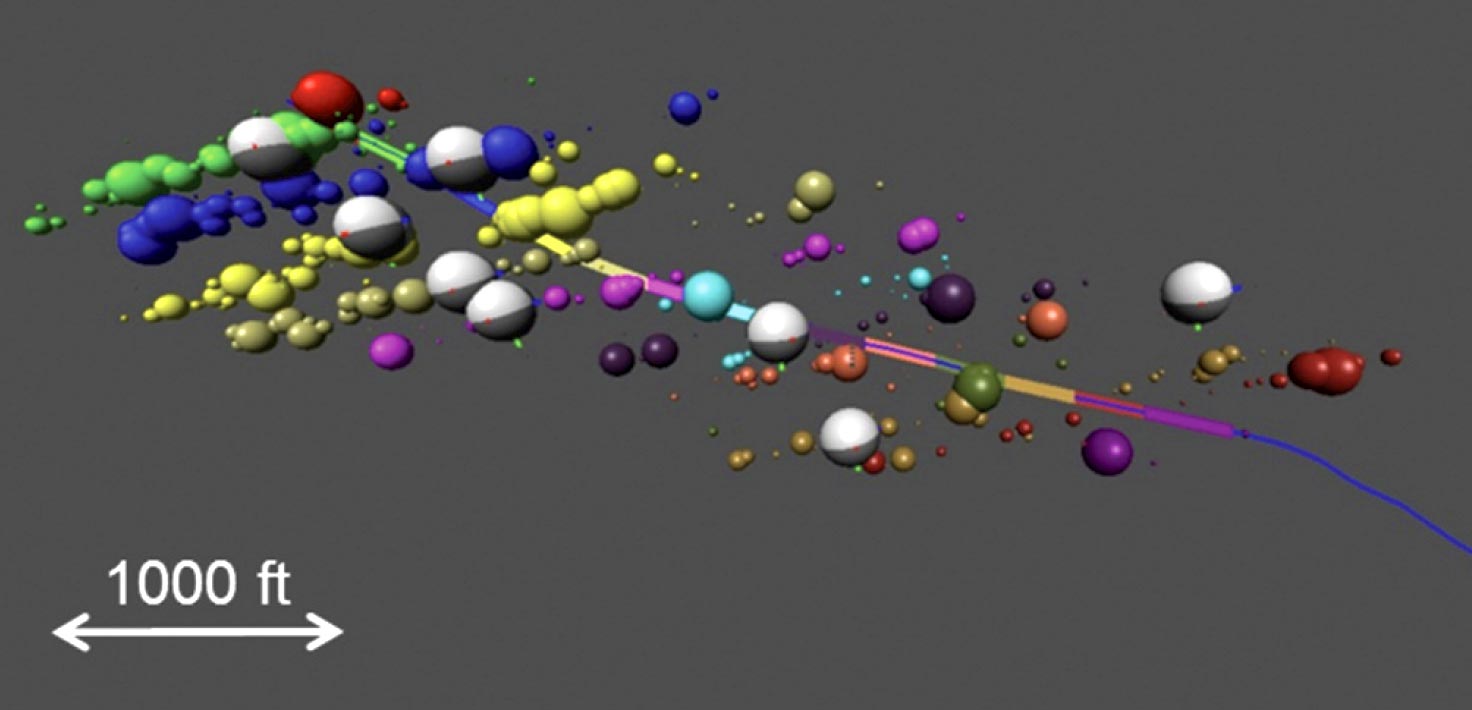
Source mechanism analysis of hydraulic fracturing in reservoirs with strong microseismic energy shows fracturing behavior that confirms complex failure behavior along existing fracture networks in response to the pressure changes induced by the stimulation (Eisner et al., 2010 and Wessels et al., 2011). Existing fractures can dominate the induced failure behavior, so that the event pattern shows the reactivation of those features rather than hydraulic fracturing of intact rock. Figure 2 shows a result from stimulation of a gas shale in the USA where the microseismic event trends follow existing fractures. The oblique dip slip failure mechanism (indicated by the beach balls at some event locations) supports information from other data sources indicating the trends are not parallel to the maximum horizontal stress direction (Williams-Stroud et al., 2011).
When complex natural fracture networks are stimulated by the hydraulic fracturing treatment, the resulting diffuse clouds of events do not provide enough information to infer fracture directions. The lack of strong directional trend patterns in the microseismicity may also be due to low stress anisotropy in the Williston Basin allowing stimulation of a wider range of fracture orientations than in basins where the differential stress is much higher (Olson and Dahi-Taleghani, 2010), or simply a function of the complexity of the existing natural fractures in the reservoir (Dunphy and Campagna, 2011). We use fracture information from wellbore data and the geologic setting of the Bakken well example presented here to develop models for fracture orientation and length.
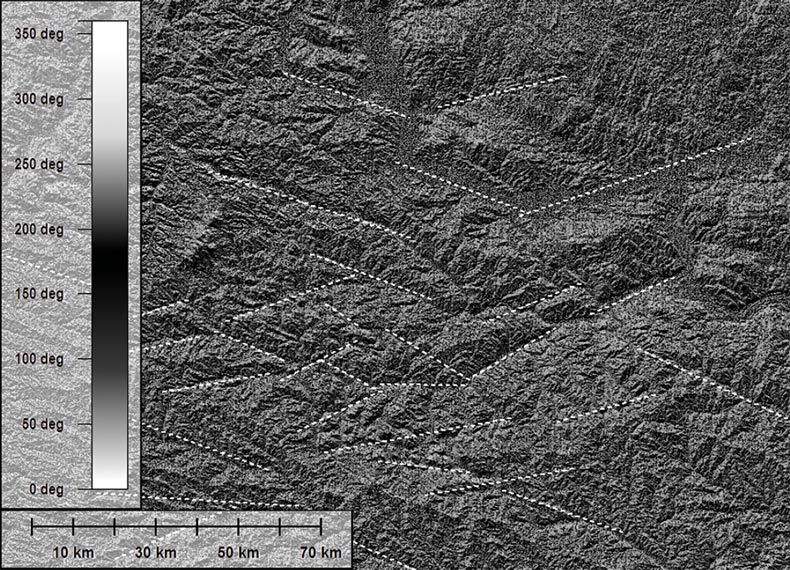
The relatively flat, gently dipping sedimentary bedding in the Williston Basin belies its structural complexity. Basement faulting in the basin has been reactivated by tectonic activity subsequent to deposition of the oil-rich sedimentary sequence. A number of workers have used lineament analysis in the Williston Basin to identify structural trends that delineate structures and producing zones in the region (Thomas, 1974and Gerhard et al., 1982). Figure 3 shows shaded-relief elevation in the area of the treatment well with two primary orientations of linear trends. Although measurements of maximum horizontal stress are often associated with a significant measurement error, some data sources indicate a NE azimuth (Heidbach et al., 2008).
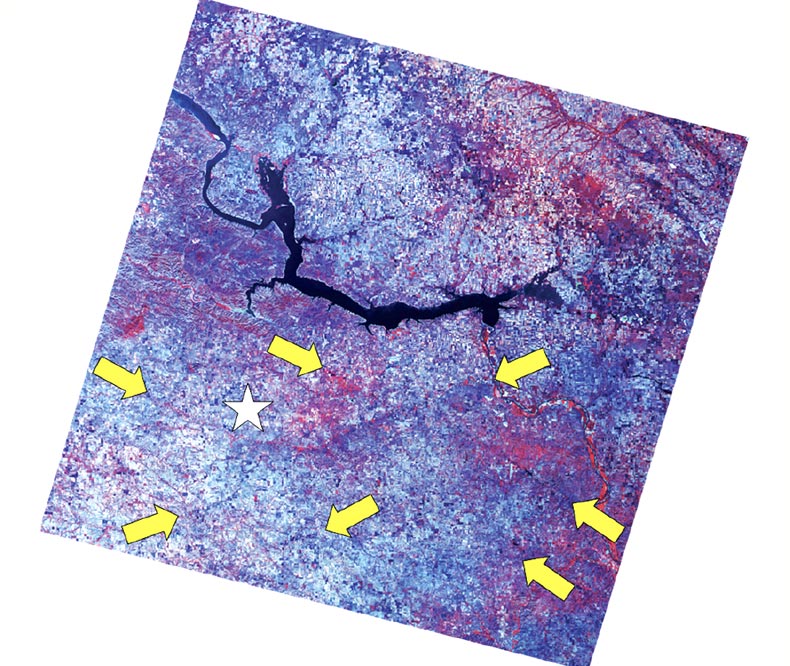
Lineaments visible in LandSat images show the same primary orientations, but on a much larger scale (Figure 4). Faulting in the basin is steeply dipping to vertical, and major structures are present on the surface that indicate left-lateral displacement upon reactivation. An example is the prominent E-NE oriented feature named the Brockton-Froid fault zone in the eastern Montana part of the Williston Basin that shows left lateral strikeslip displacement of surficial geology features, indicating the ENE lineaments are most recently active as strike slip faults. Strike slip displacement on lineaments of this orientation is consistent with maximum horizontal stress with NE azimuth. This interpretation is supported by the orientation of conductive natural fractures identified in image logs from a nearby well (Figure 5), where conductive fractures are considered to be critically stressed by having an orientation within the current stress field that is likely to slip.
Microseismic Monitoring Methodology
Microseismic data was collected during the stimulation treatment of a well in the Bakken Formation in west-central North Dakota using a surface-based monitoring method. An array of geophones was laid out in a radial pattern around the treatment well, and consisted of 1336 stations of 24 geophones. Eight stages were treated in the well using a sliding sleeve completion method, with a total of 18 hours of data recorded. Microseismic events induced by the hydraulic fracturing were located by a beamforming process, which is essentially a one-way depth migration. A layered velocity model was calibrated using a string shot as the calibration source.
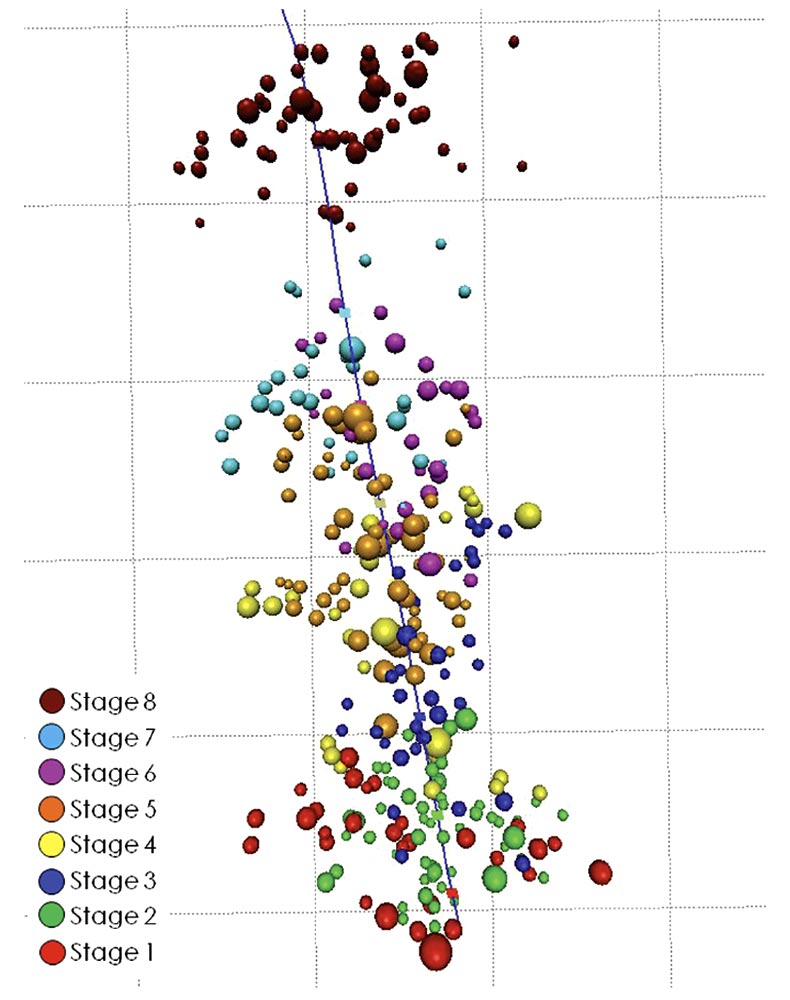
More than 300 microseismic events were identified and located with their relative energy. Figure 6 shows the result of the final processed events from the study well. Events are colored by stage and sized by relative energy. In several stages a somewhat diffuse trend can be seen parallel to a N-NE azimuth. Stage 1 also shows a S-SE azimuth trend of events.
Six events with enough energy that they were visible in the raw seismic traces were recorded during the stimulation treatment, but the majority of events were located from their stacked amplitudes.
Fracture Modeling
The fracture and lineament orientations from the image logs, mapping and satellite images were used to constrain the fracture orientations in the DFN. The NE-striking fractures were treated as the dominant orientation because NW striking fractures in a stress field with maximum horizontal stress NE azimuth may be less likely to be activated by the fracture stimulation (Zoback, 2007). However, with low stress anisotropy, they may make important contributions to the overall permeability. Multiple DFNs realizations were generated to test the validity of including additional fracture sets in the fracture flow property model. Two of the DFN models were validated via history matching; a model with one fracture set representing the orientation of the critically stress fractures, and a second model with two fracture sets that includes a NW striking fracture set in addition to the NE striking critically stress fracture set.
A geocellular model was populated with the events, using their locations and relative energy as a fracture probability within the model. In cases such as these where the event energy is very low, we use a probabilistic approach to generating the fractures. Using an average strike of 59 degrees, multiple realizations of fractures are generated with different length distributions and orientation distributions. The values of stacked amplitudes of the events are used directly as the P32 (fracture area per volume) fracture intensity parameter.
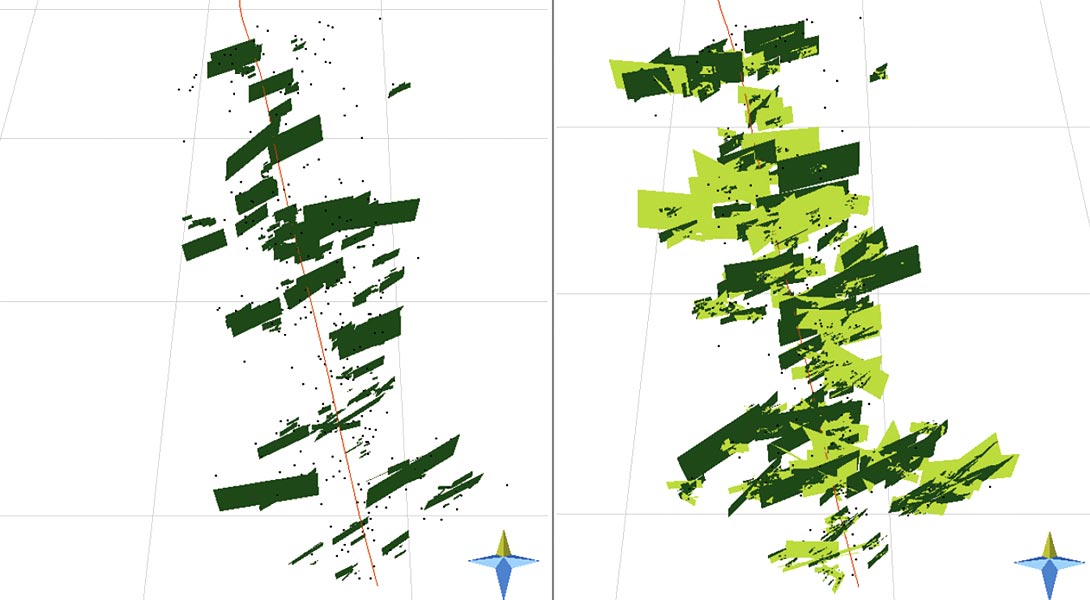
The DFNs generated from the amplitude-populated geocellular volume is shown in Figure 7. The locations of higher signal-tonoise events that served as a fracture probability constraint in the input parameter are locations of high fracture intensity in the resulting fracture model.
The flow properties generated from the fracture models are calculated from the total area of fractures within each cell of the geocellular grid. Fracture aperture is assigned by using a relationship to the fracture length, and the permeability tensor is calculated using a weighted average of these three properties. If a generated fracture extends beyond the boundaries of a cell, it is clipped to the cell boundaries so that only the area portion of the fracture contained within the cell is used to calculate the fracture porosity volume.
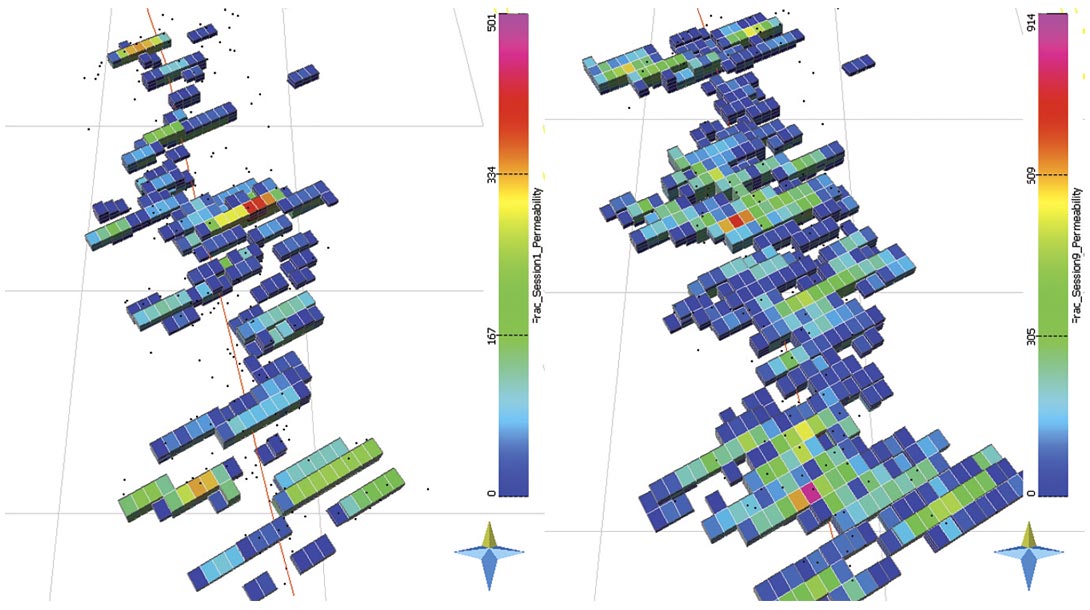
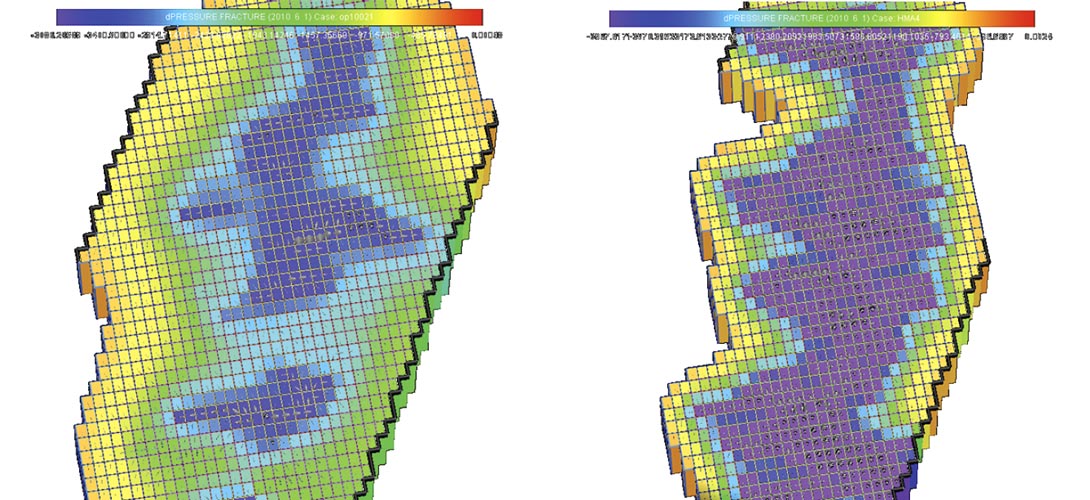
The total volume of stimulated reservoir is dependent on the fracture model used to calculate the fracture flow properties. Figure 8 shows the geocellular volumes with enhanced fracture permeability calculated from the two historymatched DFN models. Only the volume of reservoir that may have enhanced fracture permeability is shown, with all cells containing no additional fracture flow properties turned off in the display. The permeability volume calculated from the DFN with one fracture set has a smaller volume but much higher permeability anisotropy than the volume calculated from the DFN with two fracture sets.
Numerical Simulation
The reservoir property model was based on the available data from the stimulated well and on data and information from nearby wells, including mud logs, porosity and permeability, capillary pressure measured from core, gas chromatography, and electric logs. The future production simulation model used injection pressures and volumes, hydrocarbon and water volumes, and tubing head pressure from production operation of the modeled well. The rock matrix properties were assigned to the 4 cell layered model to represent from bottom to top, the Lower Bakken Shale, the Lower Middle Bakken Dolomite Reservoir, the Upper Middle Bakken Dolomite Reservoir and the Upper Bakken Shale. The bounding shales were assigned an effective porosity of 1%, and the Bakken Dolomite Reservoir was assigned a uniform matrix porosity of 6.5% and 0.010 md permeability. The fracture flow properties calculated from the DFN were assigned to the model as a second set of permeability and porosity values to create a dual porosity simulation model.
The dual porosity reservoir simulation model was calibrated to the dynamic production data by sensitizing to a parameter set of selected unknowns. The initial flow-back of the hydraulic fracture fluid was not modeled, and therefore was not matched. The two models were calibrated to the same dynamic data and the history match results were similar, but the estimates of future recovery were significantly different. The results of the dynamic calibration process for the two DFN models are shown in Figure 9. The output properties for the two-fracture set DFN produced a somewhat higher average permeability (105 Darcys) and a larger stimulated reservoir volume, and reached a history match with a lower natural fracture (background) permeability. The simulation results from the one-fracture set DFN, with average fracture permeability of 61 Darcys, required a higher fracture permeability to achieve a history match.
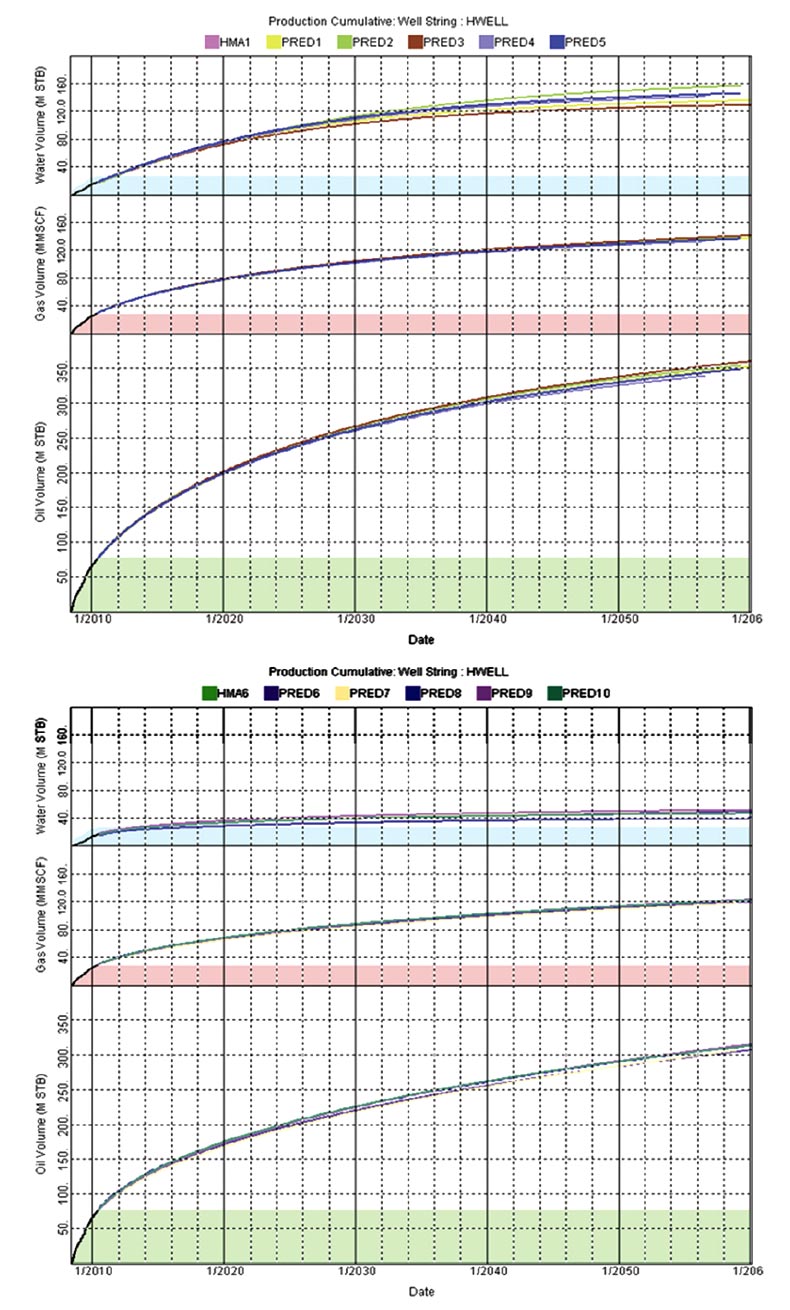
The estimates for future recovery for the two DFN models showed significant differences even though their historical performance was similar and they were calibrated to the same dynamic data. The one fracture set DFN predicts a 16% higher oil recovery but also has a much higher water production (Figure 10).
Conclusions
Advances in acquisition and processing of surface monitored microseismic data since this data was originally acquired confirm orientations of fractures reactivated by stimulation treatments in the Bakken. Source mechanisms obtained from larger events show oblique dip-slip is common on NE striking fracture planes. The strikes of source mechanism failure planes from microseismic data acquired approximately 160 km to the north of the study well are very similar, indicating that the general trends for fractures are similar across significant distances.
We have presented in this paper a methodology for generating fracture models from microseismic events in reservoirs that generate low seismic energy during the stimulation treatment resulting on low signal-to-noise events. The location and size uncertainty are quantified by generating multiple realizations based on geological parameters that are known about the reservoir such as fracture orientation from image logs, or structural trends.
The fracture models can then be validated via history matching, so that more accurate estimates of the total volume of stimulated reservoir can be calculated in order to determine reserves and guide infill drilling programs.

Acknowledgements
The authors wish to thank our colleagues at MicroSeismic, Inc. for their helpful and critical reviews of this paper, and William Barker for geophysical support in the microseismic data processing and interpretation of the monitoring results. We also wish to thank Tracker Resource Development LLC for release of this dataset for publication.
Related Reading


Join the Conversation
Interested in starting, or contributing to a conversation about an article or issue of the RECORDER? Join our CSEG LinkedIn Group.
Share This Article