Summary
In this work we describe a reprocessing technique to relocate microseismic events based on the double-difference method. First, we use a crosscorrelation technique to assess waveform similarity between events and identify multiplet groups. Then, we correct relative arrival time inconsistencies between doublets. Next we apply the double-difference algorithm, which is a relative location method that tries to minimize the residuals between observed and calculated travel-time differences for pairs of microseismic events at each station, by iteratively adjusting the differences between all pairs of events in each multiplet group. For this study, we use a data set from a microseismic system installed near a mine, and relocate the microseismic events detected. Results are shown for a cluster of microseismic events, where it collapses the diffuse locations into a sharper image of seismicity, which is most likely related to shaft activities. We also show plots that reveal uncertainties in time picks and location for quality control purposes. A higher accuracy in the locations can provide a better detection of zones of ground instabilities; prevent activation processes and potential rock bursts that can severely impact the safety and productivity of the mine.
Introduction
Over the past years, microseismic monitoring has gained importance as a geophysical method to understand underground industrial processes. Among the main applications we have: hydraulic fracturing, reservoir monitoring, carbon sequestration and mining operations. In these fields, imaging of microseismic events provides a plethora of information about the area under study, so accurate locations are crucial for interpretation purposes (Cipolla, Maxwell, Mack, & Downie, 2011). From Earthquake Seismology we have learned that event location accuracy is mainly affected by: a limited source-receiver configuration, errors in arrival time picks and in the velocity model used, which is usually a 1-D function and rarely represents exactly the true velocities of the Earth (Pavlis, 1992). To reduce location errors, we apply a reprocessing technique to reduce the effects of both time picking errors and unanticipated velocity models to a data set of microseismic events from the mining industry by combining (i) event similarity assessment, which uses crosscorrelation methods to detect groups of events originated in the same source region, i.e., multiplets, (ii) P-wave arrival time refinement between doublets and (iii) the double-difference method, which is intended to reduce the effect of unknown velocity heterogeneities along the source-receiver paths, especially when dealing with dense microseismic clusters (Waldhauser & W. Ellsworth, 2000).
Analysis using similar shaped events has several practical uses. We can take advantage of the multiplet similarity to obtain relative locations (Poupinet et al., 1984; Waldhauser and Ellsworth, 2000). It can be used as quality control since event pairs with high crosscorrelation coefficients and large separation distances suggest errors in the absolute locations (Kocon & van der Baan, 2012; Castellanos & van der Baan, 2012). It can help monitor reactivation of faults, fractures, flow obstacles during hydraulic fracturing (e.g., Rutledge et al., 2004; Arrowsmith & Eisner, 2006). It can also help detect velocity variations, dyke penetration in volcanoes and other underground magmatic activities (Got, Fréchet, & Klein, 1994).
First, we describe the theory of event similarity assessment, the time repicking method and the double-difference algorithm. Next we apply the reprocessing technique and discuss briefly the advantages and disadvantages of the method and how it can be used for quality control of event locations and time picking.
Theory
In the following we describe the rationales for the various methods applied. First we find absolute event locations for individual events using a grid search for possible hypocenters. Next we apply cross-correlation to detect doublets and multiplets (that is, events with highly similar waveforms). Finally we describe the double-difference location algorithm (Waldhauser & Ellsworth, 2000) to obtain highly accurate relative event locations.
Grid Search
The grid search algorithm is a popular method to invert for absolute event locations (Lomax, Michelini, & Curtis, 2008). Basically, it consists of generating a grid with nodes associated to possible hypocenters, separated by a spacing dx, dy, and dz, and a grid of origin times, spaced times dt. Then, theoretical travel times from each node to the receivers are calculated and compared with the actual observed arrival times. In other words, the forward model is solved using loops over possible origin times and source coordinates and a look-up table with these theoretical travel times for all possible hypocentral parameters is generated to prevent repeated computations. This procedure yields maximum likelihood estimates of the hypocentral parameters (the spatial coordinates and origin time). With receivers in a single vertical borehole this might not be the best location technique, since not only the distance but also the azimuth is needed to determine the locations accurately (Pearson, 1981; Phillips, Fairbanks, Rutledge, & Anderson, 1989; Fischer, Hainzl, Eisner, Shapiro, & Le Calvez, 2008) . For receivers distributed in several boreholes, a good azimuthal coverage is obtained, thus, hypocenters can be well resolved by minimizing the squared difference between observed minus predicted travel times divided by the time pick uncertainty.
Event similarity
Microseismic events can occur anywhere, as a result of a change in stress fields or induced due to human activity, but they tend to rupture on the same faults or hydraulic fractures. The events then will have similar locations and source mechanisms, producing seismograms with similar waveforms. For our work, we use multiplet analysis (Geller & Mueller, 1980; Poupinet, Ellsworth, & Frechet, 1984; Got et al., 1994; Arrowsmith & Eisner, 2006) and apply crosscorrelation to detect events that originate from the same source region. This allows defining zones of dense seismic clouds named multiplet groups.
In this technique, a doublet is defined as two microseismic events that are highly correlated. That is, their waveforms show high similarity and a multiplet as more than two highly correlated microseismic events. To determine waveform similarity, we compute a weighted average of the crosscorrelation coefficients across all three components between two microseismic events. The weighting is according to the maximum amplitude on each component. This amounts to assuming that the maximum amplitude reflects the signal-to-noise ratio in each trace. Next the peak correlation coefficients at all lags are extracted and averaged over all receivers to obtain the final crosscorrelation value. For more detail on this procedure, we refer to Arrowsmith & Eisner (2006).
After calculating the averaged peak crosscorrelation coefficient for all event pairs, we generate an NxNupper triangular matrix containing the crosscorrelation coefficients, where N is the number of events. Once this is done, we must choose a threshold or minimum crosscorrelation level to define if two events are considered highly correlated. This can be done in two ways. We can enforce that each event in a multiplet group is correlated to all other events in that group by a minimum correlation coefficient (De Meersman, Kendall, & van der Baan, 2009). Another approach is to allow events to be correlated in a chain-like fashion, so they can belong to the same multiplet group even if there is limited mutual similarity among all event pairs (Arrowsmith & Eisner, 2006). For this work, we selected the latter for its more natural definition than the requirement of all events being correlated with each other.
The definition of a multiplet is subjective and can depend on the noise level and its application but it is a reasonable approach to detect events that come from the same source region.
Repicking Method
Errors when picking phase arrivals can affect the absolute locations (Pavlis, 1992). Therefore, we take advantage of waveform similarity between doublets to improve relative arrival time readings through a crosscorrelation procedure. If two microseismic events are highly similar, their corresponding time picks should be at the same position. This P-wave pick refinement consists of extracting two time windows that encompass both Pwave phases and perform crosscorrelation. Then, the time lag corresponding to the maximum peak of the crosscorrelation function represents the shift that needs to be corrected to remove any inconsistency in the picks. This is done in all three components and weighted by each crosscorrelation value. This can also be used to repick S-waves independently.
Double-Difference Method
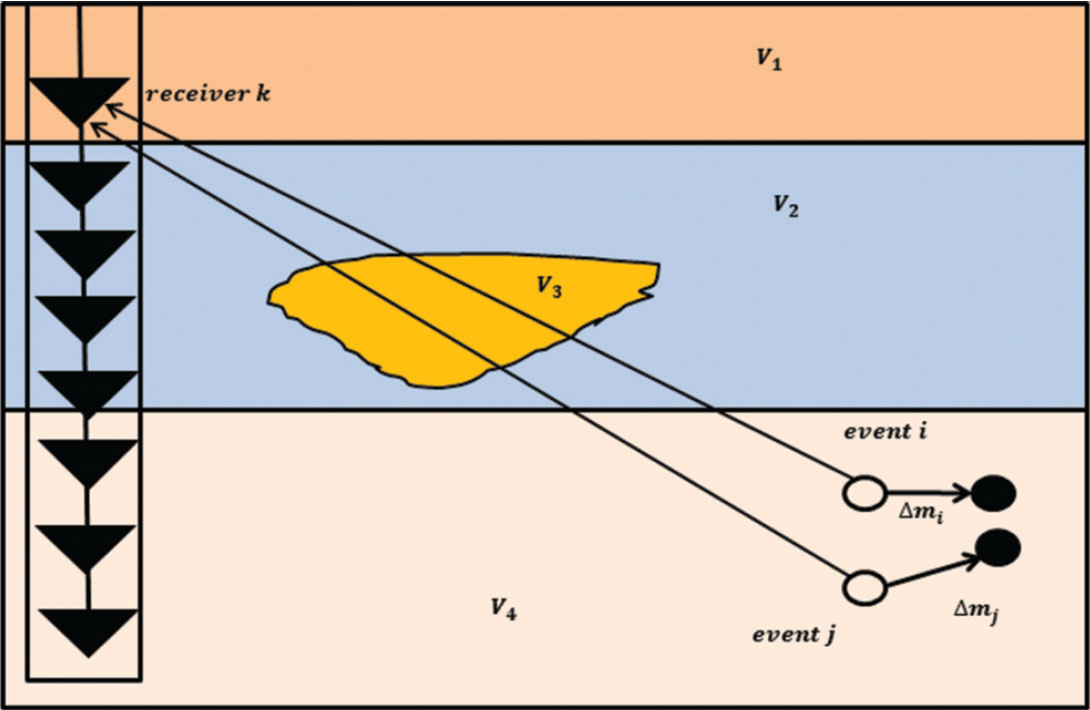
The double-difference method (DD) is a relative location method developed for Earthquake Seismology (Waldhauser & Ellsworth, 2000) and it has much promise in microseismic data analysis. As any relative location method, we expect it to work better with dense clustering of events, hence our emphasis on detecting multiplets. The main assumption in the DD method is that ray paths between two events will be very similar if their hypocentral separation is small compared to the source-receiver distances; therefore, the relative travel-time difference at a common station will be due to the spatial offset between both events (Figure 1). In other words, the effects of most velocity heterogeneities will cancel out, such that only knowledge of the velocities in the source region is required. The double-difference residuals for pairs of events at each station are minimized, with the locations and partial derivatives being updated after each iteration, solving the relative hypocentral parameters for each event.
Since the relationship between the travel times and the location of an event is not linear, a truncated Taylor expansion is applied to linearize it. Thus, the travel time residuals for all event pairs are linearly related to perturbations of their hypocentral parameters. Finally, this system of equations is formed:

Where G is the partial derivative matrix of size M×4N evaluated at the current location of each event, M is the number of doubledifference observations, N is the number of microseismic events; Δd is the residual data vector of double-difference travel times for all event pairs; Δm is a vector of length 4N containing the changes in the hypocentral parameters that we wish to determine, namely (Δx, Δy, Δz, Δt0), and W is a diagonal matrix containing quality weights.
The weighting scheme design is another major step in any inversion process, especially when relocating correlated and uncorrelated events simultaneously, since it controls which observations will impact more the final locations. The correlation value is an appropriate measure of event similarity between events situated close together; therefore, waveform similarity represents an appropriate variable of weight (Geller & Mueller, 1980; Poupinet et al., 1984; Got et al., 1994). However, for events located farther apart, the correlation coefficient is less indicative of event separation due to wavefield scattering and variations in source mechanisms. As a result, it is necessary to include a weight based on inter-event distance. Additionally, we can also reject/downweight observations with large residuals caused by data outliers. We use for distance weighting:

where Wdist is defined as the weighting based on separation distance between event pairs. si is the separation distance for the ith event pair corresponding to the current observation, dmax is the maximum inter-event separation to be included, and a and b are exponents that shape the weighting curve (Waldhauser & Ellsworth, 2000). This weight is applied despite that the crosscorrelation coefficient is already a measure of similarity between events (Menke, 1999). Finally for correlation-based weighting:

where WCC is defined as the weighting based on event similarity, CCi is the crosscorrelation coefficient for the ith event pair, a and d are the scaling factor and exponential value that control the shape of the weighting curve to emphasize correlated over uncorrelated event pairs.
Since this an inversion problem, we need an initial solution minitial, which is represented by the absolute locations and weights of the events. Then the process is as follows: with the initial solutions of the events and weights for each event pair, the partial derivative matrix G as well as the theoretical travel time differences are calculated. The observed travel time differences can be obtained through cross-correlation or by measured arrival times. Then the system of linear equations is solved, the vector Dmis computed and the solution is updated mcurrent = minitial + Δm . These steps are repeated in an iterative way until some stopping condition is met such as the number of iterations, a minimum threshold in the residual vector or if the change in the solution between successive iterations is below a specific number. To assure numerical stability in the solution, we scale G by normalizing the L2-norm of each column of G. After vector Δm is obtained, the scaling factor is removed.
A disadvantage of the method is that a considerable number of events recorded at several common receivers can produce a significant system of observations whose solution is slow and computationally inefficient. For example, a dataset containing 1000 microseismic events recorded at a conventional single borehole with 10 receiver stations would result in almost five million double- difference observations. To avoid that, we also include the following parameters to restrict the number of observations in the system: maximum number of neighbors per event, minimum number of links between event pairs, minimum correlation level between neighbors, maximum separation between uncorrelated events and number of double-difference iterations.
Results
A microseismic monitoring system was installed at a mine to continuously detect zones of potential hazards and instabilities. Data received by 28 three-component geophones are used to investigate microseismic events recorded in seven boreholes. A total of 24821 triggered files are recorded during one month. The vast majority of these files contain no useful events but solely noise, possibly due to a very sensitive detection threshold in the equipment installed.
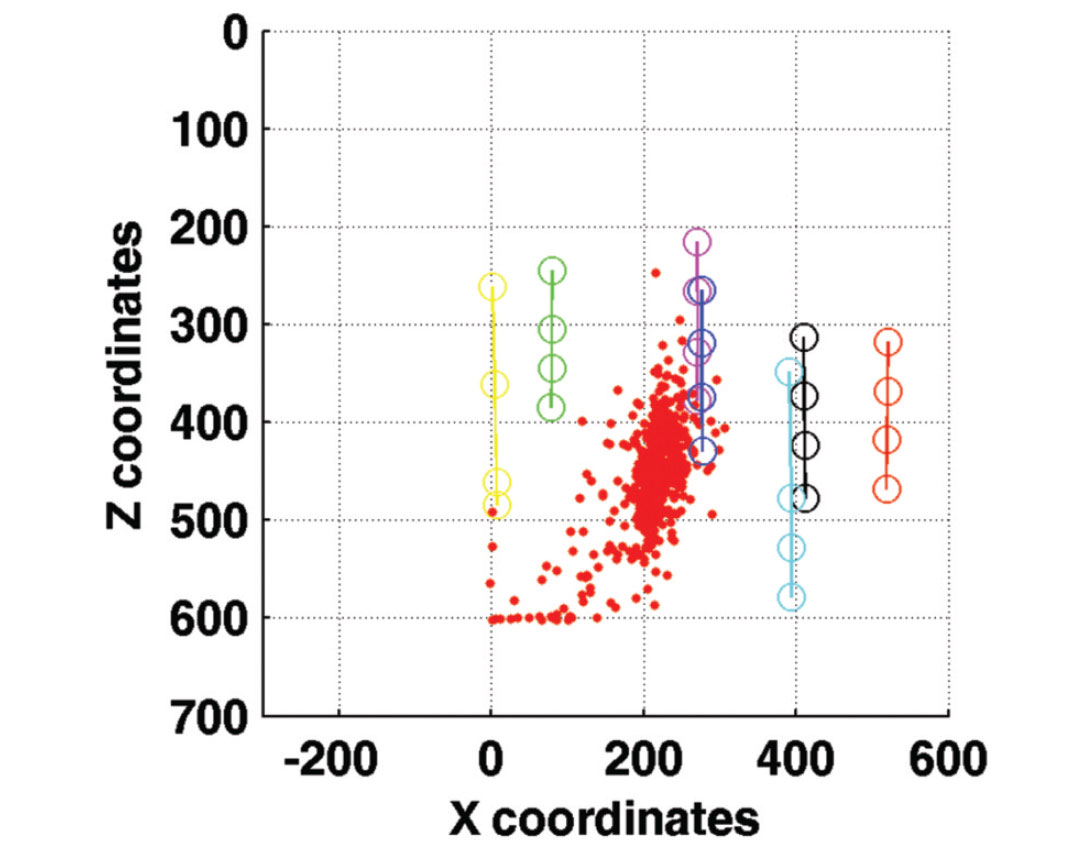
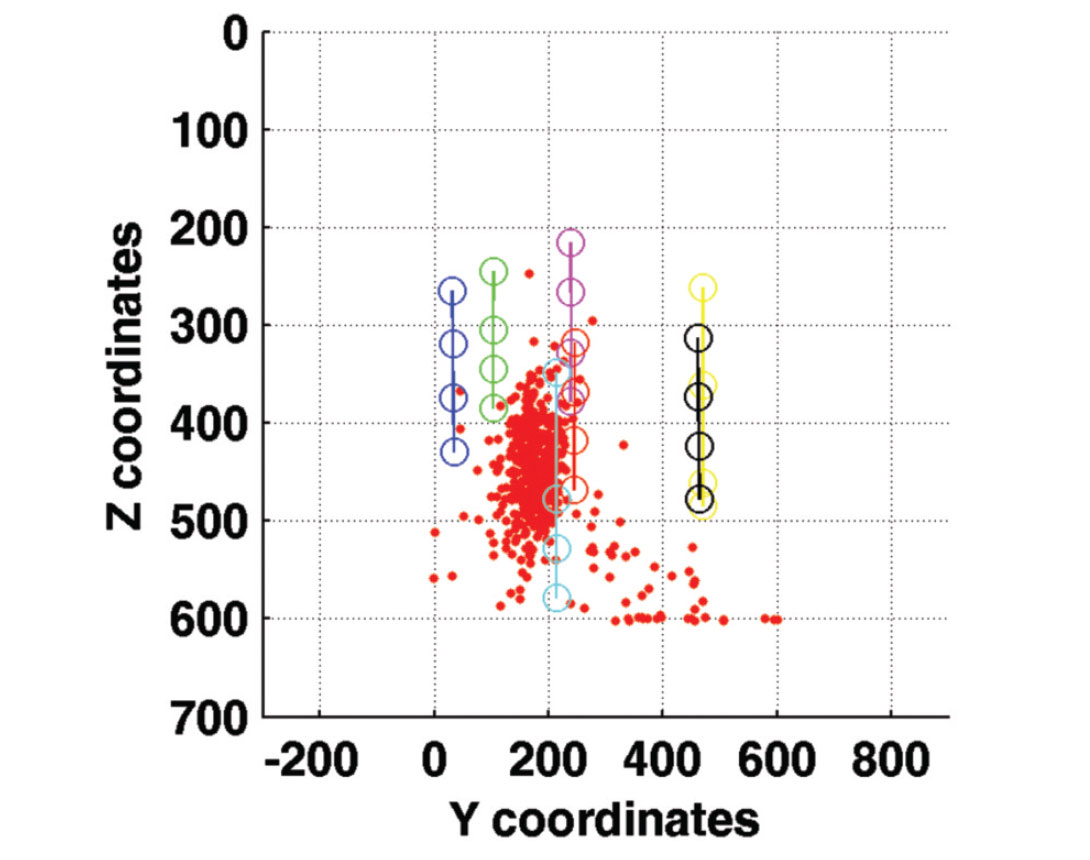
We first applied a standard processing workflow to obtain absolute event locations. The data is filtered 65-80-170-180 Hz and also a notch filter is applied to remove high peak amplitudes at 60 Hz and overtones. With regards to the event detection, we decided to use short and long time window of 30 and 300 ms, respectively as well as a threshold of 3 as suggested by Akram & Eaton (2012). P-wave arrivals are picked using a joint AR modeling and the application of the Akaike Information Criterion (Sleeman & van Eck, 1999), and then repicked manually if necessary. A calibrated 1-D velocity model was provided. However; the abrupt velocity changes possibly due to the dense presence of shafts and crosscuts near the mine produce significant scattering in the seismic ray paths, causing the events to be mislocated. As a result, we averaged the provided velocity model and a homogeneous velocity model of 3700 m/s is used for both the absolute and subsequent relative event locations. The effect of the velocity model on the final relative event locations is assessed but judged to be minor as the double-difference algorithm corrects for biases due to differences in source-receiver ray paths. Next, the grid search algorithm is performed where 488 microseismic events are located (Figure 2), revealing a large number of events especially between depths of 400 and 500 m. Finally, a more advanced relocation flow is applied using a combined multiplet and double-difference analysis.

Event similarity
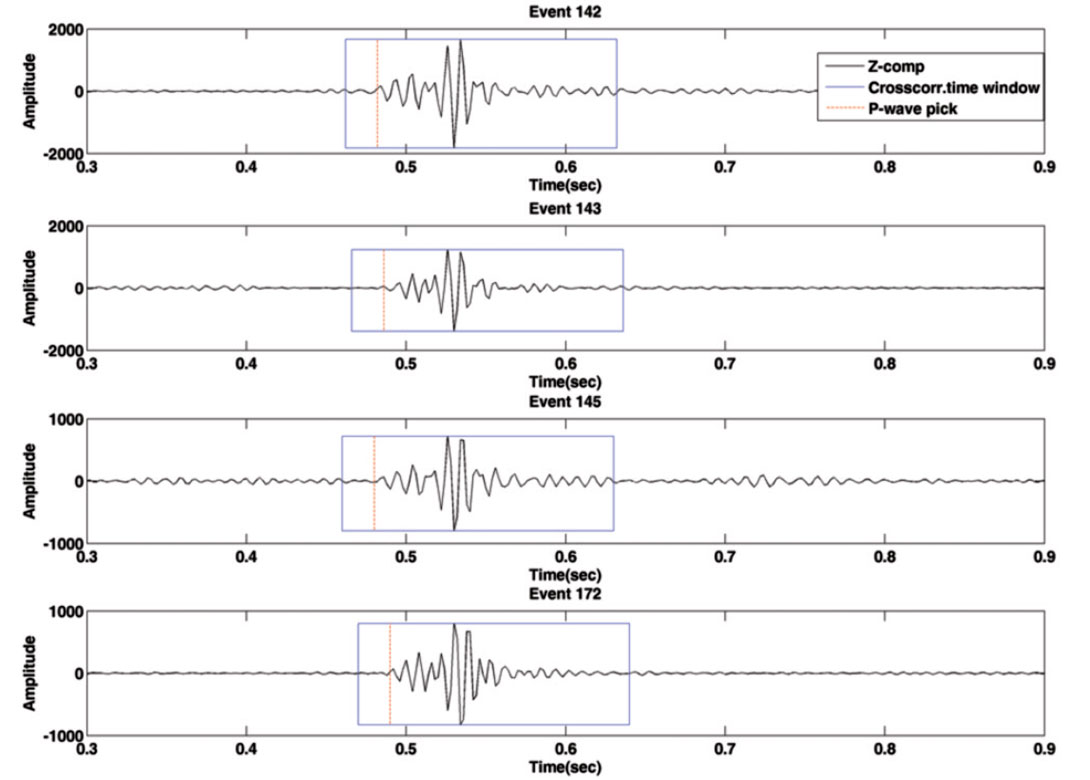
Similar microseismic events are detected through crosscorrelation based on the technique suggested by Arrowsmith and Eisner (2006). Figure 3 shows four similar microseismic events recorded at a common station. A 170 ms correlation window encompasses both P- and S-wave arrivals. A short length may ignore part of the useful information, whereas a longer length includes multiple scattered late-arriving energy, which is not useful for this similarity assessment. A minimum correlation level of 0.8 was established, which is sufficiently high to meet the assumption of this relocation method and is not too strict such that many useful events are discarded.
Next the correlation values are stored in an upper triangular matrix; similar events are gathered into multiplet groups as events are linked in a chain-like fashion.
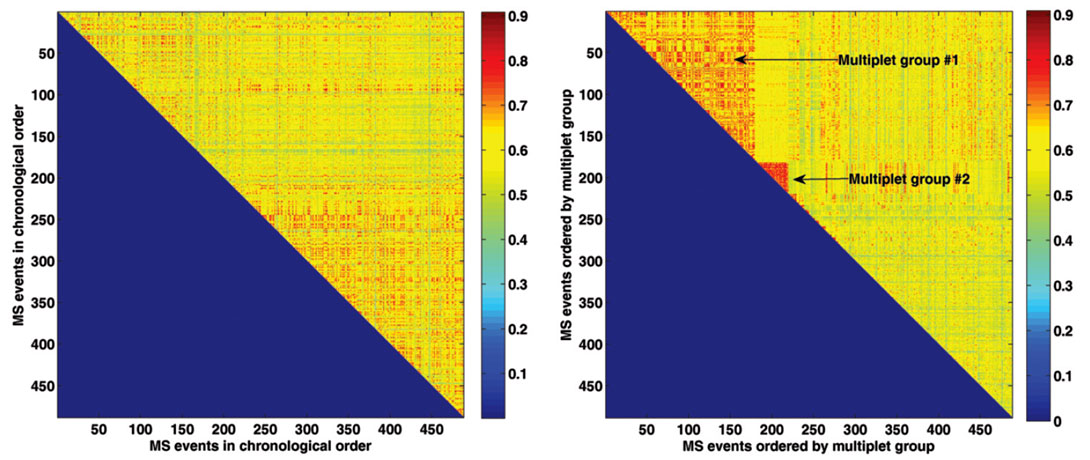
Figure 4 shows the upper triangular correlation matrix for 488 detected events, which allows for a quick assessment of the similarity between all event pairs. Note that in left part of Figure 4 there is no apparent consecutive seismicity in similar areas. Hence, they appear disorganized because similar events often occur randomly. In the right part of Figure 4 the correlation values are ordered by multiplet group, where we observe that two big multiplets groups appear highly correlated. With regards to the remaining groups, most of them are grouped in doublet pairs, so they cover a smaller area in the matrix. This data set has an average correlation of 0.6 (60%), which shows that in general, events that do not belong to the same cluster can still show a considerably high correlation.
After identification of doublet pairs, the peak time lag reveals relative arrival time shifts highlighting potential mispicks but also missing picks. In Figures 5a and 5b, two doublets from multiplet group 1 are shown, with original time picks that visually look correct. However, Figure 5c shows event waveforms relative to the original P-wave picks. A minor inconsistency in picking is revealed as their onsets should be identical. By determining the lag corresponding to the maximum peak in the crosscorrelation function we are able to correct these picking errors and improve ultimately the event locations. Figure 5d displays both waveforms after alignment.
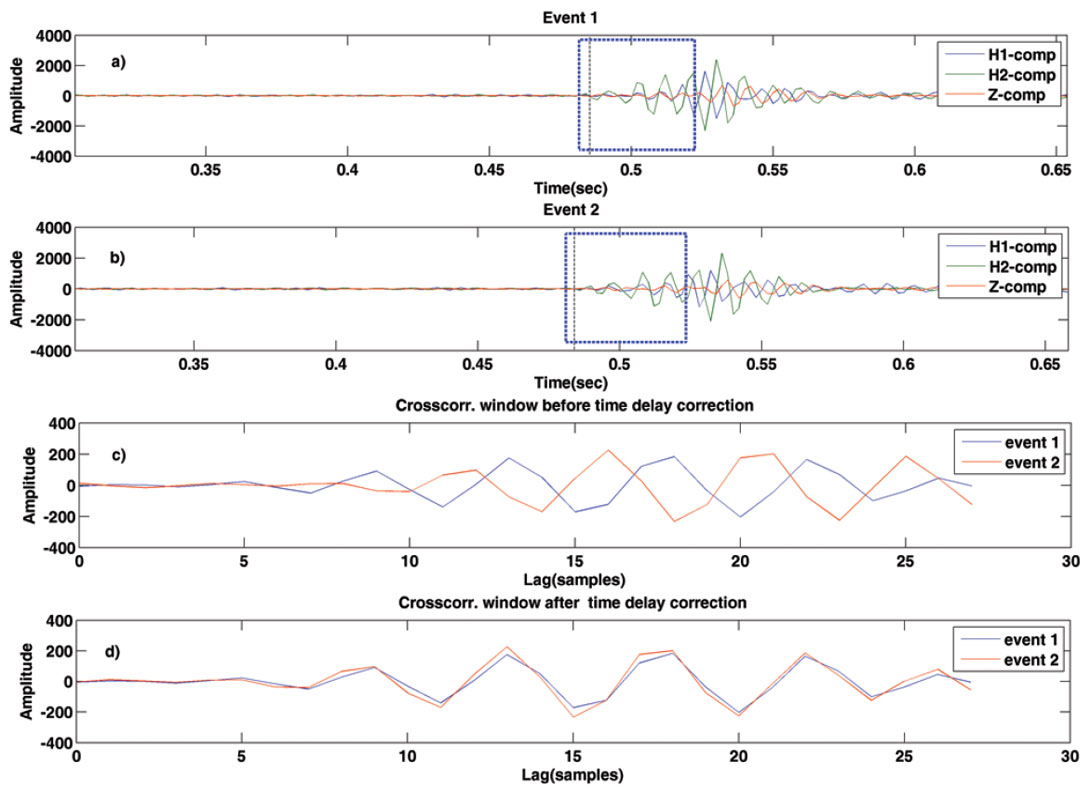
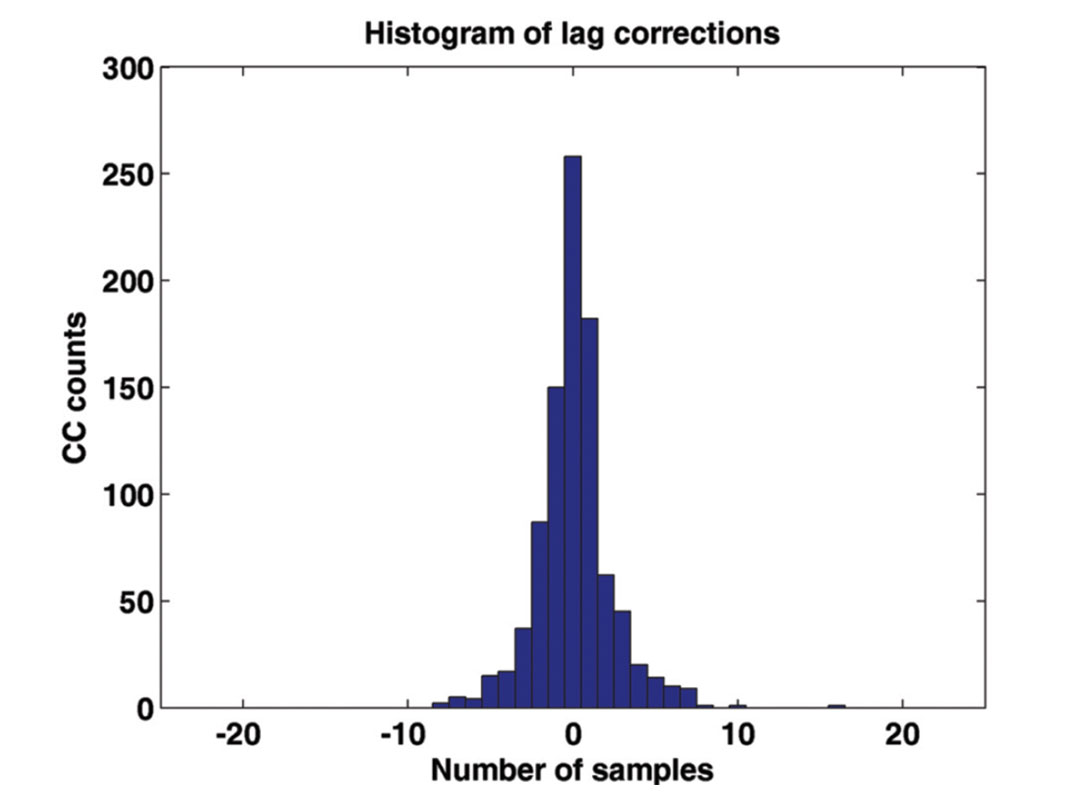
Figure 6 shows the time delays, expressed as number of samples for doublets in multiplet group #1. Most inconsistencies are limited to 10 samples (20 ms) which can produce spatial shifts in locations up to 75 m assuming an average P-wave velocity of 3700 m/s. This can be used as a default time pick uncertainty in the likelihood function for absolute event location.
Double-Difference method
We applied this method to microseismic events detected during one month. Compared to our double-difference method, in the original method developed by Waldhauser and Ellsworth (2000) during the first iterations, more weight is assigned to catalog data than to correlated data and for further iterations, more weight to highly correlated ones. In our method, we first determine absolute locations using a direct-search method and locate events giving more weight to highly similar and closer events. A homogeneous velocity of 3700 m/s was assumed in the source region.
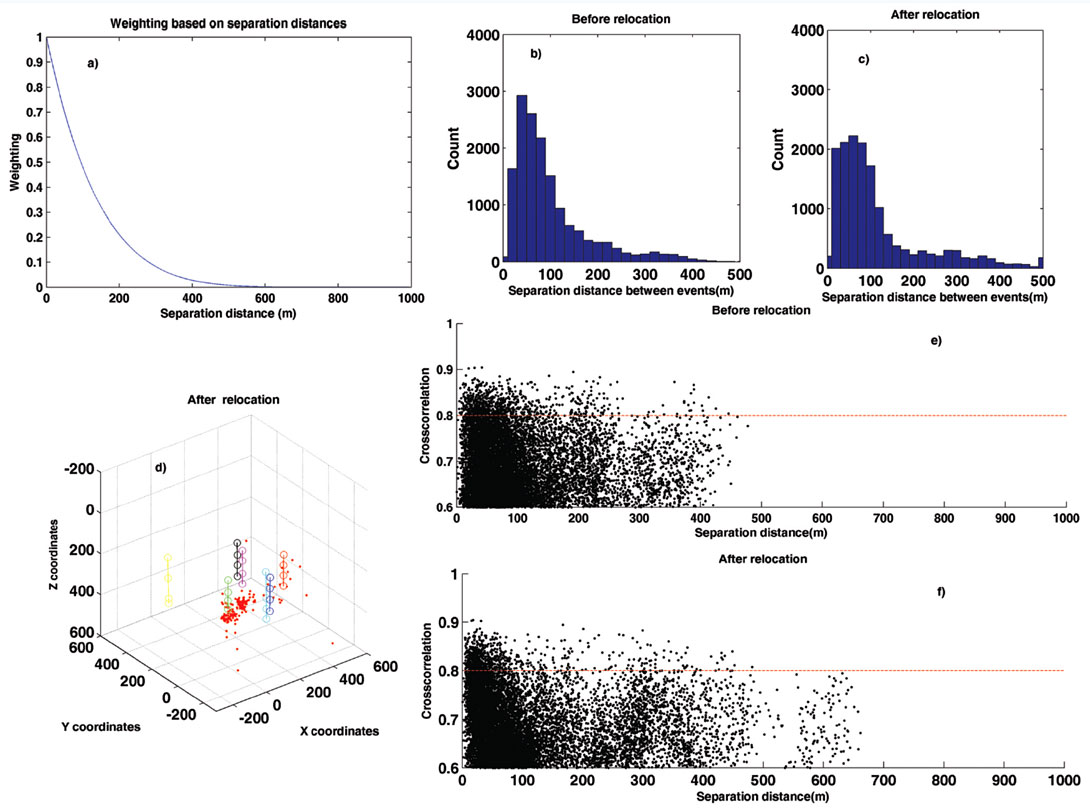
After determining the desired time lags between doublet pairs, we need to assess individually the influence of the various weighting schemes on the resulting event relocations when solving equation 1. Figures 7 and 8 show the results after applying different parameters for the distance weighting (equation 2). The most influential factors are the exponential a and maximum separation dmax. For instance, when a = 1, there is a rapid decay with distance (Figure 7a). This appears very abrupt since only very close events will have high weights. Also, after relocation there are event pairs whose separation distances have been elongated to approximately 600 m (Figure 7c and 7f). Figure 7d shows some events scattered; these can be considered outliers produced by the weight selected. On the other hand, using a = 3 (Figure 8a), doublets with large location errors have been moved closer to each other (Figure 8c and 8f). In Figure 8a, the weighting curve decays negligibly up to 200 m, creating a gentler reweighting. This is justified since Figure 8e indicates that events with correlations larger than 85% can be initially located up to 400 m apart. The harsher weighting for a = 1 prevents accurate relocation of doublets with such large separation distances, yielding relocation artifacts (Figure 7d). It is important to set the distance weighting curve to allow for relocation of events mispositioned dues to large picking errors (e.g., because of misidentification of the true P- or S-wave arrival). Value dmax is set to 700 m since there are no event pairs that far apart.

Figure 9 shows the two different crosscorrelation-based weighting curves using two different values for parameter d while keeping a fixed. In the top left side, for reference, a simple quadratic relationship is defined as d = 2. This curve does not differentiate between highly correlated and less-correlated events; as a result, the assumptions of the method are not satisfied, as a group of event pairs have elongated their separation to 500 m (bottom left of Figure 9). In the top right, exponent d = 15 produces a more appropriate curve since it greatly emphasizes correlation coefficients of 80% and higher. As a result relocated events with high correlation values are more tightly clustered (bottom right of Figure 9). Figure 10 shows the microseismic event locations using d = 2 and d = 15. Note that for d = 2, this single multiplet group is separated into two clusters (left of Figure 10). However; one of the clusters has been relocated below 500 m, which is suspicious since the receivers array does not allow for a reasonable location constraint at that depth.
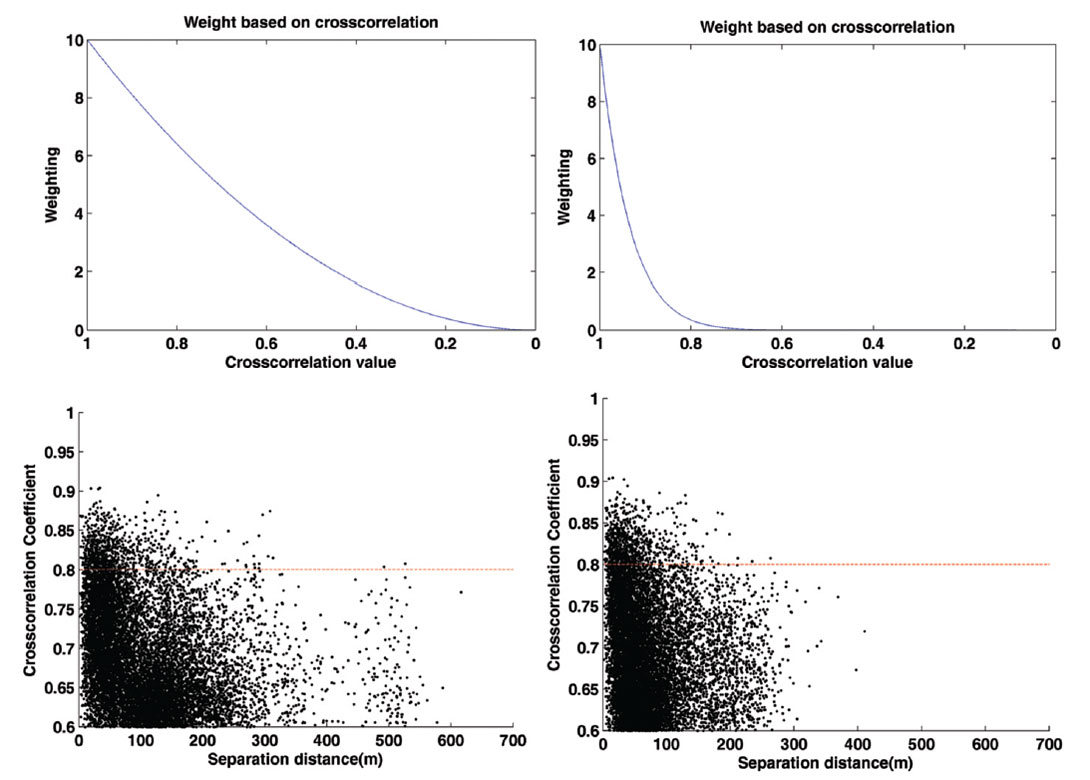
The chosen weighting scheme is thus a = 10 , d = 15 for the correlation- based weighting function and a = 3 , b = 7 and dmax = 700 m for the distance-based weighting function (equations 2 and 3). Doublets with distances up to 200 m have approximately uniform weights. Between 200 and 700 m observations are down-weighted. Larger distances are dismissed using null weights. Likewise, doublets with correlations larger than 80% are greatly emphasized.

Figure 11 shows the largest multiplet group (#1) containing 179 events before and after relocation using the implemented weighting scheme. Note that the NW-SE cluster has been considerably tightened. Most events at the edges have been brought to the center. This is also observed in the depth profiles, where the seismicity has been collapsed to depths between 420 and 530 m. A few events are farther apart possibly due to poor event linking since we did not enforce mutual similarity but a chain-like fashion to link event pairs. This tightening of events fulfills our objective since similar shaped events should be colocated. Also, it demonstrates that assuming a homogeneous velocity model in the source area is enough to obtain seismic locations despite the complexity of the surroundings. Given the location of the cluster, this is most likely associated to activities in one of the shafts.
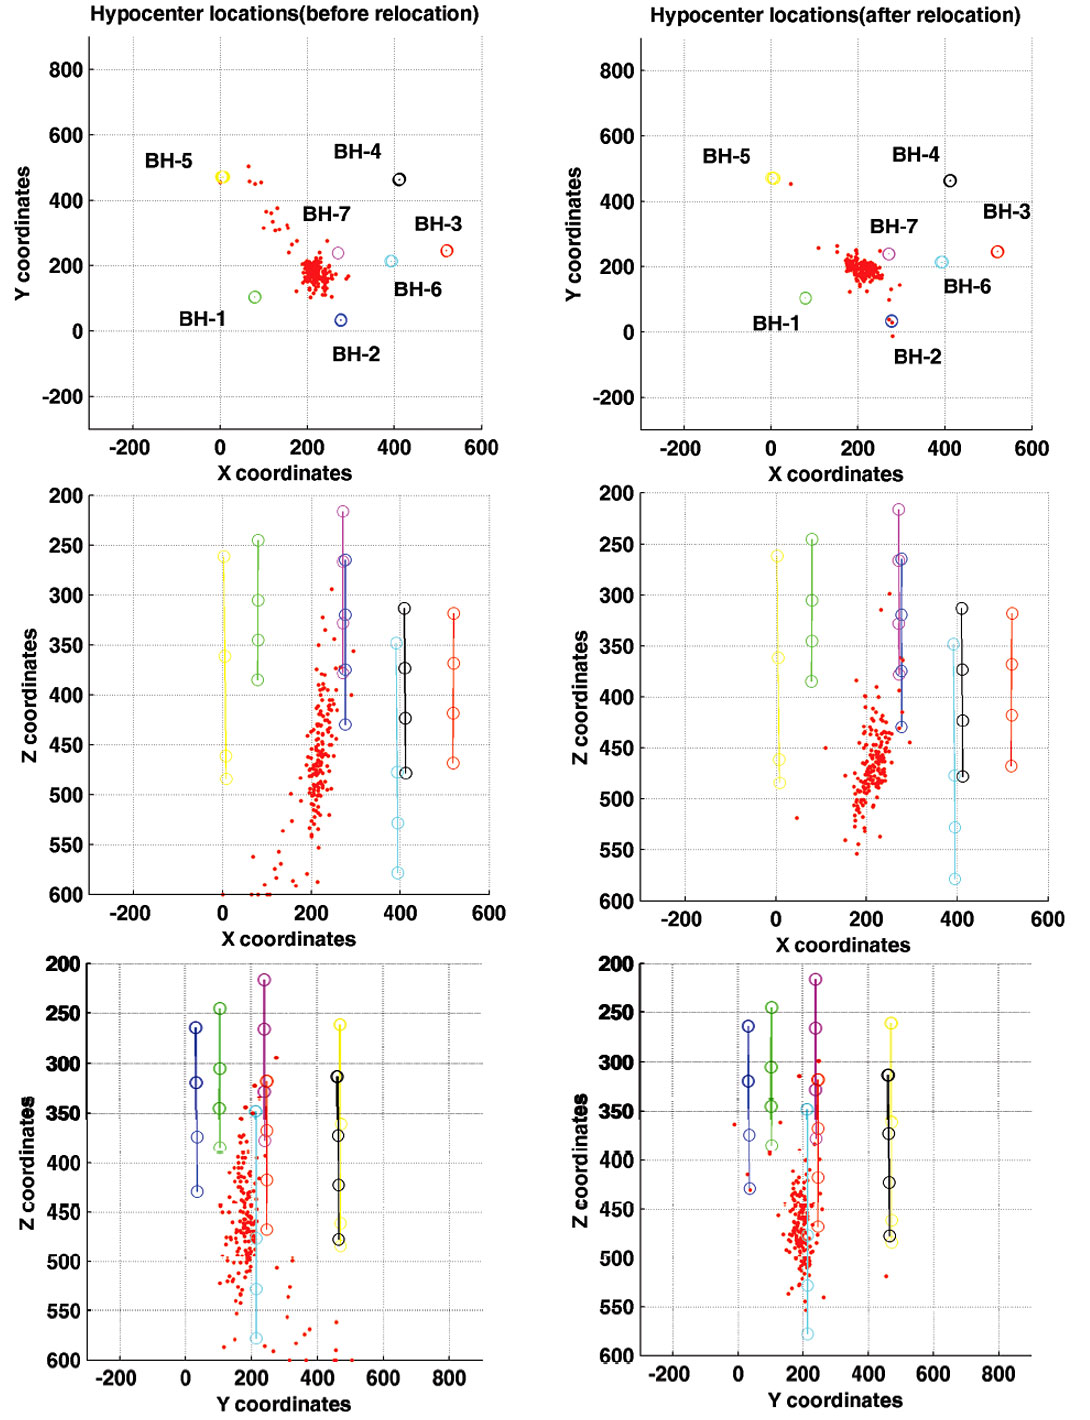
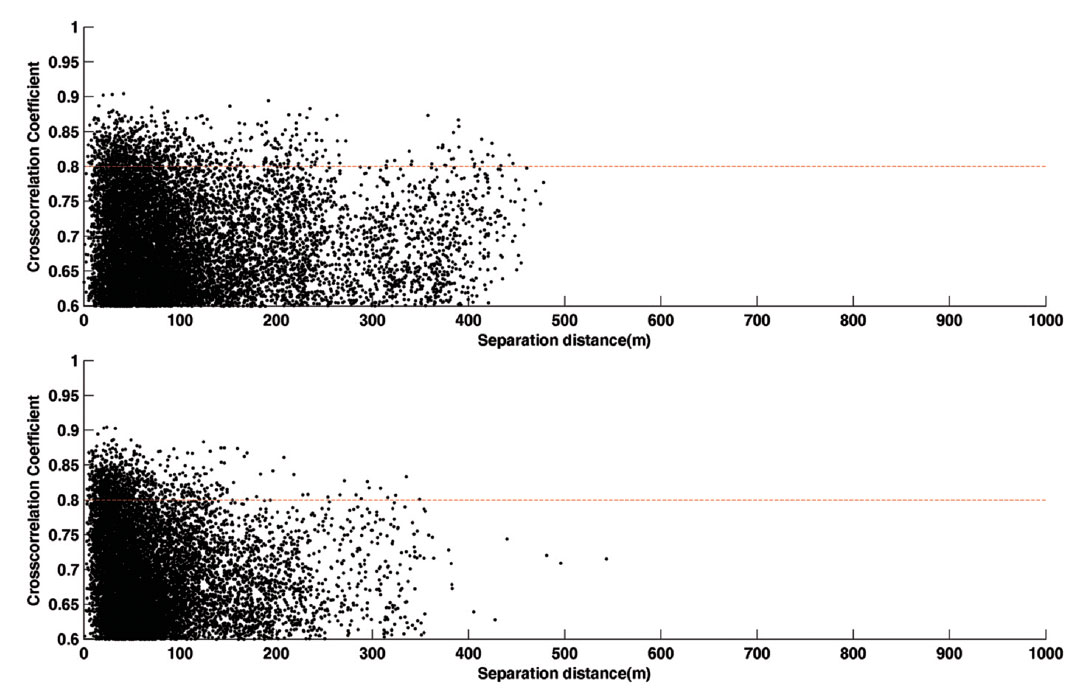
Figure 12 shows the crosscorrelation coefficients as a function of separation distances between event pairs before and after relocation for the multiplet group #1. Large correlation coefficients above 80% imply near-identical source locations. As a result, highly correlated events with large separation distances suggest errors in the locations, probably due to mispicks. Separation distances for highly correlated events have been significantly reduced after relocation, indicating the success of the method. There are a few event pairs which have increased their separation distance after relocation, most likely due to poor linking between these pairs.
Discussion
Accuracy and precision of event hypocenters depend on three factors, namely acquisition geometry, employed velocity models and errors in travel time picks. We take advantage of the assumption that highly similar waveforms correspond to events originated in the same source region and with near-identical source mechanisms to perform an event relocation technique to reduce errors due to mispicks and velocity uncertainty. Nonetheless, relocation results depend strongly on the chosen weighting scheme, based on the minimum correlation level and the maximum separation distance. We chose the minimum correlation 0.8 (80%), which is sufficient low to create multiplets, but sufficiently high to differentiate between different groups. For a threshold of 0.9, only four doublet pairs are detected. On the other hand, using a lower threshold of 0.7, 440 events (90% of total events) are gathered into several groups; however, most of these events are poorly linked.
For the initial locations, we assumed a Pwave homogeneous velocity model, since a 1-D isotropic velocity model produced higher residuals between observed and calculated travel times, as there were artifacts clearly related to this velocity model. This simple assumption is justified since we are interested in relative relocations and the approach accounts for shared ray paths irrespective of the complexity of the velocity model.
The relative event locations are largely insensitive to inaccuracies in the local, homogeneous velocity model except for relative distances as these will be expressed in an expanding or contracting microseismic cloud for respective underestimated or overestimated velocities. In other words, events along a planar fault plane remain distributed within a plane, yet its spatial extent may vary. On the other hand, initial absolute locations are likely spread out over a 3D cloud due to velocity and picking inaccuracies.
Accuracy of event locations depends strongly on picking quality. The cross-correlation method corrects for potential mispicks and also acts as a quality control measure. For instance, Figure 6 shows that 28% of the time picks are perfectly consistent, and 65% are within ± 1 sample (2 ms).
The chosen weighting scheme has a significant influence on the relative relocations. We recommend setting distance weights in equation 2 such that they do not exclude any highly correlated doublets. Likewise the correlation weights in equation 3 are to be set such that correlations below a set threshold are downweighted. In our case, distances up 200 m have a near-uniform weight and those beyond 700 m are discarded. Likewise, correlation coefficients larger than 0.8 are greatly stressed. Obviously, these values may change with each application depending on acquisition geometries and original signal to noise ratios. In addition, matrix normalization of the derivative matrix G is vital, since its omission can significantly bias locations and origin times.
A disadvantage of the double-difference method is that the system can become very large if all event pairs are used, unlike master-event relocation technique. To circumvent this, we can increase the minimum number of links between event pairs, so only strong event pairs are considered. Also, we can increase the minimum correlation threshold. Obviously, there is unfortunately a trade-off between severity of the implemented thresholding and allowing for more flexibility in the inversion system permitting more constraints on the final relocations. Additionally, the maximum number of neighboring events can be reduced so that only those with higher correlation values (or smaller interevent distances) are used.
Conclusion
Assessment on waveform similarity is useful for relocating microseismic events, especially when they originate in the same source region with nearidentical source mechanisms. Picking errors are a major source of event mislocations, but they can be corrected through crosscorrelation methods. The double difference method significantly reduces errors in relative event locations by collapsing multiplet clusters. The assumption of a homogeneous velocity model greatly simplifies velocity model building; yet it is warranted since the methodology implies largely overlapping source-receiver raypaths. Additionally, the implemented weighting scheme has a significant effect on final locations since the assumption of “raypath similarity” is to be honored even for doublets separated due to large picking errors. This leads to some subjective choices such as the minimum correlation coefficient. Nonetheless, by linking similar events in a chain-like fashion ultimately uncertainty in relative event locations is greatly reduced.
Moreover, crossplots of correlation values versus event distances and histograms of time-lags of highly correlated events serve as useful quality control measures both of absolute locations and subsequent relative relocations. As a consequence, multiplet analysis and double-difference relocations can greatly aid in quality assessment of time picks and hypocenters, as well as considerably facilitate any geologic interpretations.

Acknowledgements
We would like to thank the Microseismic Industry Consortium for project funding, and an anonymous company for permission to use and show the data set.
Related Reading


Join the Conversation
Interested in starting, or contributing to a conversation about an article or issue of the RECORDER? Join our CSEG LinkedIn Group.
Share This Article