Introduction and Background
In 2004, Apache embarked on an investigation of multicomponent technology. One of the projects undertaken was a target of upper-Mannville channel sands, specifically the Rex member. Some of this work was presented by Monk et al. in the May 2006 RECORDER, however additional efforts have been put into the analysis recently in order to better understand what the multicomponent data is revealing. For background on the acquisition design and initial processing, we refer you to the May 2006 RECORDER article (Monk et. al.). One point of interest is that the reservoir quality sands are very shaley, relative to conventional reservoirs, with shale content as high as 60% in producing reservoir sands.
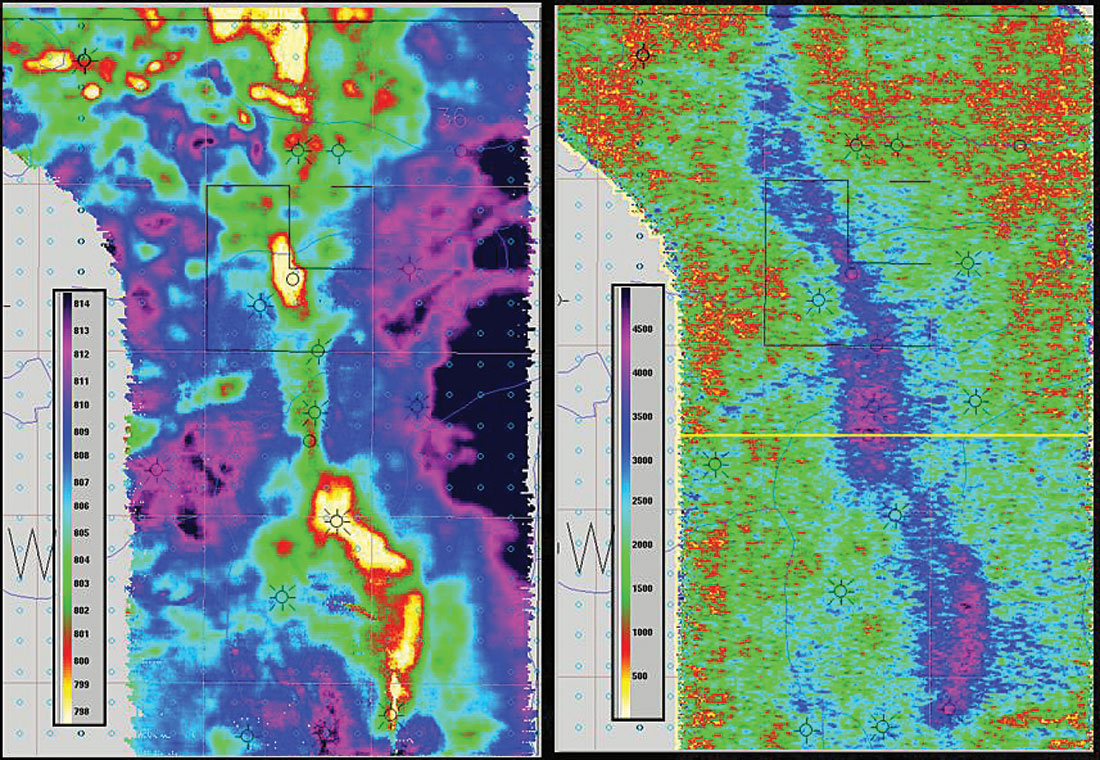
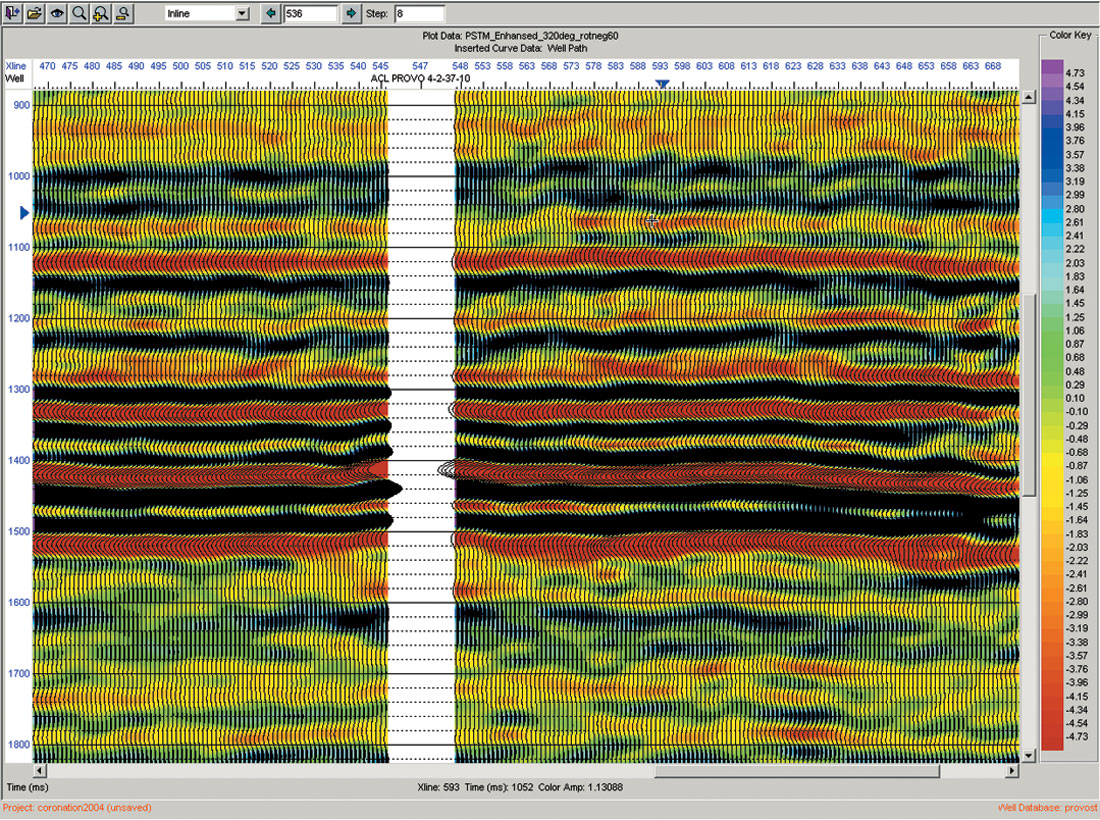
Simple mapping carried out very early in the project showed positive results beyond expectations. Figure 1a shows a two way time map, made from the second processing version of the PP data, of the Rex coal. The drape anomalies associated with the channel system are immediately evident. We consider this to be an indirect way of mapping the channel system. The same figure also shows an RMS amplitude map, made from the first processing version of the PS data, of a 19 ms window located beneath the Rex Coal. The map clearly shows the presence and absence of the channel system. We consider this to be a direct measurement of the channel system, given that PS data should respond only to lithology, not to the fluid content within any particular lithology.
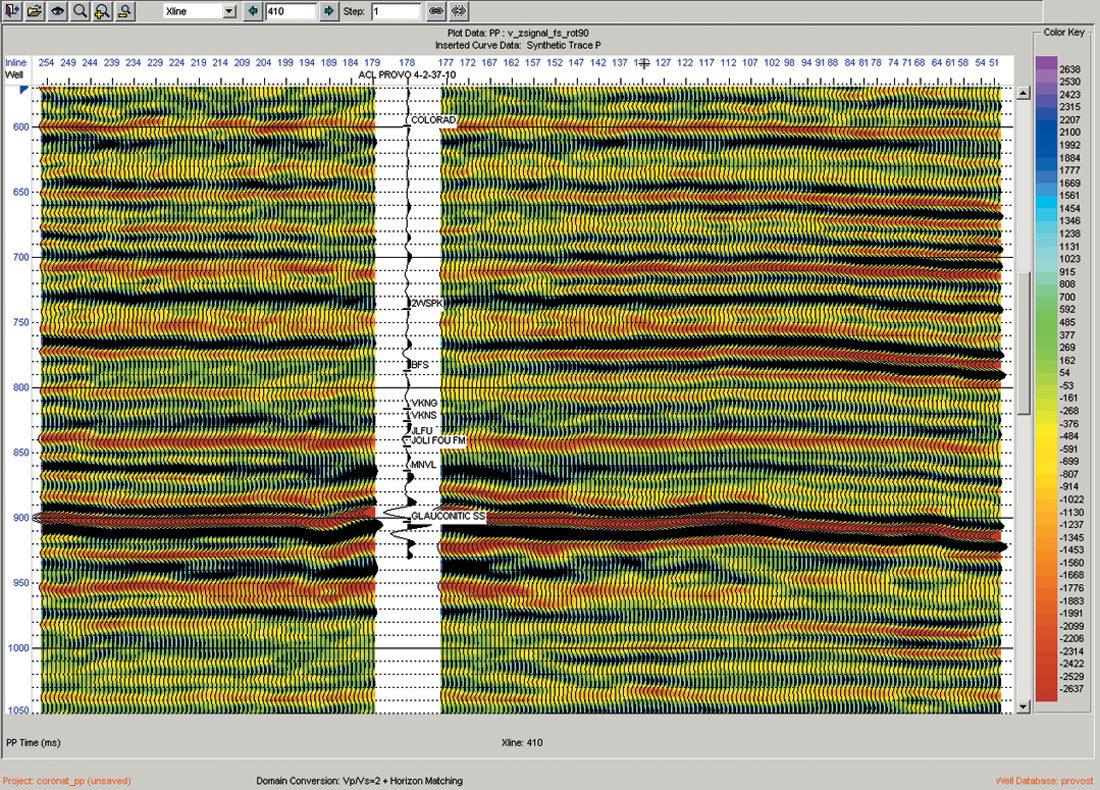
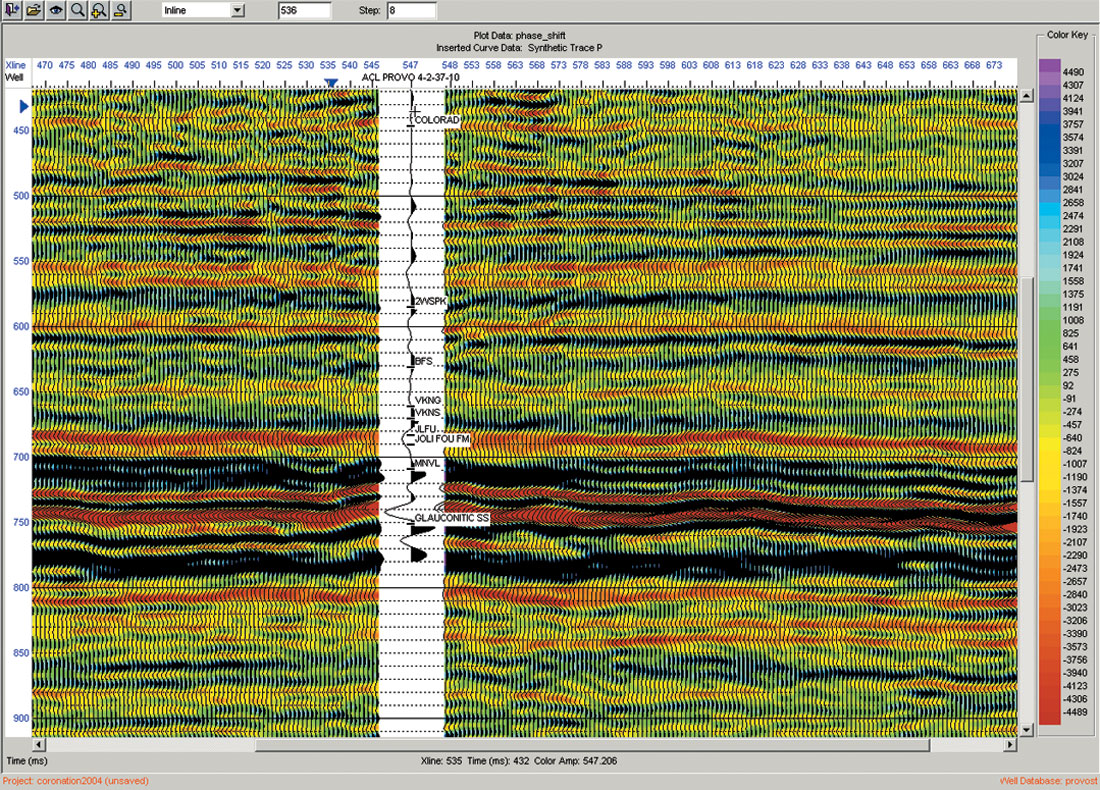
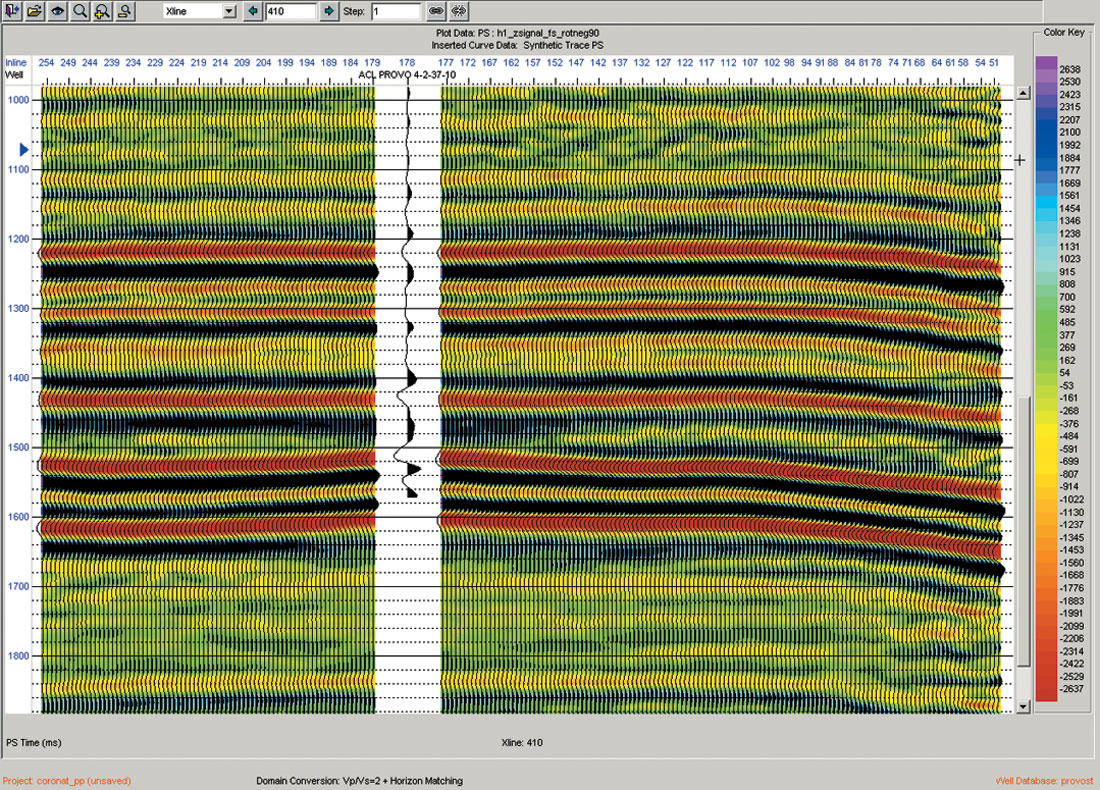
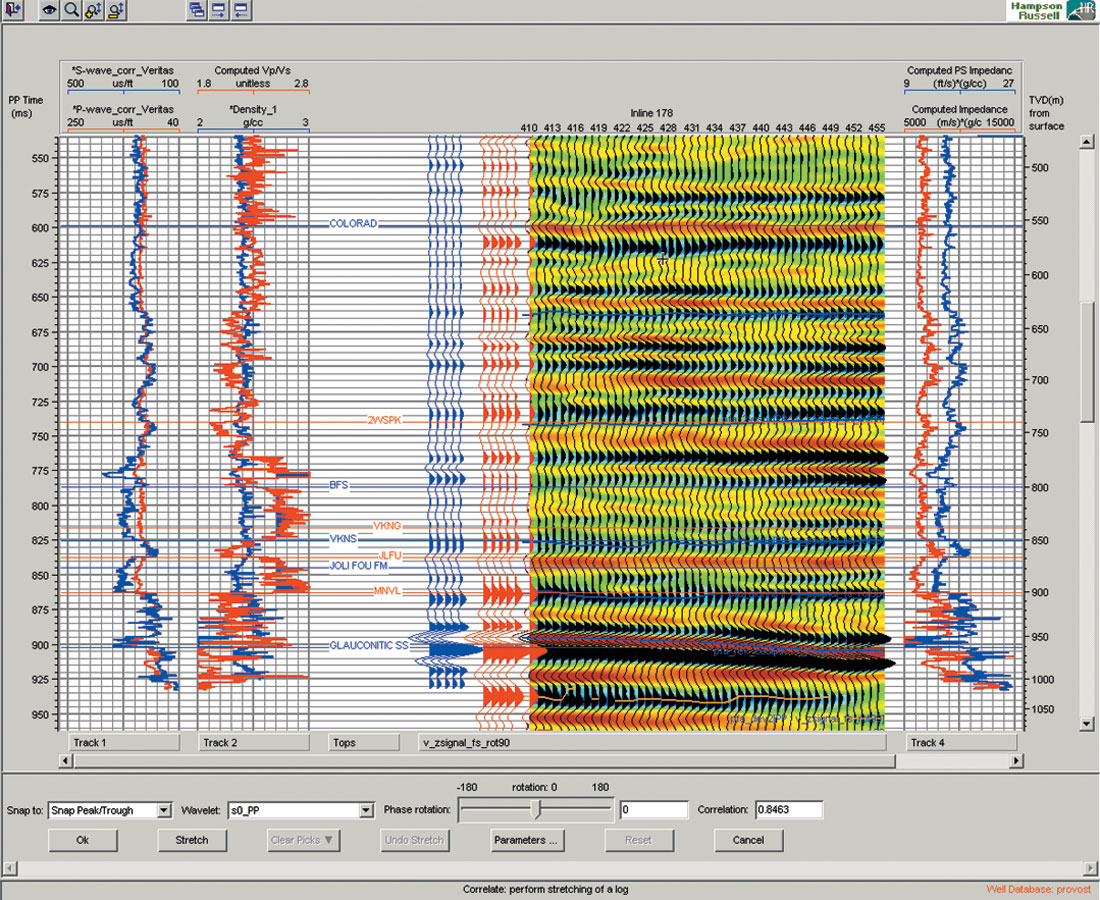
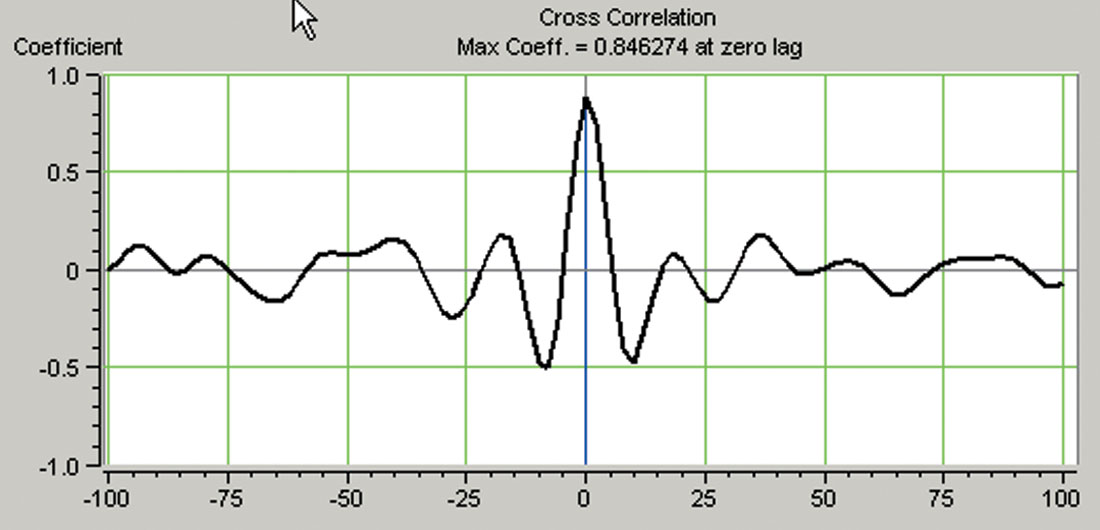
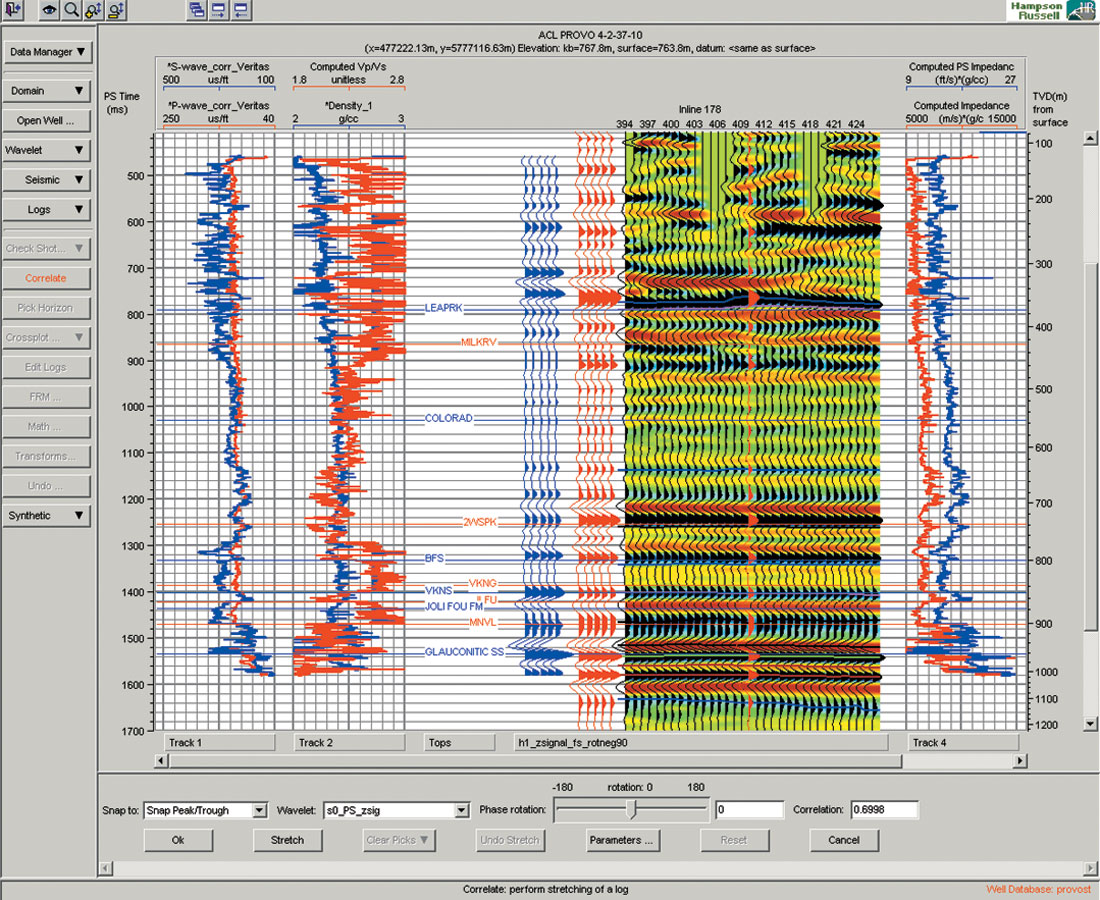
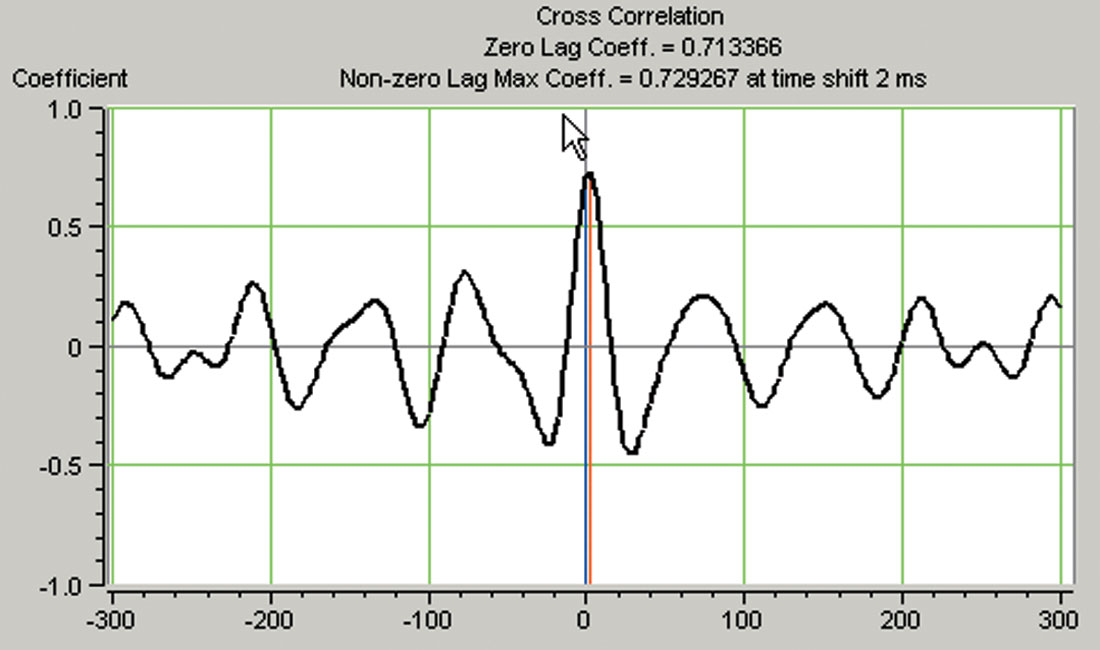
Correlation of the seismic data was performed first on the PP data then on the PS data using a PS synthetic. Well ties on the newly processed data proved to be very good over a large window for both the PP (cc: 85%) and the PS (cc: 73%) data after rotating the phase to zero relative to well control (Figures 3 and 4). Well ties to the PP and PS data are shown in Figures 4 and 5 respectively.
Registration
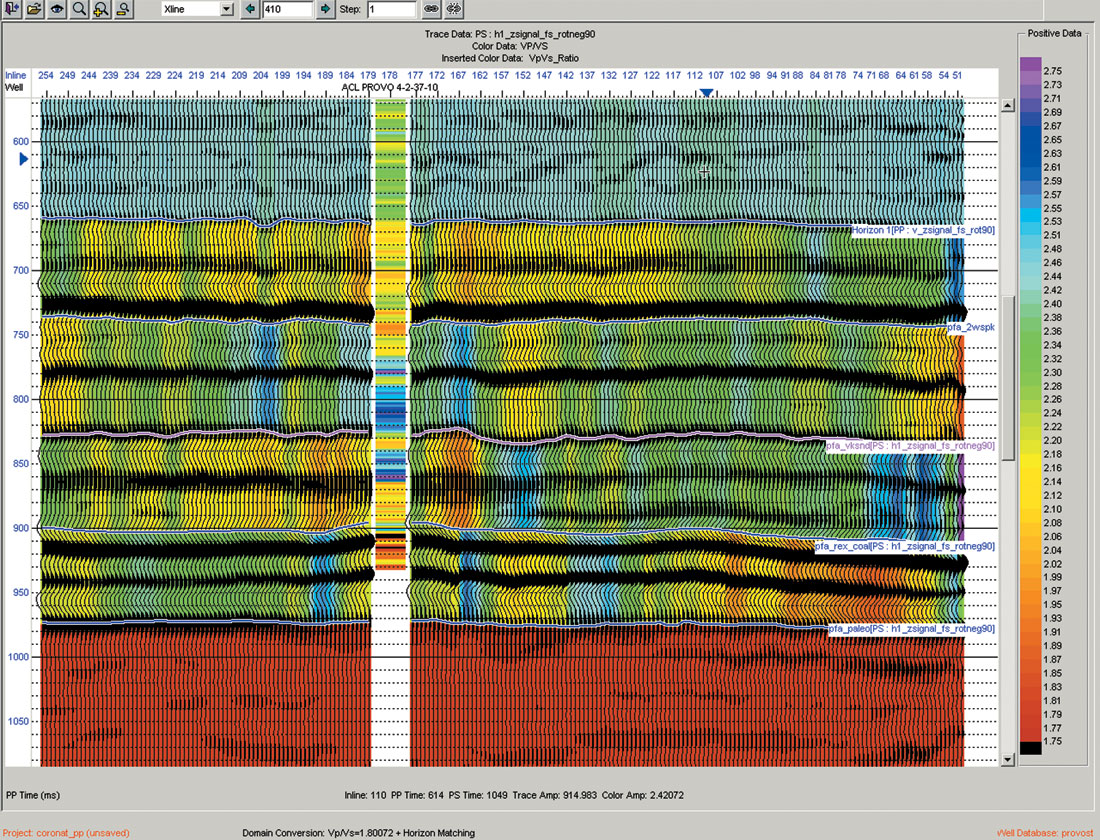
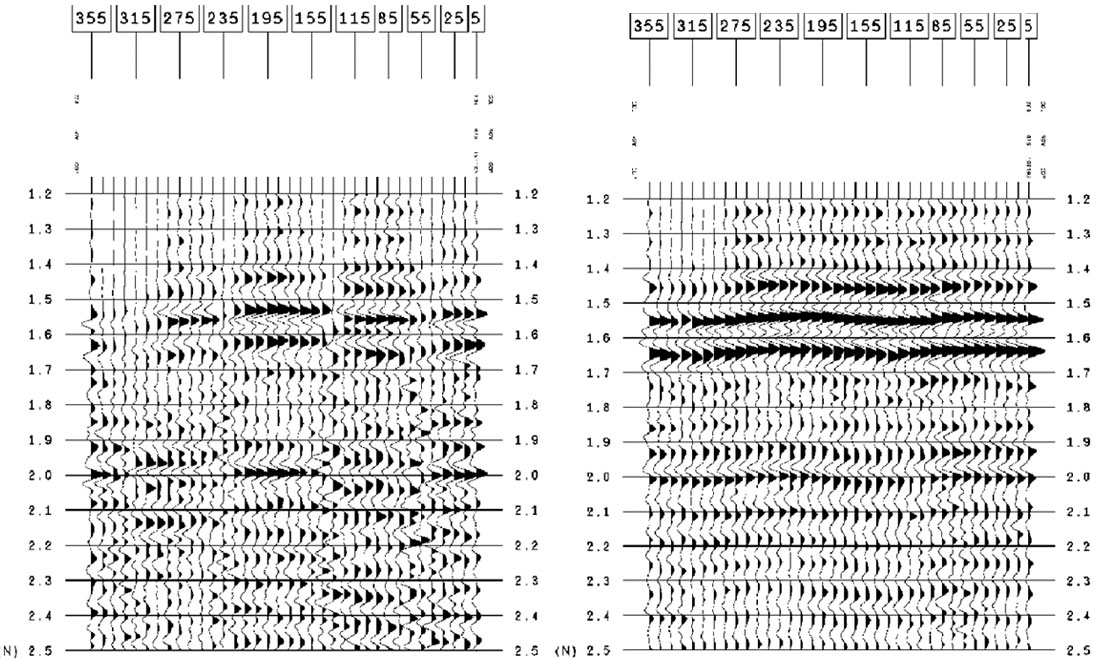
Using these well ties to correlate events between the PP and PS data, registration was undertaken. Not unexpectedly, a key horizon, the Paleozoic unconformity, is a difficult reflector to pick and requires several iterations to finalize upon its picks. The difficulty being that the Paleo is a weathered unconformity between Paleozoic carbonates and cretaceous clastics. As a result, the seismic response is very heterogeneous within a 3D volume, usually being a peak, but can also occur as a zero- crossing or trough, due to tuning artifacts and relative compressibility and rigidity of the weathered carbonates. As such, a deeper reflector has been chosen at this time to use for the preliminary registration. Figure 6 shows a cross-section of the registered PS-data in PP-time and the corresponding Vp/Vs model. The Vp/Vs ratio from well data is also shown at the well location.
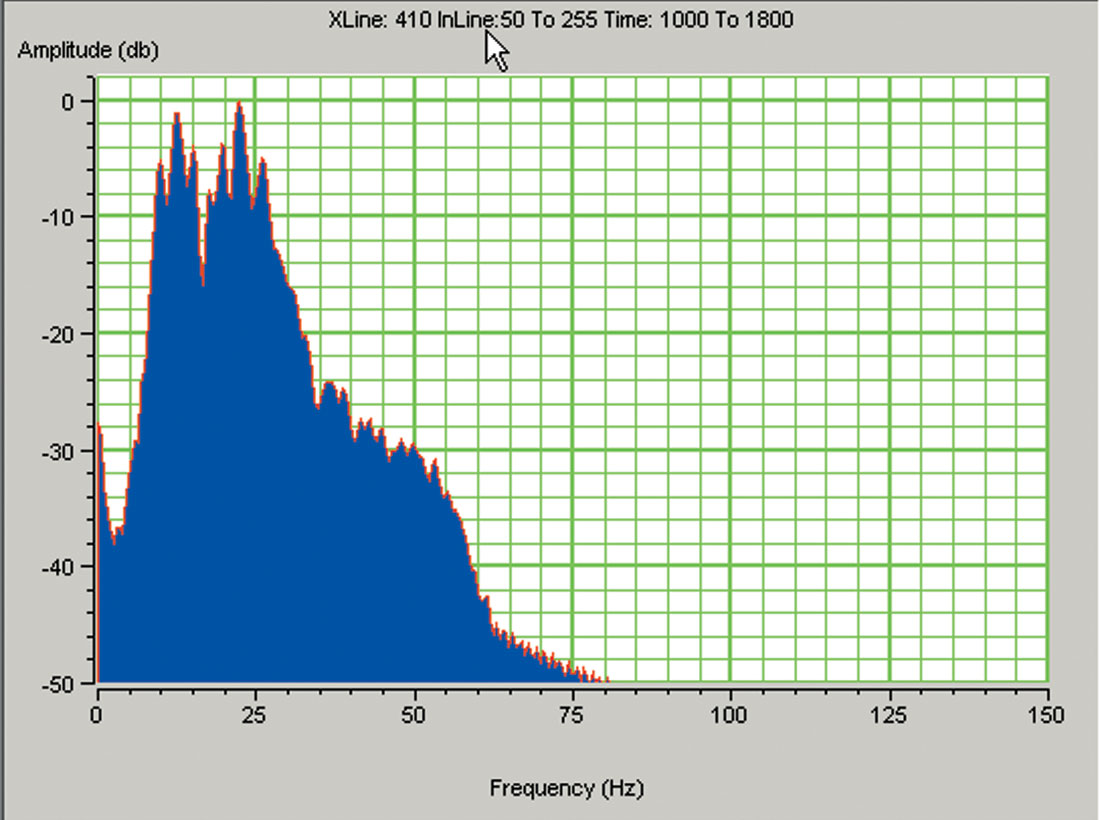
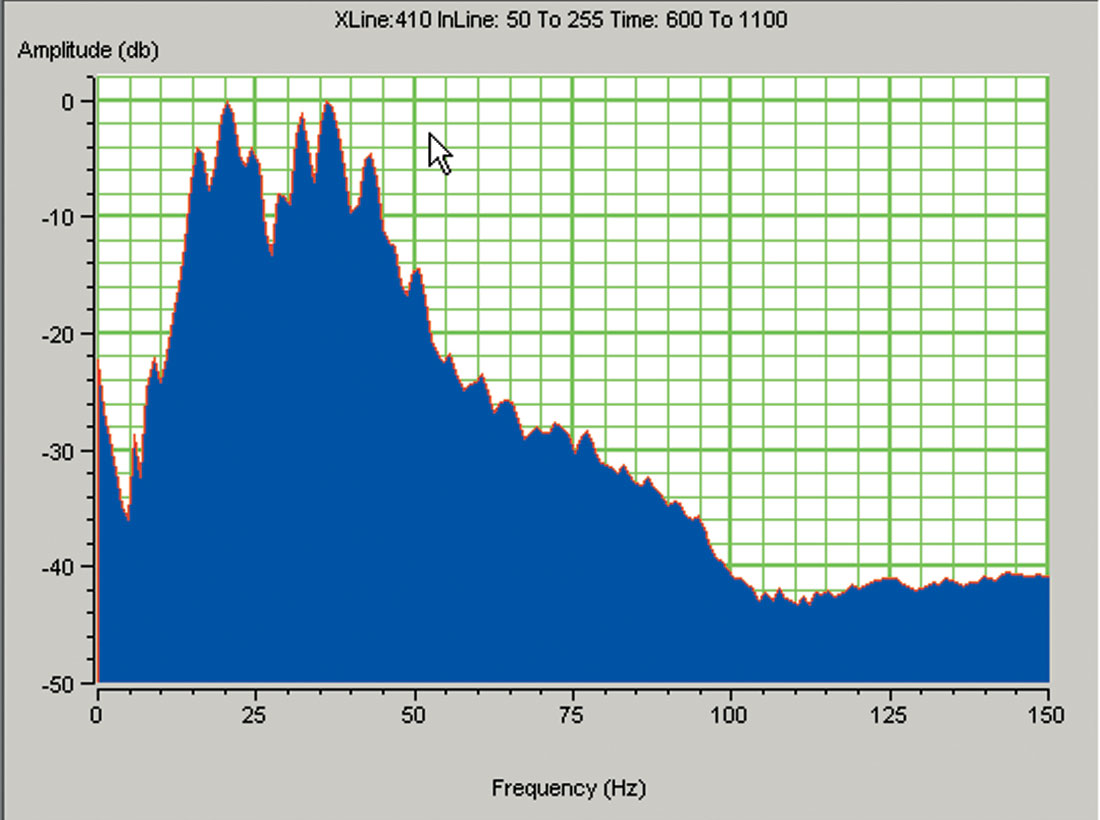
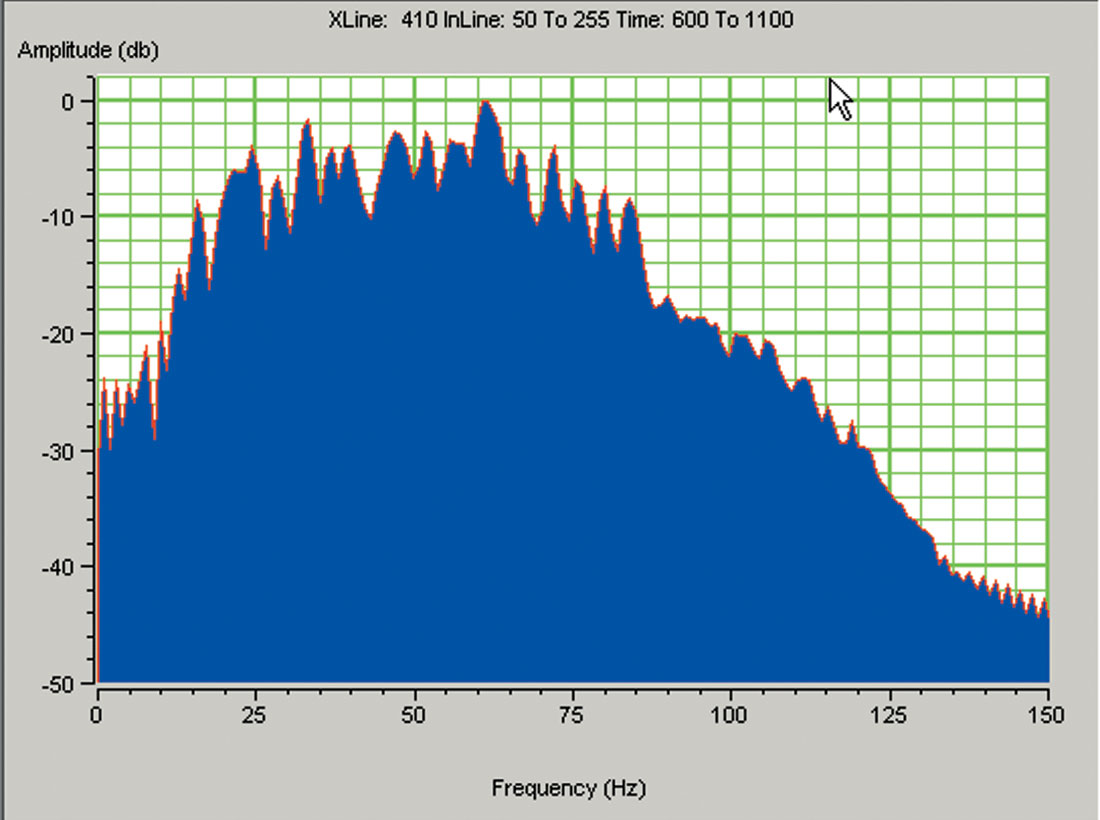
As a result of the registration process, the apparent band width of the PS data, using a cut-off of 20 dB down, has increased from 8-32 Hz (Figure 7) to 11-52 Hz (Figure 8), an increase of approximately 63% a the high-end. As a comparison, the PP-data bandwidth, over the same geologic interval and using the same cut-off, is 11-98 Hz (Figure 9).
PS1 and PS2 Analysis
Additionally, rotation analysis of the radial and transverse data was performed to evaluate the presence of shear-wave splitting. The basic principle is that as shear waves propagate through an anisotropic medium, for example a thick coal with cleats, the shear waves, Sv and Sh, become polarized in the direction of the cleats, resulting in time delays that are dependant upon azimuth for a particular CCP gather. When it is present, this time-delay can appear to be residual statics or velocity errors on the radial CCP gather. It also results in residual, coherent energy on the transverse component. Upon investigation of transverse component, residual coherent energy was found, so PS1-PS2 rotation analysis was performed. Figure 10 shows a sample CCP gather radial and transverse components for this rotation analysis. The transverse component show characteristic polarity reversals which correspond to the fast and slow shear wave azimuths. By examining the radial component we can determine that the fast shear is oriented 55° E of N and the slow is perpendicular to that at 35° E of S. The radial data shows a time delay of approximately 13 ms down to the top Mannville. However, when measuring the time delay at the Rex Coal, it is approximately 17 ms, indicating an increase in anisotropy within the upper Mannville, above the Rex coal.
Conclusions
To date, the PS data has proven very valuable in the risking of potential drilling locations. A look-back was performed to determine how many of the original wells on the program would have been drilled had the multicomponent data been incorporated. Surprisingly, the success rate would have improved dramatically, resulting in fewer holes drilled. Work continues on this project, including poststack inversion of the PP-data as well as joint inversion, where the multicomponent data will be included in inverting for P-impedance, S-impedance and density, based upon similar work published by Hampson et al. (2005). As well, neural network analysis will be attempted to determine if such an analysis can provide an estimate of sand quality (Anderson and Gray, 2005).


Join the Conversation
Interested in starting, or contributing to a conversation about an article or issue of the RECORDER? Join our CSEG LinkedIn Group.
Share This Article