Summary
Many considerations go into the design of a surface or nearsurface array for microseismic monitoring. These include aspects of the array itself such as the number of stations, the station depth and density, array aperture, shallow geology as well as the geology of the target formation and completions design. Other considerations include those pertaining to the site itself. These include, but are not limited to, cultural noise, surface obstacles, accessibility for a drill and personnel, environmental restrictions, ground conditions, seasonal considerations as well as the safety of the microseismic crew. After acquisition, the results of the original design can be used to optimize future monitoring array designs. This article will walk you through the design and optimization process of two near-surface arrays in the Horn River Basin in Northeastern British Columbia, Canada.
Introduction
In 2011, a permanent shallow array consisting of 151 geophones was deployed over an area of 40 km2 on the Kiwigana property in the Horn River Basin. A buried array design was chosen based on a number of factors, including the long well lengths, which reach 6100 m measured depth, changing completions schedules and difficulties with event multipathing, which can complicate downhole processing (Eisner, 2009). This array was designed to monitor 253 completions on a 10-well pad, 15-D, over a term of 90 days (Taylor, 2012). The array was expanded in 2012 to monitor a subsequent pad, 67-D, with the addition of 70 stations to cover a further 30 km2 and utilize 28 stations from the first array. The reduction in station count was a result of decimation tests, which were used to optimize the station count, data quality and cost.
Surface microseismic survey design considerations
The first steps in the design of a near-surface array are to collect treatment and well information but also to consider the project goals to ensure that the array is designed in such a way as to obtain the required information. The goals of monitoring the Horn River Basin pad were to evaluate stimulated reservoir volume (SRV), well and stage spacing, completions techniques and ultimately to maximize resource recovery. To accomplish this, a 151-station array was designed using single level three-component 10 Hz sondes to image hydraulic fracture stimulations in the Evie, Muskwa and Mid-Otter Park Formations. The number of stations used was to ensure that signal could be separated from background noise.
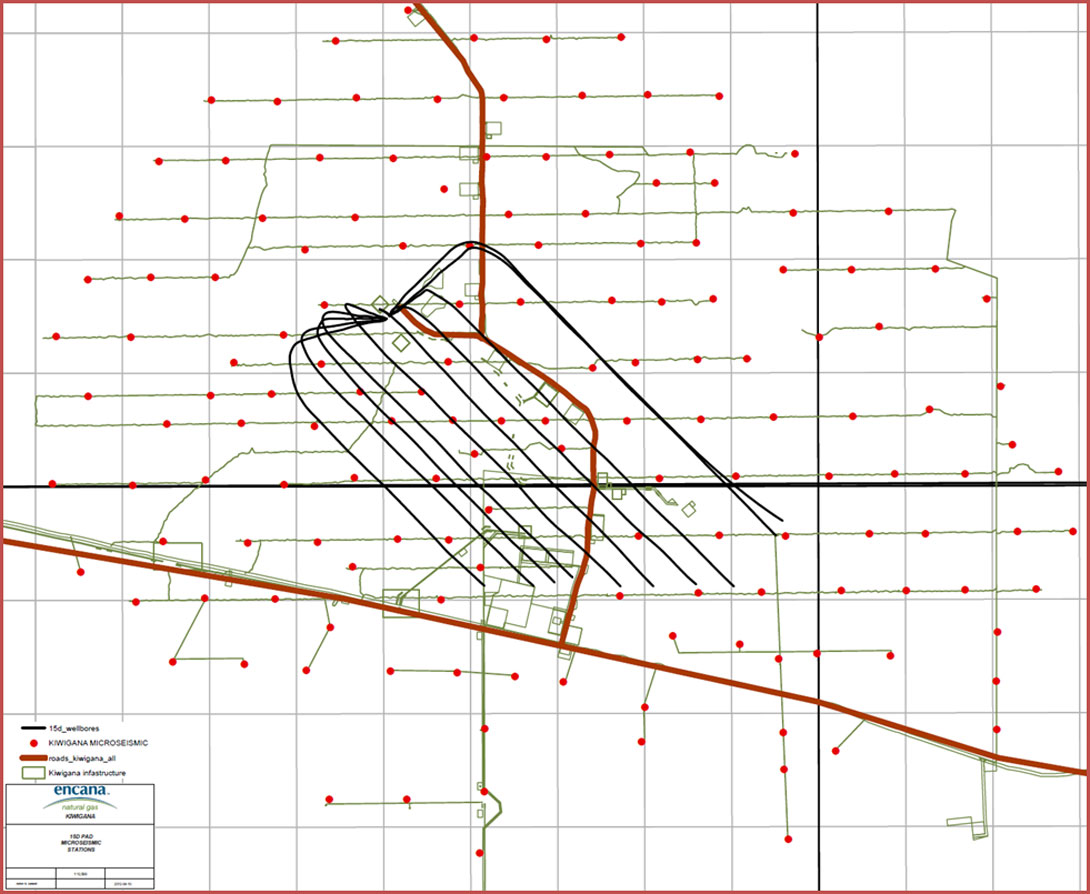
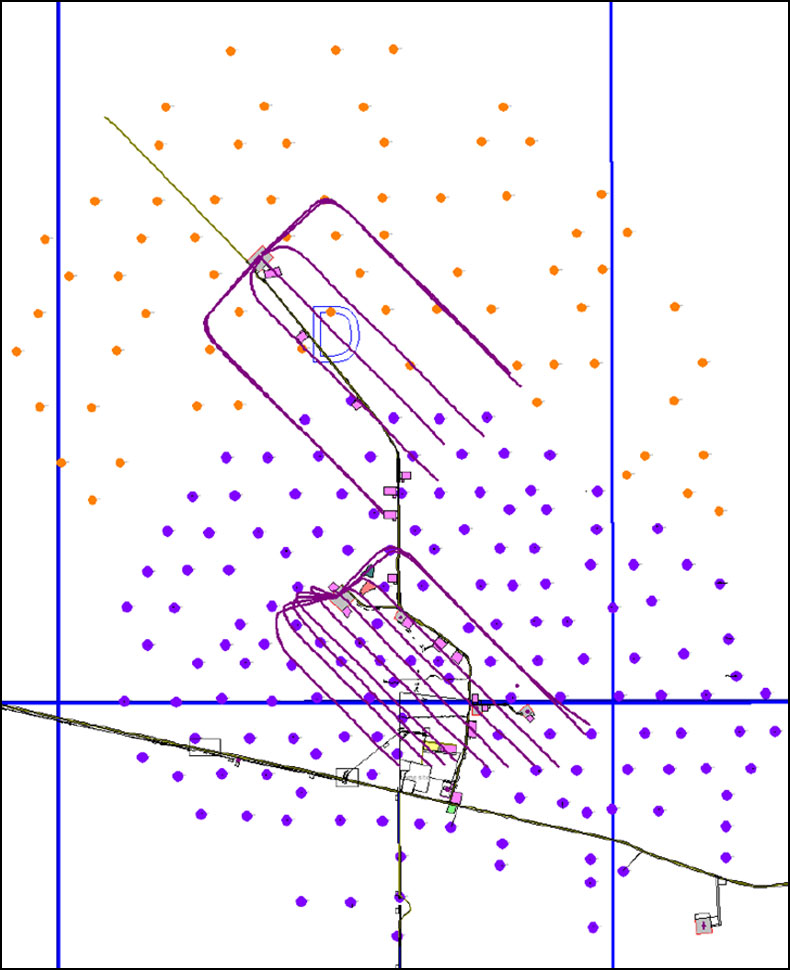
Early in the design process, sensors are placed in an ideal network over the pad. The array aperture is designed such that the distance from the edge of the array to the nearest well is approximately the target depth, which in this case is between 2300 and 2500 m. The array aperture is designed to capture wide-azimuth, full-fold data and maintain a consistent microseismic mapping over the entire pad (Zhang, 2011). Stations are then repositioned to accommodate geological, environmental and cultural features. At Kiwigana stations were moved to avoid changes in shallow subsurface geology, facilities and roads. Existing seismic cut-lines were utilized in the design to increase ease of station access and minimize environmental disturbance. Since this was the operator’s first surface array in the area, 151 sensors were used to oversample the data to ensure a high signal to noise ratio during recording. The final design is shown in Figure 1.
Noise was a concern at this location and a consideration for station depth. Surface facilities, including a camp, are located within the array as well as heavily used roads. In addition to surface noise, shallow quaternary channels from 50-200 m depth were noted to degrade the signal quality on 3D seismic gathers, and were a concern for surface microseismic signal quality (Taylor, 2012). In the final design, some stations are relocated to avoid these channels.
A noise test from another site in the Horn River Basin was used to estimate expected noise levels for the 15-D pad. By placing sensors at various depths and recording during treatment, noise attenuation with depth can be quantified and the optimal burial depth identified. This is not regularly done, but it is an extra step to ensure project feasibility in new exploration areas. It was found that a sufficient reduction in noise was obtained at 30 m burial with marginal additional noise reduction at 100 m depth. The Quaternary channels underlying the array also placed a constraint on sonde depth since these can be gascharged and pose a drilling hazard. It was deemed that the optimal depth for balancing noise suppression and drilling costs was 30 m for the entire array.
Array installation and recording
During the installation phase, a seismic drill was used to reach the designed depth (Figure 2). Sondes were cemented in place, left to dry, then grouted to surface. The stations were surveyed, their components oriented, and then left disconnected until completions startup. The recording units are battery-powered in this area and data is manually retrieved from each location during data collection. The last step prior to recording is calibration. String shots were detonated in the wellbore near the target formation to obtain an initial calibration. Further refinement to this calibration is done using recorded and imaged perforations shots along the full length of the wellbore.
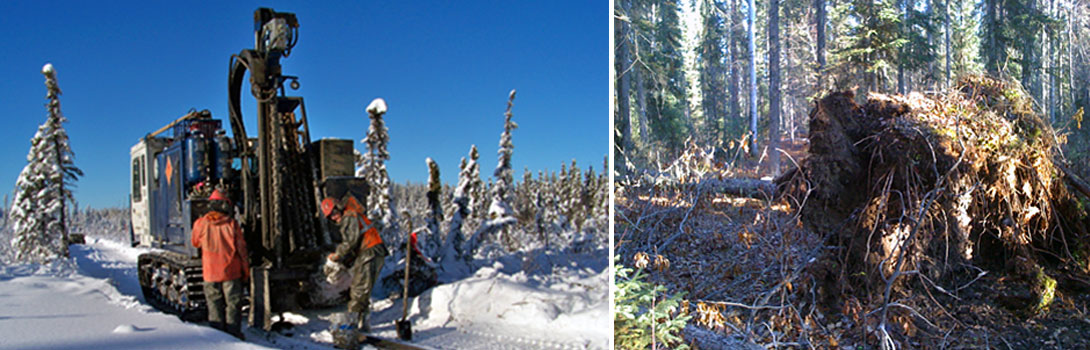
Operational difficulties were encountered during installation and data collection phase. The terrain in this location is densely wooded. Seismic cut- lines that had been cleared months before had not remained accessible and were sometimes blocked by fallen trees and required clearing (Figure 2). Stations installed during winter months were not always accessible due to poor ground conditions in warmer months. This is a problem for data collection but also for medical evacuation. The cold climate in the Horn River Basin area can reduce battery life and require more regular replacement. The rigorous data collection schedule and exposure to cold weather can also affect field personnel over the long duration of the completions program.
Hydraulic fracture monitoring results
The overall program was successful and signal quality was excellent. Data processing resulted in over 70,000 located events. Hypocentral mislocation of imaged perforations measured less than 10 m laterally and 20 m vertically. The results allow for focal mechanism calculation, modeling of a discrete fracture network (DFN), and importantly, completions program optimization (an example of this type of work flow can be found in Detring, 2012).
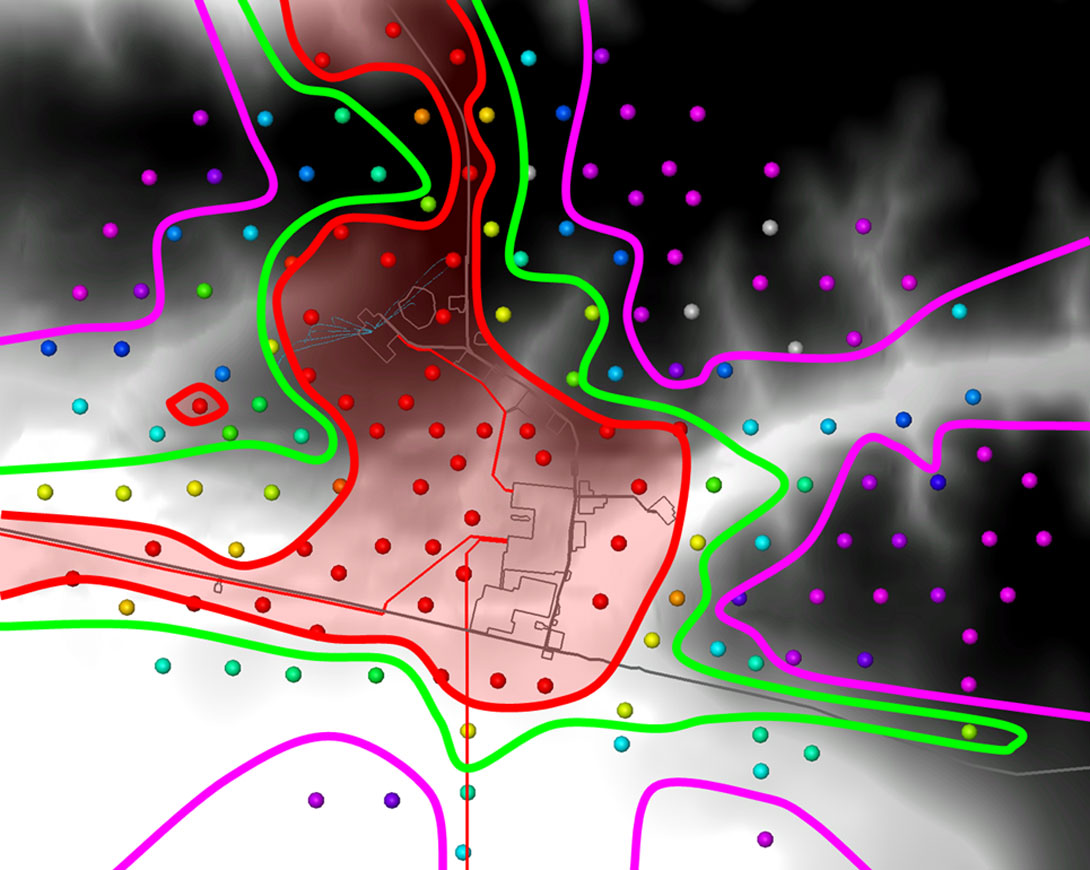
RMS noise levels were measured at each station to identify poorsignal areas (Figure 3). By mapping noise levels at each station, noise sources can be identified and future surveys can be designed to avoid or mitigate noise sources. By far the largest noise sources identified on the 15-D pad are the surface facilities on site, activity at the wellhead and high-traffic roads. The quaternary channels, which were observed to degrade 3D seismic gather quality showed slightly higher RMS noise than areas away from these channels, but noise levels here were much lower than culturally noisy areas, which are still considered to be quiet.
Array decimation test
Reducing the number of stations in an array can result in significant cost savings. Estimates by Taylor (2012) indicate that a 30% reduction in stations can result in 20% cost savings for a program of similar size and duration. Decimation tests can be performed to identify the optimal number of sensors required to adequately monitor a completion program without sacrificing data quality. A decimation test was performed on a subset of 967 events. In this test, stations were removed and the data processed with recordings from the remaining stations. The complete 151-station array was decimated to 100 stations, 30 stations and a sparse 6 stations. As the data is decimated, the signal-to-noise ratio is degraded. This leads to an increase in temporal and positional uncertainty. Located events from the decimated data sets that occur within 10 ms of the full array events are considered to be collocated events.
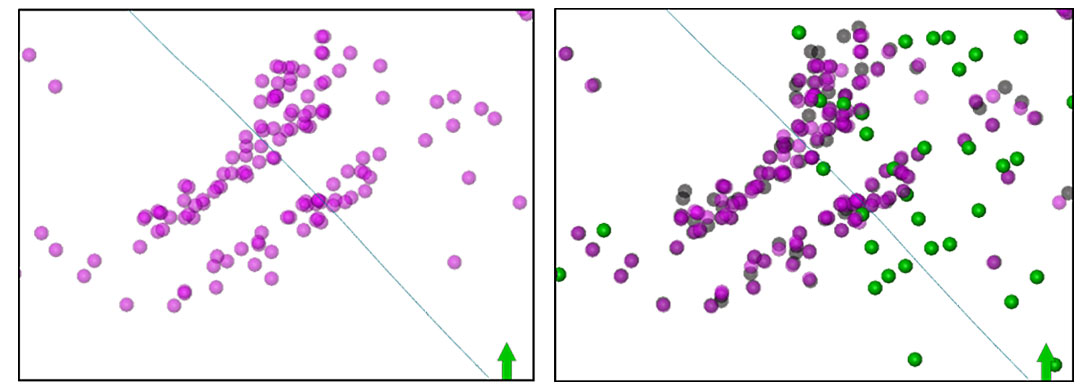
Of the 967 events recorded on the 151-station array, 790 of these were detected by the 100-station array and 307 events were able to be collocated. Events processed with 100 stations were located 10-11 m in X and Y, respectively, and 20 m in Z from the original event. The reduction in stations resulted in a 15% reduction in signal-to-noise ratio. In comparison to the full-array image, fracture trends and lengths are maintained with 100 stations, with many of the events overlapping with the full-array events (Figure 4). Table 1 contains a comparison of all decimation tests.
By decimating the number of stations to 30, the number of events detected dropped to 250, 100 of which were co-located in time but with positional changes of 100 m in X and Y and >160 m in Z. This is attributed to a 50% reduction in signal-to-noise. In the 30-station case, the linear fracture trends and aspect ratios were lost. Stages appeared more cloud-like and had with poor depth control. The 30-station solution limits further analysis, such as fracture aspect ratio measurements, SRV, and makes determining stage overlap and stage spacing evaluation impossible.
| # of MS Events | Collocated Events | ΔX (m) | ΔY (m) | ΔZ (m) | Change in S/N | |
|---|---|---|---|---|---|---|
| Table 1: Comparison of decimation results | ||||||
| 151 Stations | 967 | |||||
| 100 Stations | 790 | 307 | 10 | 11 | 20 | -15% |
| 30 Stations | 250 | 100 | 105 | 102 | 163 | -50% |
| 6 Stations | 412 | 36 | 260 | 192 | 190 | -60% |
Further decimating the array to only 6 stations resulted in more events being detected (412) than the 30-station case, but only 36 of these could be coordinated in time. In this case the majority of the detected events were deemed to be false-triggers. A reduction to so few stations was accompanied by a 60% reduction in signal-tonoise ratio. Changes in event position were also large, on the order of 200 m in X, Y and Z. Co-located events had poor depth constraint and imaged much too shallow with standard processing.
Near-surface array design optimization
The results of the 151-pad were used to refine the design of the subsequent neighbouring pad, 67-D. Because of the proximity of the two pads, a number of the sondes that were installed to monitor the first pad could be reused to monitor the second. The 67-D array design also took into account measured noise levels, noise sources and the decimation results from 15-D.
Based on the array decimation tests, it was deemed that 100 stations were adequate for obtaining the required information for SRV analysis and completions optimization. An array of 98 stations was designed, which utilized 28 stations from the first pad, and added 70 new stations to cover the required monitoring area and maintain approximately the same array aperture as the 151-station array (Figure 5). The reduction in station count and new stations resulted in significant cost savings to the completions program.
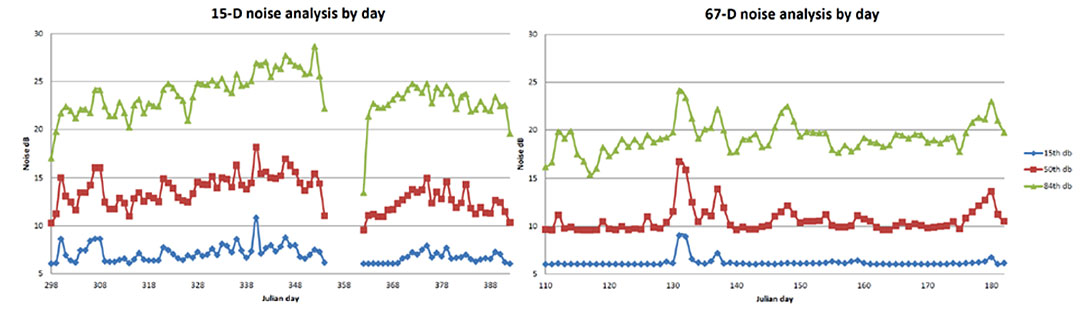
From the measured noise levels it was learned that signal reduction caused by the Quaternary channels was minimal and that cultural noise was more of a concern for the second pad. Without the camp, plant and road which contributed to high noise levels on the 15-D microseismic survey, adjustments to the survey design were not required to mitigate cultural noise on the 67-D array. Indeed, noise results from the second array show a significant decrease in base-level noise (Figure 6) although 15-D noise levels are still considered to be low in this remote location.
Conclusions
Array design is a compromise between data quality, cost and logistical constraints. Reducing the station count is a viable method of reducing costs to a certain point. The difference between processed results from 151 stations and the 100 station decimation test was marginal, leading to a sparser design on the subsequent pad. Using too few stations will result in a decrease in event resolution and detectability. The decimation tests on 15- D show that a sparse, 30-station array produces a low quality result. Signal-to-noise is greatly reduced, resulting in high positional uncertainty which in turn leads to poor fracture imaging and makes SRV calculations and completions program evaluation impossible. The noise environment should also be understood. In the case of the 15-D pad, it was found that cultural noise was more significant than shallow geology in degrading signal but noise levels were still low compared to other surface projects. Finally, array design requires both planning and patience since ground conditions, site conditions and completions schedules can quickly change.

Acknowledgements
The authors acknowledge contributions from Encana Corporation and KOGAS Canada, including Doug Anderson, the asset team and the seismic acquisition team. The authors also acknowledge MicroSeismic, Inc.
Related Reading


Join the Conversation
Interested in starting, or contributing to a conversation about an article or issue of the RECORDER? Join our CSEG LinkedIn Group.
Share This Article