Summary
Seismic-derived elastic properties may be used to help evaluate hydrocarbon production capacity in unconventional plays such as tight or shale gas. By combining prestack seismic and well log data, inversion-based volumes of elastic properties may be produced. Moreover, a petrophysical evaluation and rock physics analysis may be carried out; thus, leading to a spatial distribution of hydrocarbon production capacity. The result obtained is corroborated with the available well information for determining the ability to accurately predict hydrocarbon production capacity.
Introduction
Within the last decade, new technologies such as horizontal drilling and hydraulic fracturing have transformed a paradigm which neglected the potential of unconventional plays to a multi-billion dollar industry. In addition, extracting hydrocarbons from shale oil or gas is accompanied by geoscientific and engineering challenges which are significantly different from the ones associated with conventional resource exploration and production. The use of seismic-derived rock properties to evaluate reservoir quality in unconventional plays has recently become a topic of interest, which stems from the need to use more sophisticated methods to identify high-producing resource plays. In this paper, a tight-gas seismic reservoir characterization (SRC) study is presented where inversion-derived elastic properties have been used to determine hydrocarbon production capacity in the Montney formation, NE British Colombia, Canada. The study begins with prestack, simultaneous inversion for elastic properties, followed by a petrophysical evaluation and rock physics analysis to determine a spatial distribution of hydrocarbon production capacity. Last, the result obtained is corroborated with the available horizontal wells drilled within the survey area.
Methodology
The available dataset for the SRC study includes four seismic partial stacks (8-20, 20-28, 28-35 and 35-45 degrees), three vertical wells, seven horizontal wells, an Ant Tracking cube, seismic horizons and microseismic. A production evaluation for the horizontal wells is split into three zones and is shown in Figure 1. The first zone contains two medium-producing wells. The second zone includes two low-producing wells. The third zone is of high production variability, where three horizontal wells are in close proximity; one low, one medium and one high-producer.
The work carried out in the SRC study has been divided into three main components (Figure 2). The method of inversion used in part one is based on simulated annealing and composed of a globally optimized algorithm which simultaneously inverts a number of angle stacks and their corresponding wavelets. The model parameterization is based on the Aki and Richards (1980) approximation of the Zoeppritz equations.

In part two, a petrophysical evaluation on the three vertical wells available is initially carried out to predict mineral fractions, porosity, total organic carbon (TOC) and hydrocarbon saturation. Next, all wells are split into three categories (high, medium and low) with respect to gas production. The petrophysical logs obtained are used to build a relationship between the elastic response of the subsurface and reservoir production. The relationship is then used to predict a spatial distribution of hydrocarbon production capacity.
The interpretation of results consists of comparing the obtained volume of reservoir quality in terms of hydrocarbon production capacity with the available vertical and horizontal wells. In addition, the well placement strategy focusing on Poisson’s ratio is examined, which has proven to be a successful well-placement strategy. Last, an Ant Tracking volume of seismic discontinuities representing natural fractures and faults is used along with microseismic data to help improve the understanding of the relationship between reservoir quality and seismicderived elastic properties.
Prestack seismic inversion
The use of seismic inversion is central for obtaining a 3D distribution of rock properties. By correlating the seismic and well domains, sparse 1D borehole measurements are extrapolated into 3D space, thereby providing a powerful tool to characterize reservoirs.
The primary inputs into the inversion kernel include the seismic partial stacks, extracted wavelets and a priori models. In the model-based inversion approach, independent wavelets are extracted for each partial angle stack and estimated from the correlation between the well reflectivity and the seismic trace at the well location. Variations in amplitude, frequency, and phase between the different seismic input stacks are captured by the wavelets; so there is no need for scaling, phase rotation, or frequency balancing of the seismic data. The parameters which have the most impact on wavelet quality include the log calibration into the time domain, the method of extraction (amplitude and phase assumptions), the analysis window, and to some degree, the length of the wavelets. If multiple wells exist within the seismic coverage area, a multi-well estimation approach should be used to better capture the lateral variations in acoustic and elastic properties of the subsurface. Moreover, time-varying changes in wavelet frequency due to attenuation must also be corrected for. This attenuation factor may be determined by building an attenuation model derived from the seismic data.
The a priori or low-frequency model (LFM) input data include the calibrated wells, seismic horizons, and dip information obtained from the seismic data (Rasmussen, 1999). The LFM is an integral part of the inversion iteration process and, although its contribution is a small part of a full-bandwidth inversion, its role is crucial. Without a correct background trend, accurate rock property values cannot be obtained in the inversion no matter how precisely the mid-to-high-frequency information is predicted. The structural complexity of the study area and the number of available wells dictate how the LFM is generated, since various methodologies exist for generating such models. If enough spatially well-distributed well data is available, geostatistical methods such as kriging, co-kriging, sequential Gaussian simulation and moving average may be appropriate for extrapolating the low frequencies from the wells using the stacking velocities as a guide. In reservoir characterization studies with limited well information, an extrapolation algorithm where the weight of the extrapolated well log data is inversely proportional to the square of the offset distance from the well is a common practice.
The main inversion outputs in the deterministic approach include volumes of acoustic impedance, Vp/Vs and density. Through algebraic manipulation, other elastic properties (Table 1) are generated for consideration in the seismic petrophysics part of this SRC study.
| Elastic Property | Symbol | |
|---|---|---|
| Table 1. Elastic properties which may be derived algebraically from the standard deterministic inversion outputs of acoustic impedance, Vp/Vs, and density. | ||
| Poisson's Ratio | σ | |
| Static Young's Modulus | E | |
| Bulk Modulus | K | |
| Shear Modulus | G | |
| P-wave Modulus | M | |
| LambdaRho | λ/ρ | |
| MuRho | μ/ρ | |
| LambdaMu | λ/μ | |
| Lame's First Parameter | λ | |
As the inversion estimates the physical properties, the reflection coefficients for each partial stack are calculated and convolved with the appropriate wavelet for comparing the modeled seismic with the measured seismic data. The mid-to-far stack strongly contributes to the estimation of Vp/Vs ratio and density. The high-resolution contribution from the near and mid stacks is used without contradicting the low-frequency information in the far stack. For all input stacks, the application of a separate wavelet ensures that the synthetic seismic for each partial stack has frequency content and phase comparable to that of the measured seismic data.
The objective function of the inversion algorithm for each property Zp may be written as

where:
- Eseismic – Penalty for the differences between the seismic data and the synthetic seismic is accumulated over all partial stacks; related to the signal-to-noise ratio of each seismic angle stack
- Eprior – Penalty for deviation of the estimated layer properties from the LFMs are accumulated over all layer properties; guides the solution towards/against the a priori model
- Ehorizontal – Penalty for horizontal changes are accumulated over all layer properties; controls the horizontal continuity of the results
- Evertical – Penalty for vertical changes are accumulated over all layer properties; controls the threshold for reflection coefficients.
The results obtained from the inversion match nicely with the measured logs (Figure 3). This goes for all wells used in the inversion process. Such achievement gives a high level of confidence in the post-inversion work subsequently carried out.

Seismic petrophysics
Tight gas reservoirs are associated with a high degree of both lateral and vertical heterogeneity, low matrix porosity and low permeability (Boyer et al., 2006). In order to determine a proper understanding of the reservoir, a simultaneous global error minimization solver is used to perform the petrophysical analysis. Using standard triple combo logs, core data and available cuttings descriptions, we determine mineralogy, TOC, porosity and hydrocarbon saturation over the upper and lower Montney formation. The mineralogy consists of a mix of clay, quartz, silt, carbonates, heavy minerals and kerogen. Quartz volume shows a high correlation with porosity and is believed to be a key driver in determining reservoir quality in the Montney formation.
Subsequently, a production classification is carried out where all wells are split into three categories (high, medium and low) with respect to gas production. The classification is based on a 30-day average, initial production (IP) rate, where a medium producer falls within 3 to 5 MMCF/day. A good correlation is observed between 30-day IP averages versus the long term production of the well. Moreover, production rates are normalized to the lateral length of the horizontal wells.
A comparison between petrophysical properties and production reveals that effective porosity, effective water saturation, and clay volume best correlate with production. In an attempt to represent the three production classifications in terms of petrophysical properties, cut-offs are applied to these petrophysical logs. Although all three affect reservoir quality, clay volume also influences the ability to effectively induce fractures in the formation.
Next, an n-dimensional probability density function (PDF) is established from a cluster analysis on the log data as a representation of the variability in the formation properties. The methodology used to establish probability density functions for solving rock physics classification problems uses Bayesian decision theory (Duda et al., 2000). The theorem allows for expressing the probability of a particular class given an observed x using Bayes’ theorem as

where P (x, Cj) is the joint probability of x and Cj, P (x | Cj) denotes the conditional probability of x given Cj (Avseth et al., 2005). In order to establish a class x (i.e., high producer, medium producer, low producer), a rock diagnostic is performed where, using the available well log data, a set of crossplots is generated utilizing the inversion output attributes (i.e., acoustic impedance, Poisson’s ratio, density, etc.) and petrophysical properties. The objective is to determine which seismic-derived elastic properties best separate out the desired classes in the crossplot analysis.
Figure 4 shows the 2D PDF obtained from the analysis, where Lambda/Mu and density are used to predict the reservoir’s hydrocarbon production capacity. &Lambda/ Mu (λ / μ) may be derived from Poisson’s ratio σ using the equation

where

The incompressibility term Lambda λ represents Lame’s coefficient and Mu μ is the ratio of shear stress to shear strain, also termed rigidity or shear modulus. Lambda/Mu in rocks behaves similarly to Poisson’s ratio, although for a change in Poisson ratio, the numerator increases as twice the σ change while the denominator is reduced by 1-2σ, thereby enhancing the λ / μ change to a maximal asymptotic approach for σ = 0.5, where λ / μ is infinite (Goodway, 2001).
Last, the generated probability density function is applied to the selected seismic-derived elastic property output cubes to produce a spatial distribution of the reservoir’s capacity to produce hydrocarbons. At each sample, there is an associated probability which represents the likelihood of each class defined, based on the cross plot analysis explained above. Several examples as well as a more comprehensive explanation of Bayesian statistics is given in Avseth et al. (2005), Bachrach et al. (2004), and Sengupta and Bachrach (2007).

Interpretation
Although every unconventional play is unique, the key properties governing production potential generally include porosity, TOC, stiffness, natural fractures and closure stress (Ouenes, 2012). Moreover, current drilling decisions in this field have been highly influenced by targeting zones of low Poisson’s ratio (PR). This strategy has proved useful in many cases, but not always. We hypothesize that seismic-derived elastic properties and Ant Tracking together with microseismic data can provide an understanding to hydrocarbon-production capacity leading to more successful drilling decisions than ever before. Microseismic monitoring of hydraulic fracturing treatment in tight gas reservoirs can provide useful information about the results and the level of success of the rock fracturing. For example, the length of the generated fractures and the geometry of the induced fracture system may be determined using mapped hypocentral locations. In a naturally fractured reservoir, hydraulic treatments may reactivate natural fracture systems and locally enhance permeability.
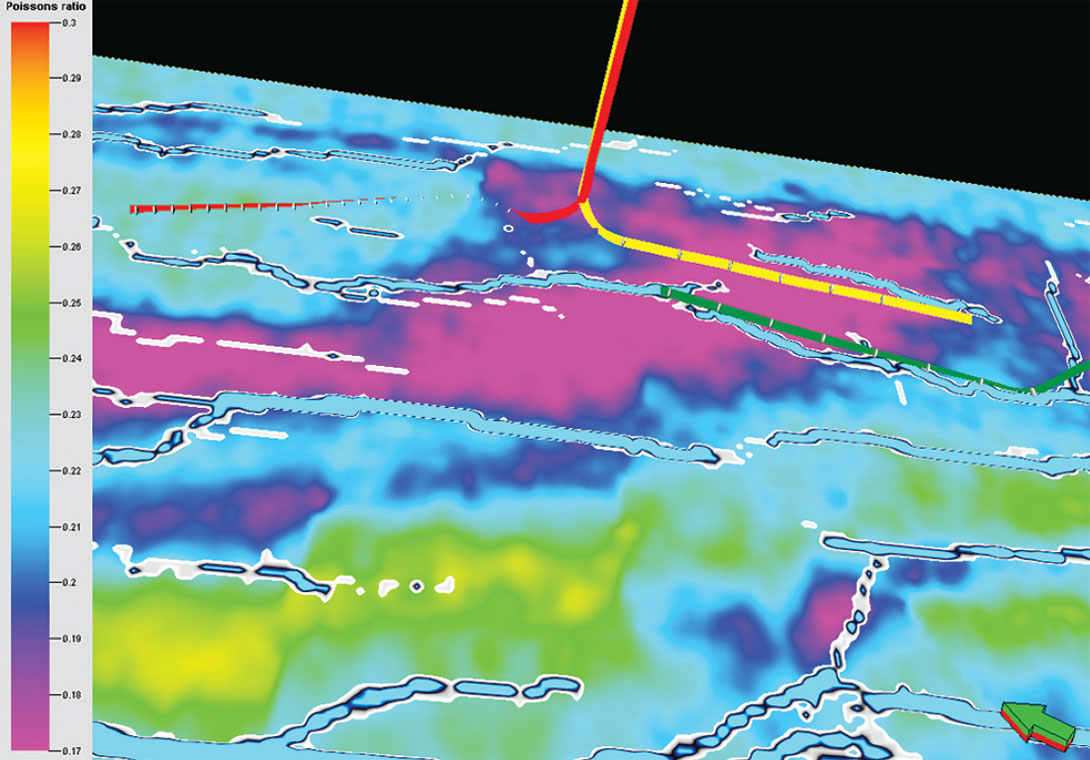
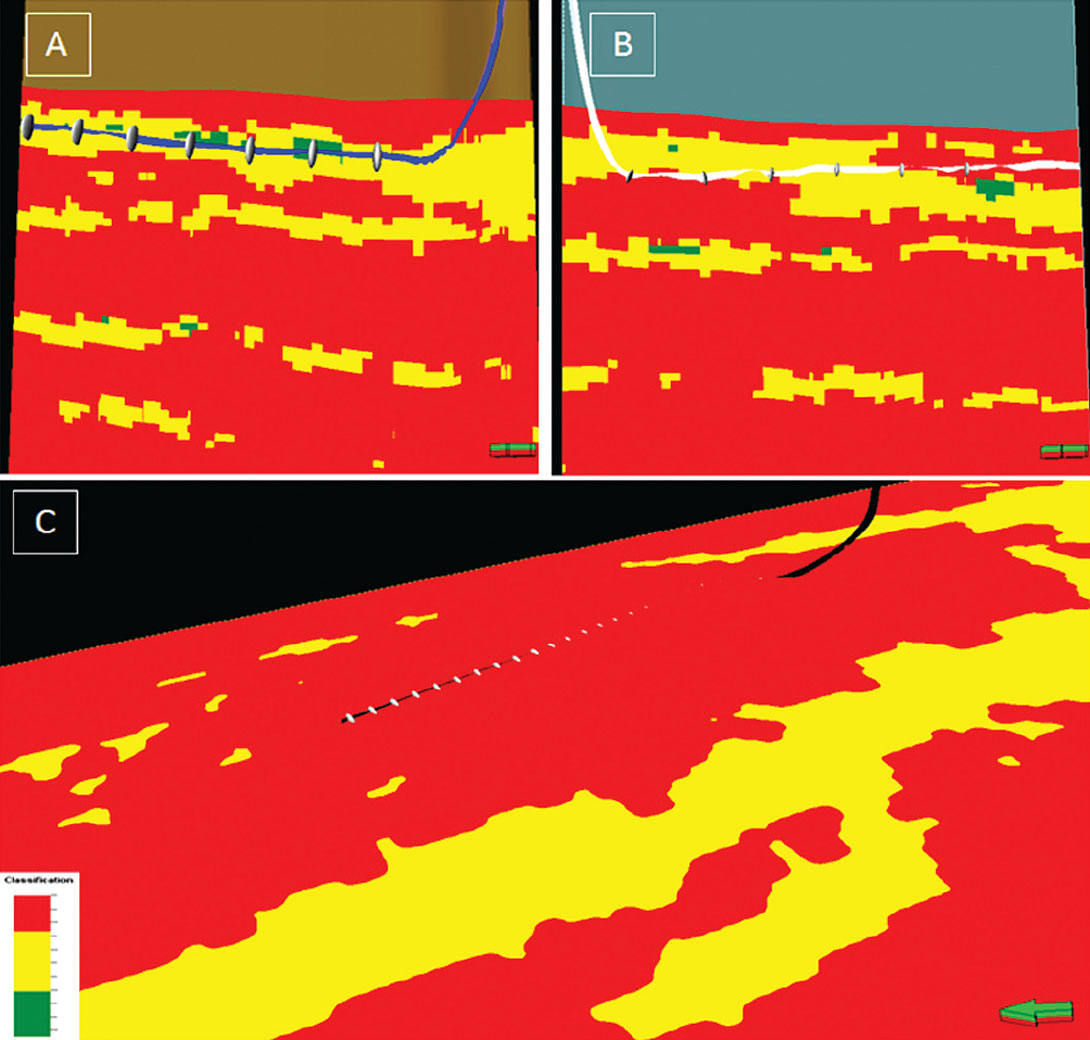
The color scheme used in the resulting hydrocarbon production capacity (HPC) volume follows a traffic-light approach where green corresponds to expected high production, yellow to medium and red to low. Figure 5 shows a depth slice comparison between the HPC volume and Poisson’s ratio, where two medium-producing horizontal wells are located. The zone is dominated by relatively low PR, which has highly influenced drilling decisions to date. The HPC volume is predominantly yellow, indicating the expected production from a well drilled in this zone is medium. Figure 6 adds the detected microseismic events as well as an expected stimulation volume (ESV). The majority of microseisms are clustered within a zone where 3 to 5 MMCF/day production is expected. The ESV uses microseismic event density to compute the volume, where the data is normalized by magnitude to compensate for distance effects. This is a qualitative indicator of reservoir contact, possibly correlating to the distribution of fracturing fluids within the fractures. Moreover, it gives an indication of fluidaffected volumes compared to fracture extraction using planar geometry.
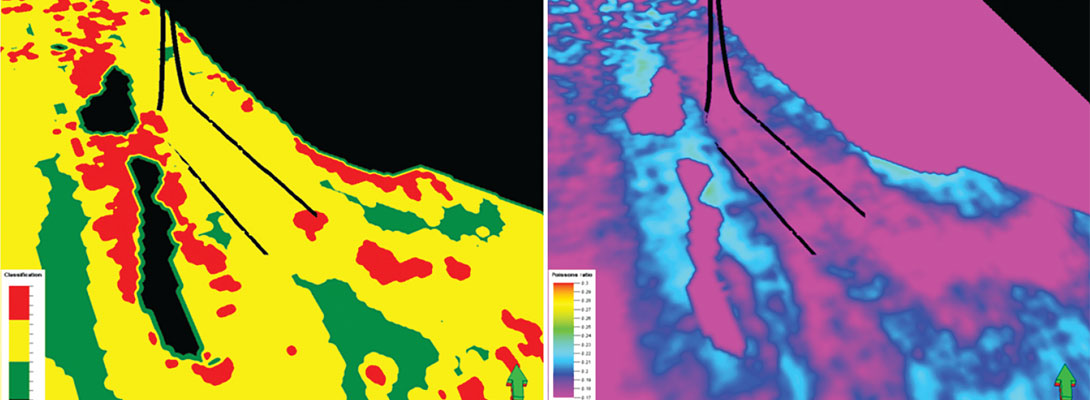
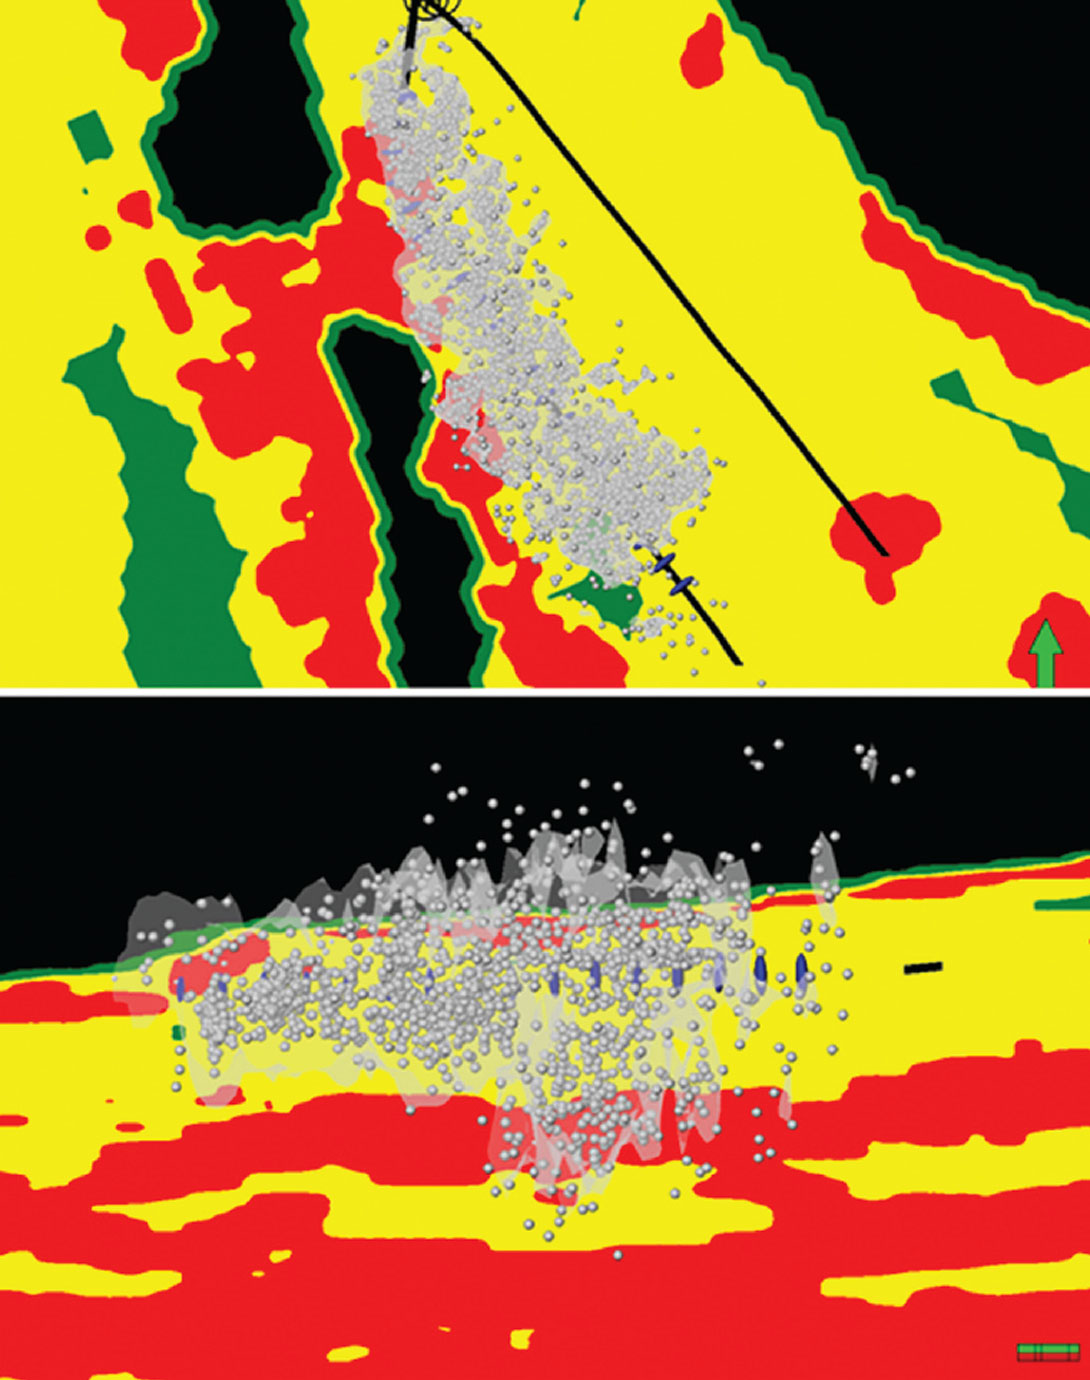
Figure 7 shows an arbitrary line comparison between PR and HPC where two neighboring, low-producing horizontal wells exist. Both wells were targeted based on PR. The hydrocarbon production capacity cube accurately predicts low production from these wells. Figure 8 shows the result at a slightly deviated well with a single perforation. The low production from this well is nicely predicted by the hydrocarbon production capacity cube.
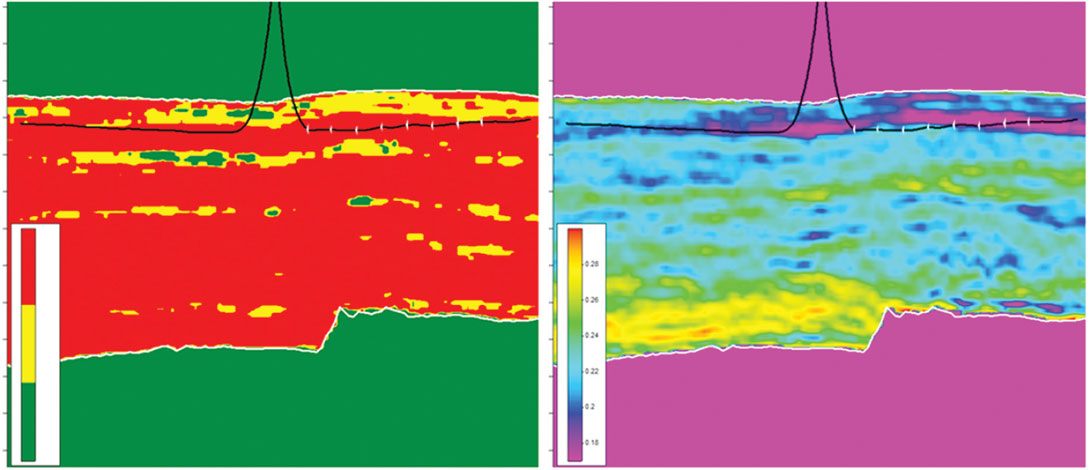
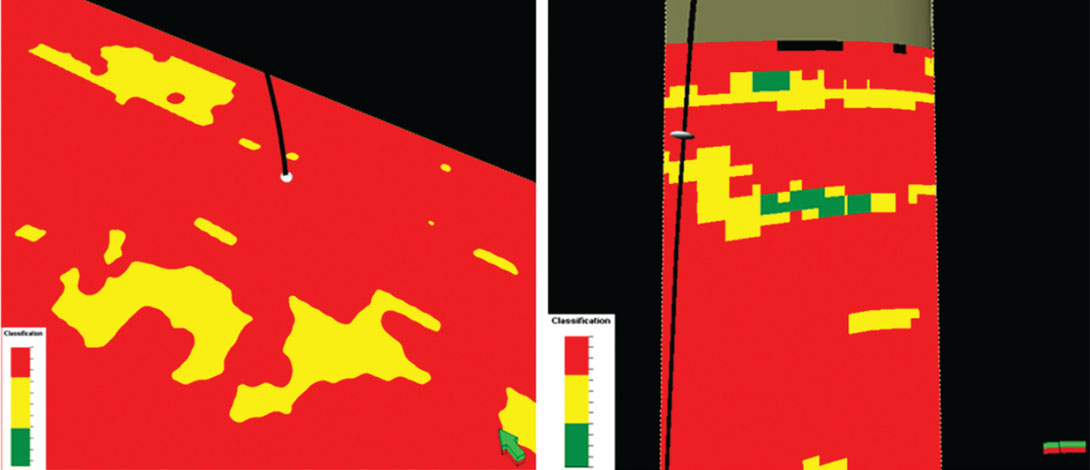
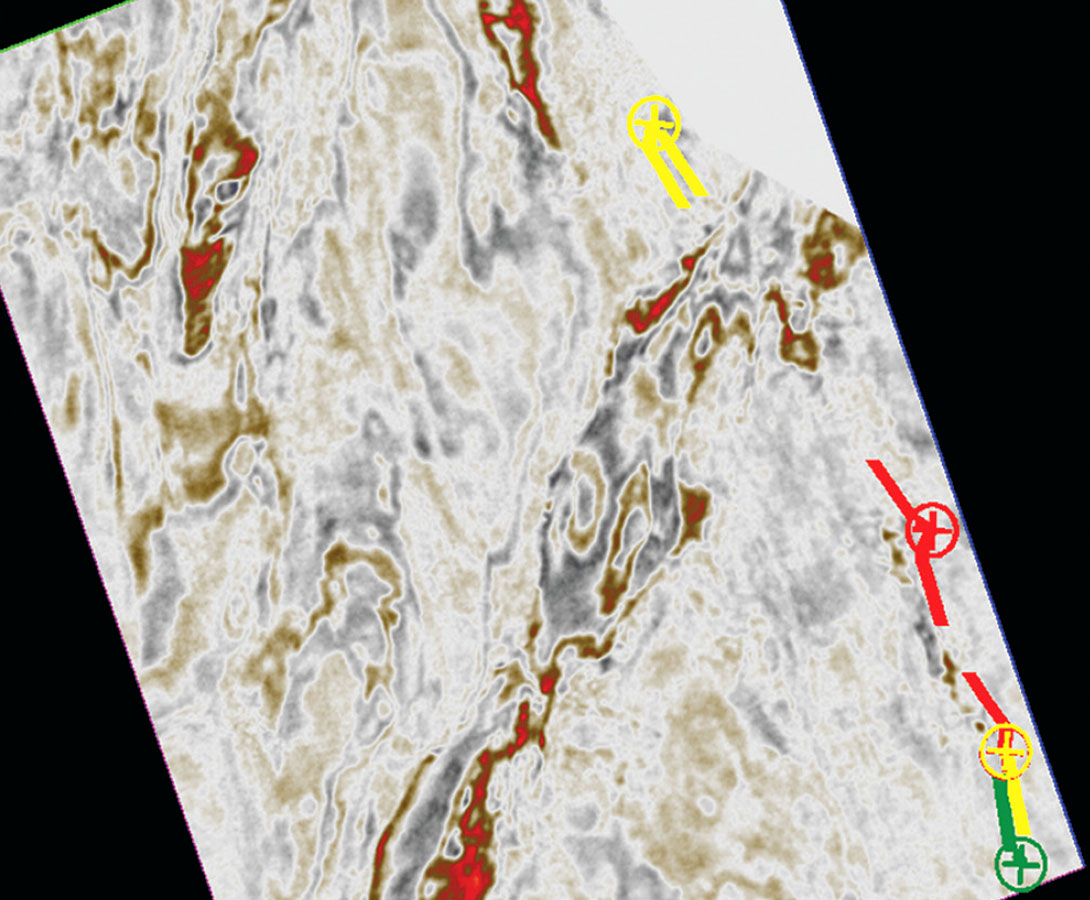
Figure 9 shows a PR overlaid with an Ant Tracking depth slice in the zone of high production variability, where three horizontal wells—a high producer, a medium producer and a low producer—are within close proximity. The high producer was drilled along a pre-existing natural fault or fracture, which potentially contributed to higher production than the adjacent medium producer. The result from the hydrocarbon production capacity cube (Figures 10a and 10b) shows that both wells fall within a zone where 3 to 5 MMCF/day production is expected. Moreover, Figure 10c shows a depth slice corresponding to the low producer in this zone of high production variability. The HPC volume prediction at this well matches nicely with the observed well production of less than 3.0 MMCF/day.
The results obtained demonstrate that seismic-derived elastic properties can be used for predicting hydrocarbon production capacity successfully. Including all wells within the area of study (a total of 27 vertical and horizontal wells), a predictability of ~70% is observed. An area for improvement in our method includes enhancing the ability to distinguish between medium and high production. This inconsistency in production estimation may be due to the lack of separation between the high and medium production classes for λ / μ in the probability density function. We hypothesize that our current measure of predictability may be improved further by modifying the cut-offs used for creating the three classes or the addition of quartz volume into the reservoir classification. This being true, we believe our results so far may be used for avoiding low-producing zones with a high degree of confidence.
Acknowledgements
Our gratitude goes to Progress Energy Corporation for permission to publish the paper. Also, we thank Joe Leonard and Wayne Hovdebo from Progress Energy Corporation for their contribution to the project. From Schlumberger, we thank Aramis Martinez, Tim Osburg, Ali Mukati, Innocent Kalu, James Johnson and Dave Paddock for their respective roles in the work carried out.

Related Reading


Join the Conversation
Interested in starting, or contributing to a conversation about an article or issue of the RECORDER? Join our CSEG LinkedIn Group.
Share This Article