Seismic waves propagating through cyclical thin beds, which have a large acoustic impedance (AI) contrast to the surrounding sedimentary sequence, have distinct wavelet signatures. At depth, the wavelets have a low-frequency Gaussian-shaped signal followed by high-frequency noise coda. These complex wavelets often yield seismic with discontinuous primary reflections that have apparent time delays along with long-period internal multiples. To assist in the interpretation process, the frequency bandwidth is decreased until the primary-only synthetics correlate to primary-plus-multiple synthetics. Then, applying this low-pass filter to both the seismic and the multiple synthetic suppresses the noise coda and improves the seismic match. However, the frequency reduction is not desirable so in the time-frequency domain the high signal-to-noise low frequency is extended to higher frequencies. These principles are part of an interpretation workflow applied in the Hassi D’Zabat Field, which has both short- and long-period multiples.
Introduction
Seismic data processing techniques for multiple suppression are normally classified as surface related or internal. In land processing, internal multiples are subdivided into short- or long-period internal multiples; short period, if the multiple time interval is less than a wavelet period, otherwise long. Short-period internal multiples are called stratigraphic filtering (Shapiro and Hubral, 1999) since they depend strongly on the oscillations of the acoustic impedance in the sedimentary sequence. Large impedance variations in a cyclical sedimentary sequence result in severe stratigraphic filtering (SF) effects.
O’Doherty and Anstey (1971) noted that propagating wavelets in severe SF areas had a broad initial pulse followed by a longer noise coda. In areas with less severe SF (smaller reflection coefficients), Verschuur (2006) noted that the broad initial wavelet could be compressed with deconvolution or inverse Q-filtering. However, these processes are questionable if the reflection coefficient in cyclical sedimentation is large, such as in the Permian coal beds of Cooper Basin (Australia) or in the anhydrite layers of Hassi D’Zabat Field (Algeria) where the magnitude of the reflection coefficient is greater than 0.5.
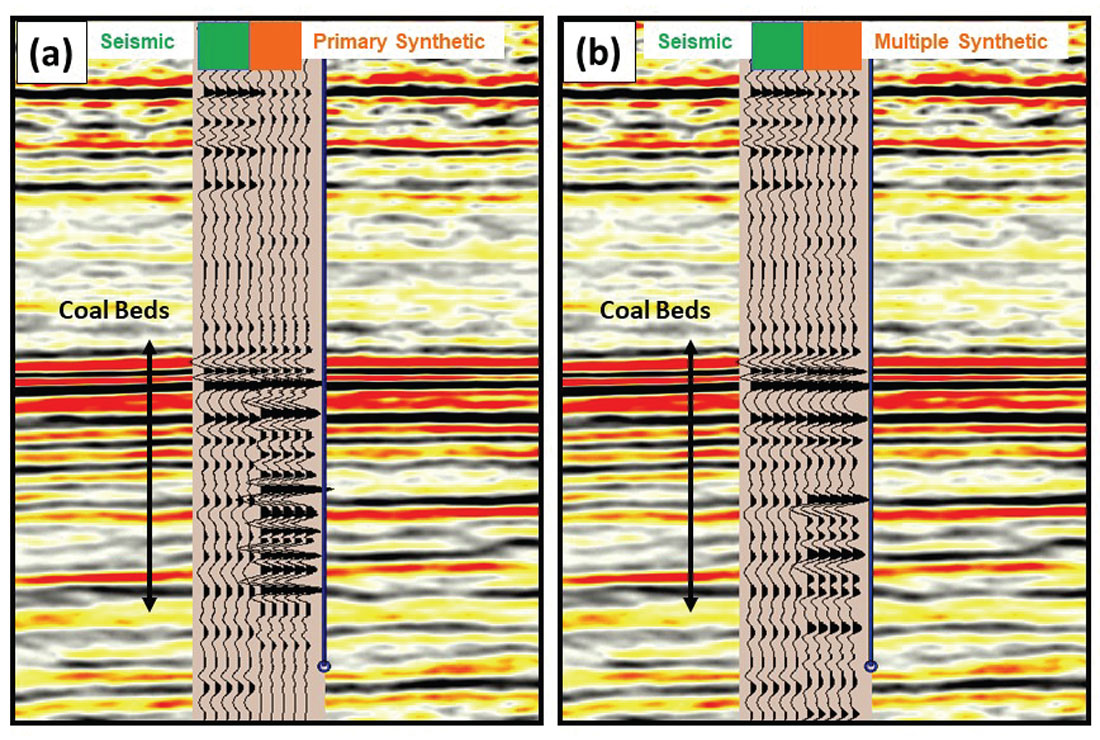
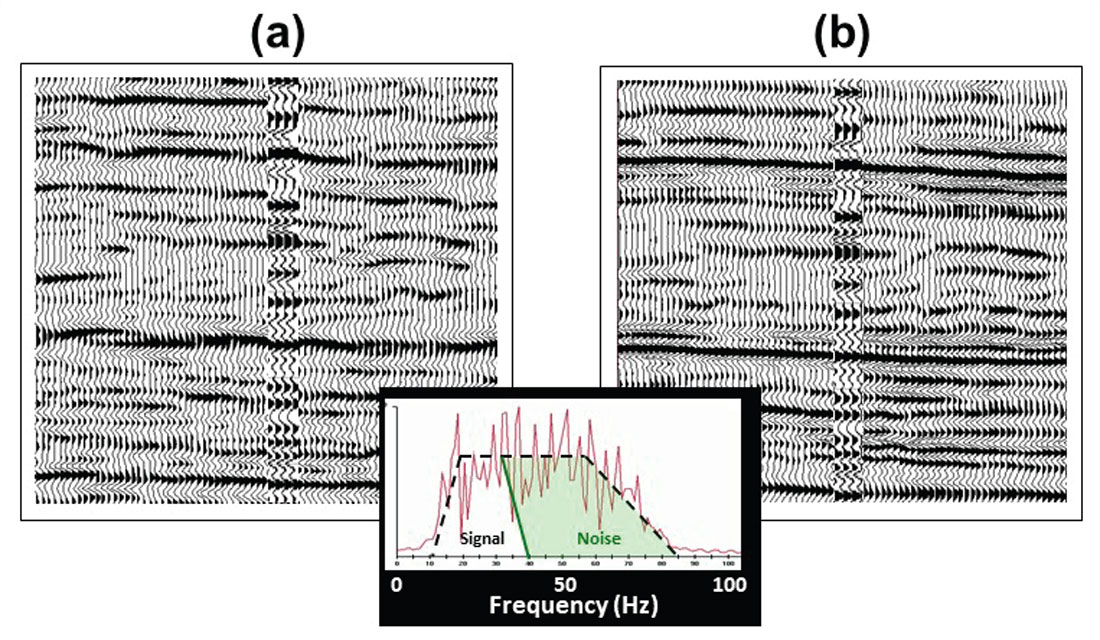
As an example of SF, a pre-stack migrated section from a study by Qi and Hilterman (2014) is compared to a primary-only synthetic seismogram in Figure 1a. The synthetic was time aligned to the top of the Permian coal beds and was generated with a wavelet extracted from the top of the coal beds. Sand and shale sediments encase more than 40 coal beds. The normal-incident reflection magnitude off the sand (or shale) to coal interface is approximately 0.60. In Figure 1a, one would be tempted to stretch the primary synthetic to obtain a better match to the seismic. However, by generating a synthetic that contains both primary and multiple events, a good synthetic match in the coal bed interval is obtained as depicted in Figure 1b. Qi (2016) noted that if the noise coda train in the propagating synthetic wavelet is restricted to less than 300 ms, the multiple synthetic match begins to deteriorate. This indicates that the seismic has remnants of the noise coda in the propagating wavelet.
If SF is severe, we will show that its effects are reduced by low-pass filtering so that the recognition of long-period multiples improves. For interpretation purposes, the seismic high-frequency content is restored in the time-frequency domain to assist in fault identification and to increase event continuity. These principles are illustrated with field data from Algeria.
Study Area
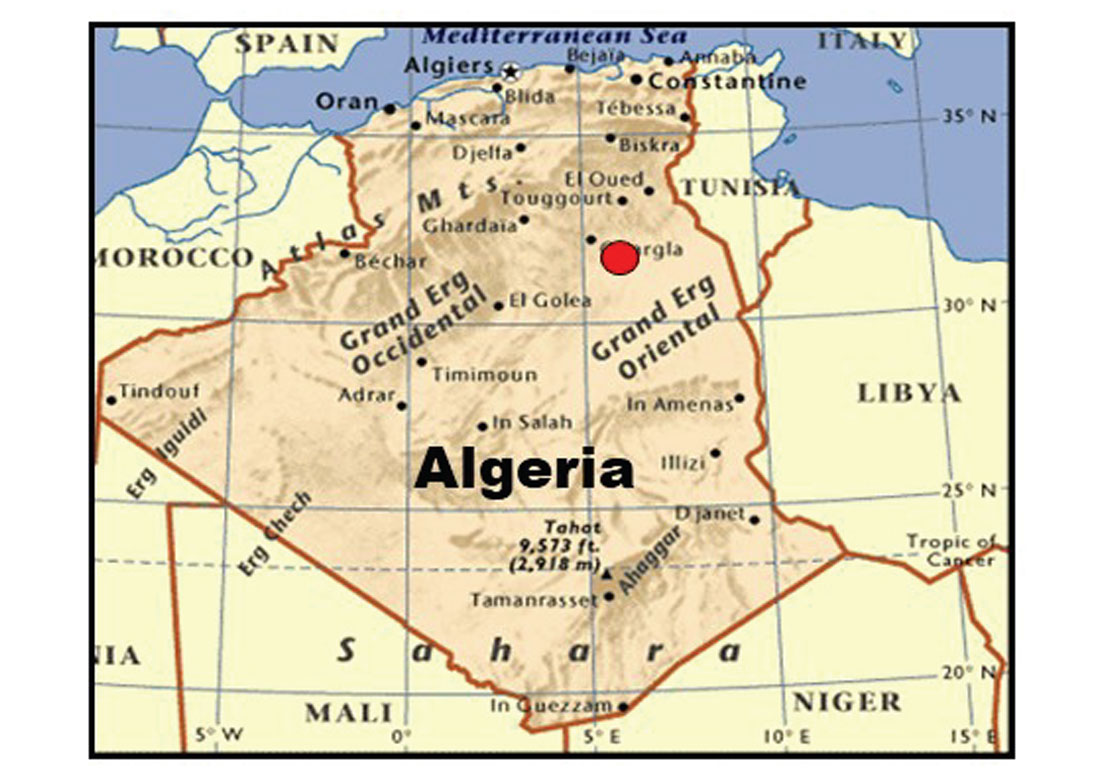
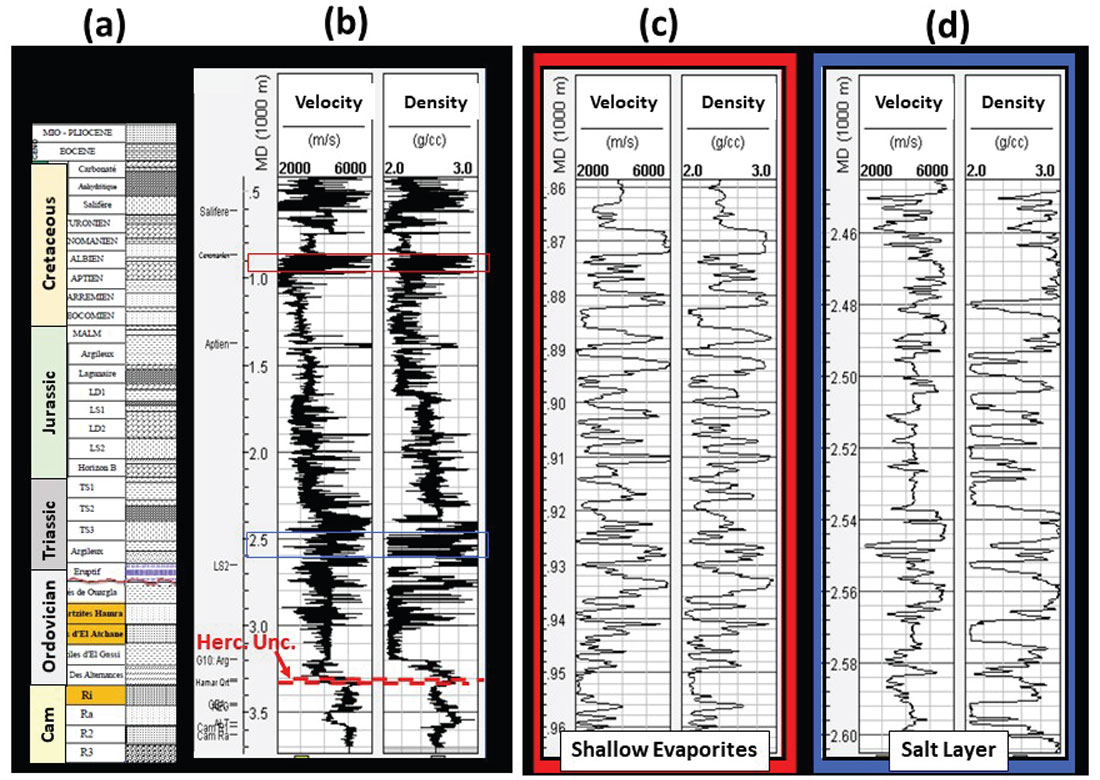
The Algerian study area (Figure 2) was in the Hassi D’Zabat Field that is south-east of the giant Hassi Messaoud Field, which is south of the Atlas Range on the North African craton. In the study area, two sedimentary sequences are separated by the Hercynian unconformity (red line in Figure 3a). Two major flooding events, one in the Silurian and the other in the Late Devonian, were responsible for the deposition of source rocks. Two cyclical high-impedance contrast sedimentary units overlie the reservoir, the Cretaceous evaporites and the Triassic salt layer. The reflection coefficient from interfaces in the evaporite sequence can exceed 0.5 and have a two-way high-frequency transmission loss less than 10-6. The main target is the Ordovician formation (Quartize Hamra), which is beneath both of the multiple generating sequences.
3D seismic was acquired using Vibroseis with a nominal coverage of 90-fold. The seismic data quality in Figure 4 is fair in terms of the continuity of seismic markers and fault definition down to the top of the Triassic salt layer; below the salt layer, the seismic quality deteriorates. We associate the deterioration as a consequence of not separating the signal portion of the propagating wavelet from noise during processing.
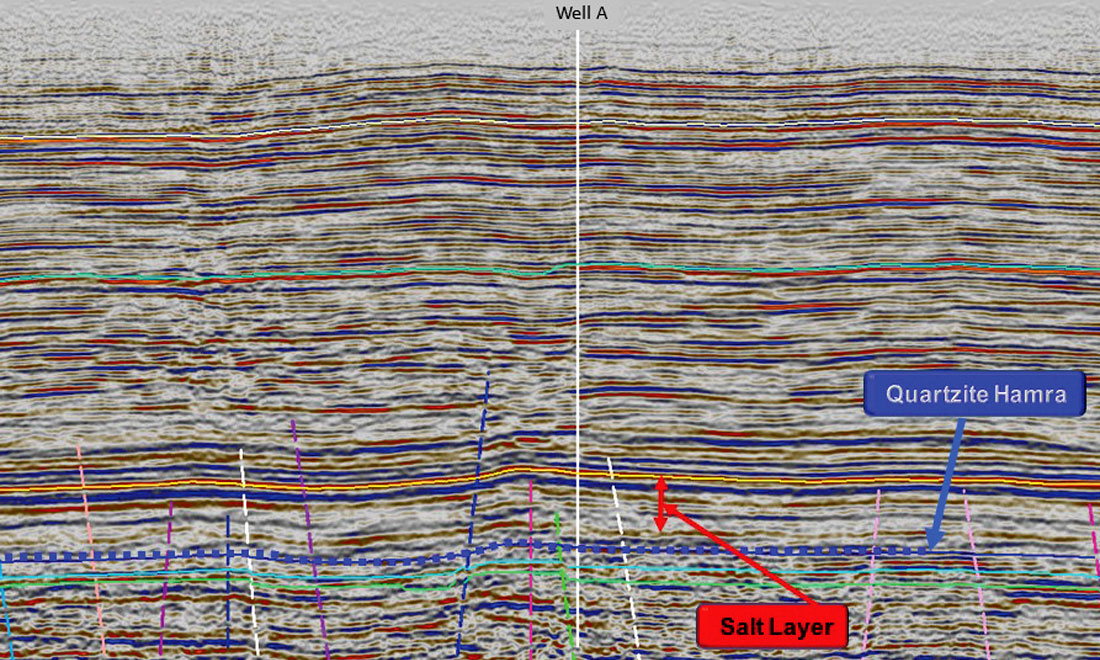
Interpretation problems, which are mainly associated with the Paleozoic section beneath the salt, are evident in Figure 4. The near-vertical faults beneath the salt were color-coded by the interpreter to help clarify the complex fault patterns in the 3D survey. The interpreters identify the problems as
- Poor fault definition,
- Poor event continuity,
- Low dominant frequency,
- Well mis-ties of ≈100 m, and
- Questionable amplitude and phase preservation.
Multiple properties
The classic 1D earth model was presented by Goupillaud (1961) to account for all primary and multiple paths for plane-wave normal incidence. O’Doherty and Anstey (1971) described the plane-wave transmission of a source spike through a single thin bed as a time series with relative weights of 1, rc2, rc4, … This transmitted time series is convolved with similar time series as the source continues through numerous thin beds. As the reflection coefficient (rc) magnitude increases, the transmitted wavelet becomes more bell shaped. When the transmitted wavelet reaches the surface, it is called a two-way transmitted wavelet, or also known as a generalized wavelet (Shapiro and Hubral, 1999). A time-varying convolution of the two-way transmitted wavelets, one for each time sample, with the primary reflectivity yields a multiple synthetic such as the one shown in Figure 1b.
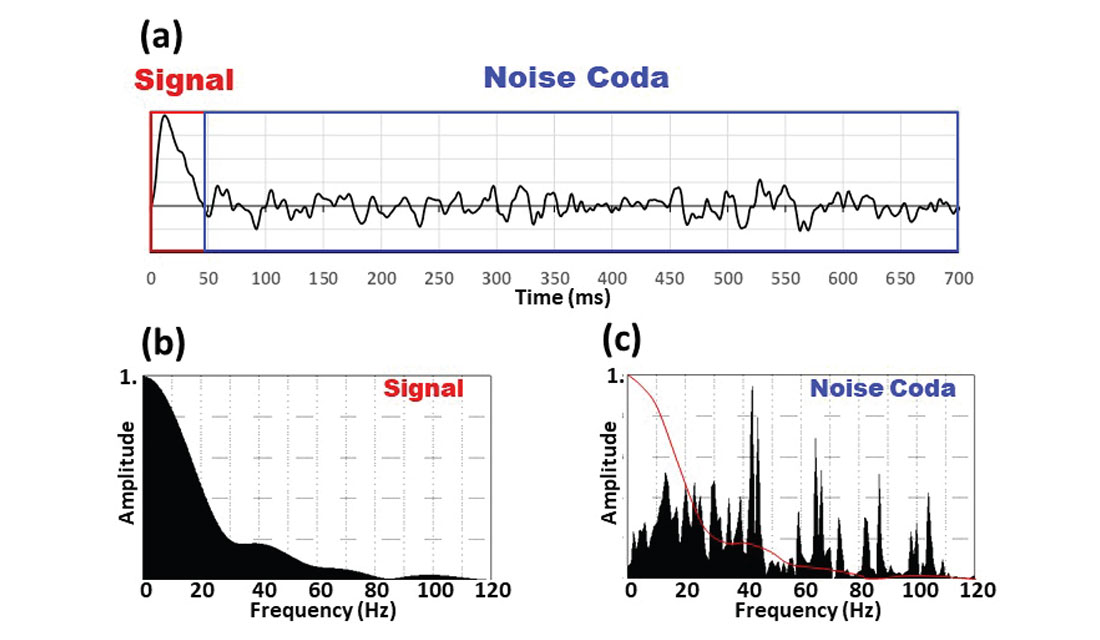
In the study area, the two-way transmitted wavelet that reflects off the Quartize Hamra reservoir (see Figure 4) is shown in Figure 5a. The source was a spike. The transmitted wavelet is composed of a Signal portion that reflects off boundaries followed by a Noise Coda containing long-period multiples. In Figure 5b, the signal spectrum resembles that of a Gaussian wavelet while the noise coda (Figure 5c) has spectral components at higher frequencies that have significant amplitude. Spectral whitening processes designed to increase the signal amplitude for frequencies above 20 Hz will also detrimentally increase the noise coda.
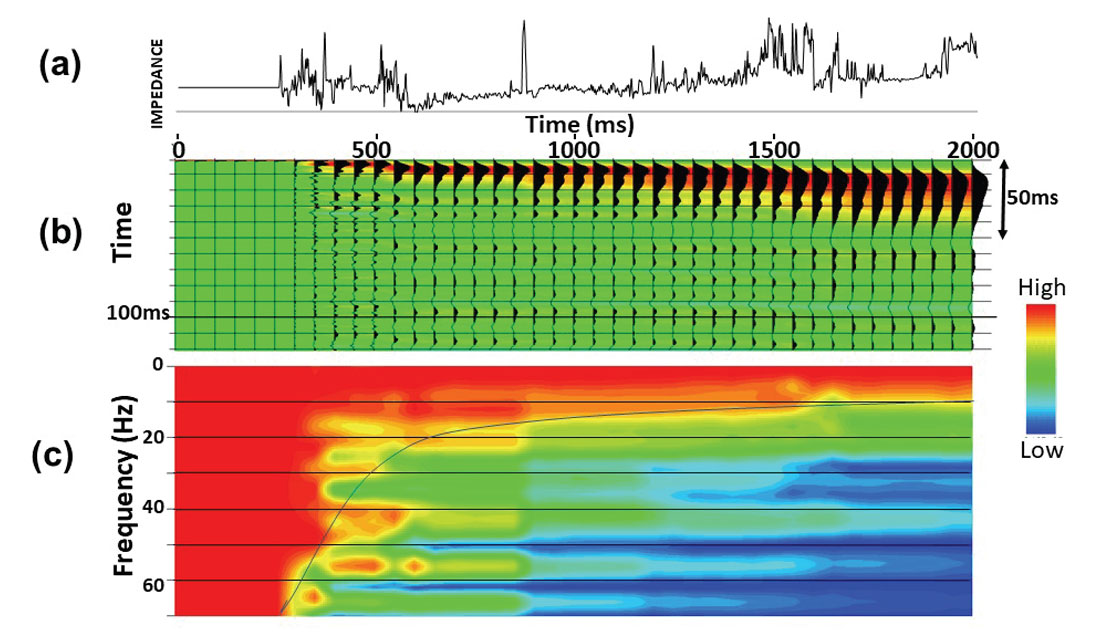
At every time sample, two-wave transmitted wavelets are computed and taken together they constitute a wavelet dictionary for the synthetic (Qi, 2016). A portion of the wavelet dictionary for this well is displayed in Figure 6 from the surface to the bottom of the well in steps of 50 ms. The impedance log is displayed as a function of time in Figure 6a. After the start of well logging in Figure 6b, the wavelet continuously broadens as high impedance contrast interfaces are traversed. At TD (right side of Figure 6b), the signal portion of the transmitted wavelet has positive values for the first 50 ms and then the noise coda begins. The spectra based on the first 120 ms of each transmitted wavelet are displayed beneath each wavelet in Figure 6c. There is a rapid loss of high frequency in the wavelets as they propagate deeper.
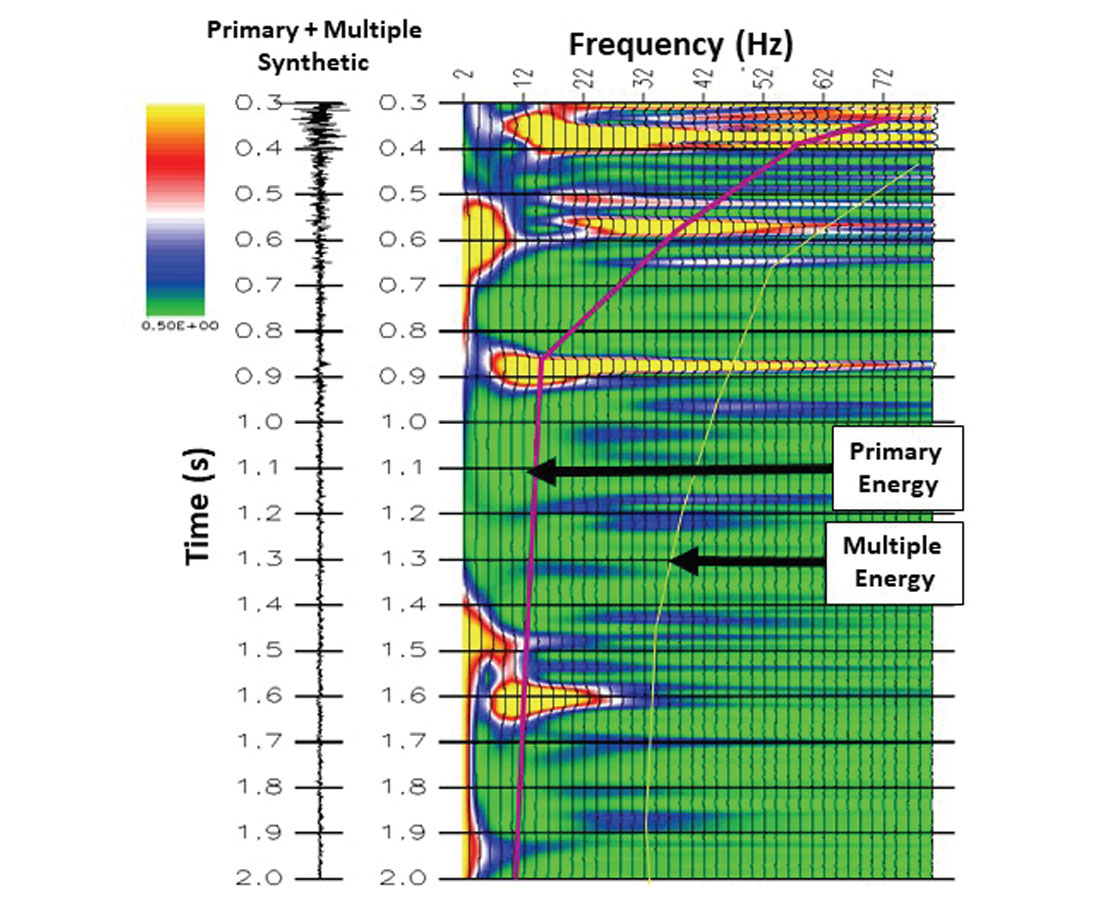
An interesting way to examine the high-frequency loss with depth (or two-way time) for the multiple synthetic is by looking at the time-frequency domain (Figure 7). In this figure, the blue clusters in the higher frequency range relate to a trend curve representing the noise coda on the synthetic while the primaries are shown as yellow clusters. To separate the noise from the signal, a low-pass time-varying filter whose spectra is defined between the two trends is applied.
Well-tie interpretation
Normally, before synthetic seismograms are generated, pseudo density and sonic curves are generated and compared to the measured well-log curves as a quality control step, especially in thin-bed intervals. Then the time-depth relationship of the sonic curve is corrected with VSP surveys and finally Backus averaging is applied. An interesting side note is that in severe SF areas, check-shot corrections based on zero-offset VSPs are avoided because the delay between the integrated sonic values and the VSP time arrivals are very close to the delay due to SF and not intrinsic attenuation. Synthetics with multiples will have the SF delay, therefore the additional delay from VSP corrections does not need to be applied. Margrave (2015) compared quantitative measurements of delays due to SF and intrinsic attenuation and found that SF Q (seismic quality factor) delays more than intrinsic Q. In addition, we found that correlations of multiple synthetics to seismic deteriorate when Backus averaging is applied in severe SF areas. Backus averaging reduces the reflection coefficients whose magnitude is an essential component of the SF delay. In short, we found that no check-shot or VSP time-depth corrections are normally needed with current logging technology. After aligning the synthetic to seismic at the top of logging, additional stretch is normally not needed for multiple synthetics.
Two different Ormsby filters were applied to the synthetics in Figure 8: 4-8-35-70 Hz and 4-8-15-25 Hz. Primary (P) and multiple synthetics (M) were generated for both frequency ranges. The P and M synthetics for the lower frequency passband (Figure 8c) are a close match to each other except the M synthetic is slightly delayed with respect to the P synthetic and the M synthetic has a distinguishable long-period multiple at the bottom, which is below the targeted Quartize Hamra reservoir. In short, when the SF noise coda is suppressed, the target interval is relatively free of internal multiples. Identification of long-period internal multiple generators in severe SF areas has been discussed by Hilterman, et al. (2017).
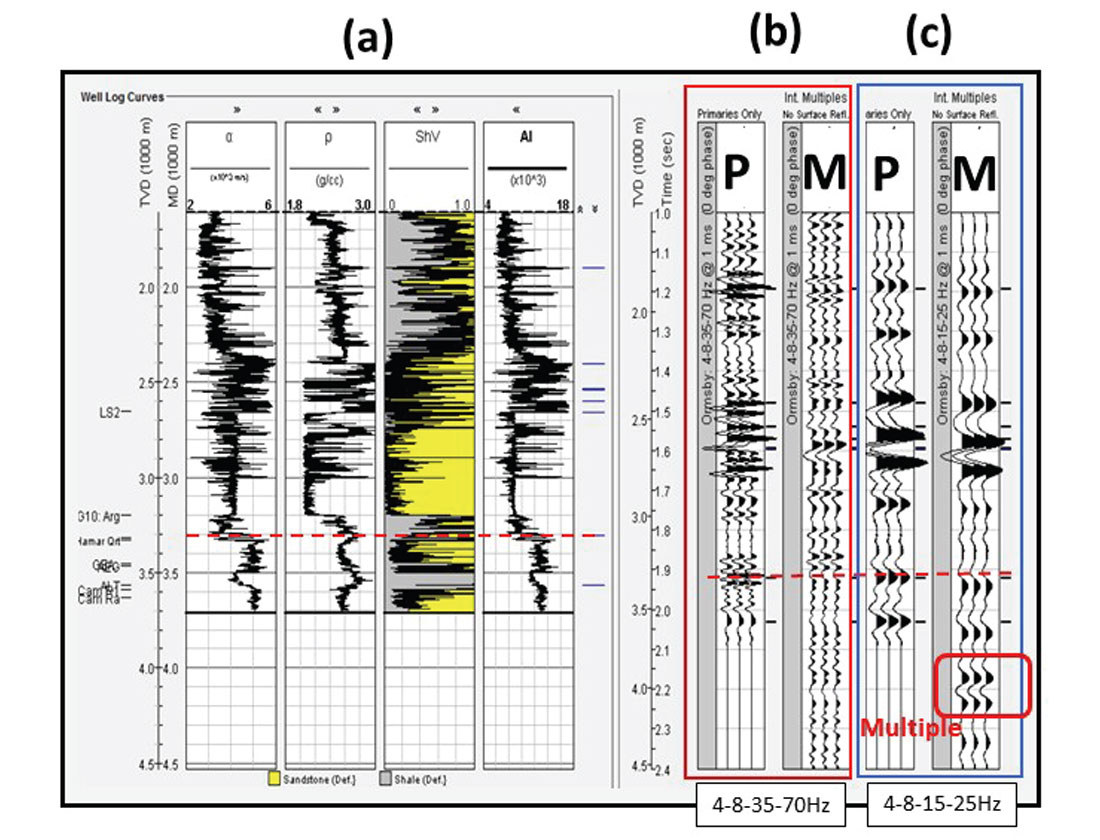
For the slightly higher frequency passband (Figure 8b), any correlation between the P and M synthetics is difficult to visualize because SF is still present in the Figure 8b M synthetic. The top of the reservoir sand, which is annotated with a red horizontal line in the figure, has a seismic response that is evident on all synthetics except for the high-frequency M synthetic (Figure 8b), which unfortunately is representative of conventional seismic data in the area.
Low-frequency passbands reduce the effect of the SF noise coda in the multiple synthetics as well as in the seismic data. With the high-frequency noise coda suppressed, we found that inverse scattering series ISS multiple suppression was more effective as the long-period multiples were more evident. However, a loss of vertical resolution is not an acceptable option for most interpretation projects and some compromise is required.
Frequency restoration
The pre-stack migrated time section (PSTM) in Figure 9a contains shallow events above the Triassic salt layer. While the seismic quality is fair, there is a question if a structural attribute section that’s based on the frequency dependent S/N found in Figure 5a would improve the event continuity.
The spectral average for the entire window in Figure 9a is shown as the red line in the bottom plot and its trapezoidal estimate is shown by the dashed black line. Based on the amplitude spectrum in Figure 5a, the “signal band” was identified as the lower trapezoidal white area in the spectrum (Figure 9) and subsequently the PSTM data in Figure 9a was filtered back to this signal band. The green area in the spectrum is considered SF noise. Rather than losing the high frequency entirely, the low-frequency signal portion, which has a high S/N, is extended to fill the green area in the spectrum resulting in the Figure 9b seismic section. Basically, the sections in Figure 9a and 9b have the same amplitude spectrum but different phase spectra. The Structural Attribute section in Figure 9b has better event continuity resulting from single-trace processing and not a multi-trace coherency process. This time-varying single-trace process addresses one of the objectives for the area; that is, increase the quality of event continuity.
Another objective was to improve the fault definition beneath the Triassic salt. A PSTM section containing the deeper events is shown in Figure 10a. The spectrum for this section is the red curve in the lower plot. Like the results shown in Figure 9, the spectrum was first reduced in Step 1 to the higher S/N low-frequency components of the two-way transmitted wavelets and then expanded to higher frequencies (Step 2) based on the low-frequency Signal portion. The extended spectrum produces a Stratigraphic and Fault Attribute section (Figure 10b).
The yellow boxes in Figure 10 encase the target interval that is just below the Triassic salt section. Within the yellow box of Figure 10b, numerous faults are easy to identify and once a fault is found in Figure 10b, it can easily be traced back to Figure 10a; but the fault is more evident in Figure 10b. As expected, the faults are not easily traced into the salt above the yellow boxes.

Conclusions
During this SF study we observed the following:
- High-frequency components in the signal decrease while high-frequency noise coda increase making conventional deconvolution techniques questionable,
- Inability of source wavelets to propagate signal above 20Hz beneath SF sequences,
- Time-varying identification and separation of signal and noise components in the time-frequency domain,
- Identification of long-period multiples when comparing multiple versus primary synthetics in the lower-frequency bandwidths,
- Increase in structural event continuity when high S/N low-frequency components in the time-frequency space are extended to estimate the high-frequency components, and
- Enhancement in fault identification when low-frequency signal components are extended beyond normal high-frequency components.
Using the processing workflow described in this article, substantial progress was made in satisfying the original processing objectives specified in the Study Area section. The following interpretation problems were improved.
- Poor fault definition. The high S/N portion of the transmitted wavelets, which is the low frequency, is saved and then the remaining signal is extended to high-frequency components. With the ultrahigh frequency introduction, pseudo reflections are introduced which help define the fault terminations.
- Poor event continuity. Again, the high S/N portion of the transmitted wavelet is saved and the high-frequency components removed are replaced from the low frequency components. Basically, the phase spectra of the high-frequency components become more stable and event continuity improves.
- Low dominant frequency. SF and not intrinsic attenuation primarily lowers the frequency content of the seismic wavelet. With well control in the area, the Signal portion of the transmitted wavelet is estimated for preservation and then extended to increase the dominant frequency.
- Well mis-ties of ≈100m. When multiple synthetics are used to match the field seismic, the SF delays the reflections so the need for synthetic stretch is significantly reduced.
- Questionable amplitude and phase preservation. SF transforms the transmitted wavelet into a bell-shape pulse. This reduces the amplitude spectrum and introduces a minimum-phase distortion on the phase spectrum, especially below the cyclically high AI sediments. This phase distortion, however, is removed with deconvolution operating on the section beneath the high AI sediments.

Acknowledgements
We want to thank Sonatrach-PED for permission to publish this paper. In addition, we are thankful for the technical assistance received from Ha Nguyen, Marino Pareja and Altay Sansal at Geokinetics. We especially appreciate the innovated quality control and processing techniques developed by Milos Delic. Finally, we thank CSEG for the opportunity to present this material at the 2017 CSEG Symposium honoring Satinder Chopra.
Related Reading


Join the Conversation
Interested in starting, or contributing to a conversation about an article or issue of the RECORDER? Join our CSEG LinkedIn Group.
Share This Article