Summary
For a single stage of a hydraulic-fracture treatment, microseismic monitoring surveys often reveal event clouds that contain intervening regions where microseisms appear to be sparse or absent (“stealth zones”). Scaling relations from earthquakes suggest that typical microseismic moment magnitudes, in the range of -3 < Mw < -1, occur on fractures with dimensions from a few cm to a few m. Observations of natural fracture systems in the Canadian Rockies Foothills indicate that fracture dimensions are partly controlled by sedimentary facies. Irrespective of sand/shale ratio, finely laminated rock units are characterized by fractures that are systematically smaller than fractures observed in lithologically similar massive units. Taken together, these observations suggest that some microseismic stealth zones may represent regions of fracturing where event magnitudes fall below the survey-dependent detection limit due to variations in reservoir rock fabric.
Introduction
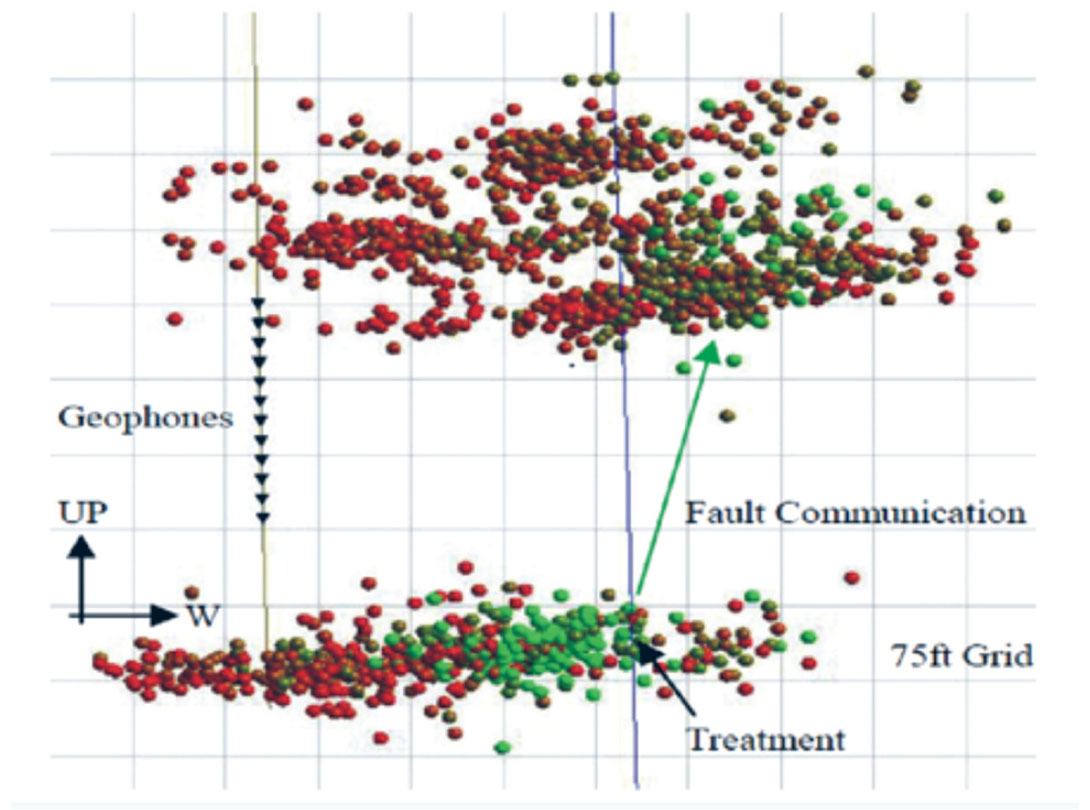
Microseismic events induced by hydraulic fracturing have sometimes been observed to jump aseismically from one rock unit to another (Rutledge et al., 2004, Pettitt et al., 2009). This concept, which we refer to as “stealth zones”, is illustrated in Figure 1, which shows microseismic data from a hydraulic fracture treatment of a tight gas sand (Pettitt et al., 2009). Observations such as these suggest that seismic deformation induced by hydraulic-fracture treatments may occur preferentially in some parts of a reservoir, whereas strain and flow of injected fluids could occur aseismically within other parts, i.e., in a manner that radiates relatively little seismic wave energy at the frequencies typically used for microseismic monitoring (100-1000 Hz). The process of individual fractures jumping over short distances across unfractured rocks has also been observed in a hydraulic fracturing mine-back experiments (e.g., Warpinski and Teufel, 1991).
Seismic signals from hydraulic-induced fractures are strongly linked to the complexity and size of the induced fractures (i.e. fracture height, spacing, etc.; McKeon, 2011). Fracture complexity is also strongly influenced by formation brittleness, with more brittle rocks commonly characterized by more complex fractures (Warpinski and Teufel, 1991). In this paper we present outcrop observations from the Canadian Rocky Mountain Foothills, which show that, apart from degree of cementation, facies homogeneity plays a critical role in determining the characteristics of natural fracture systems. In particular, these field observations show that rocks with similar lithologic characteristics such as sand/shale ratio, but differing bedding characteristics, often exhibit distinct natural fracture patterns.
In general, we find that laminated rock units tend to be characterized by relative short fracture heights, irrespective of lithology, whereas more massive and homogenous facies are characterized by significantly taller fractures. Geological controls on spacing of natural fractures in structural plays has been described in numerous papers (e.g. Nelson 1985; Ortega et al. 2006), highlighting the influence of bed composition, bed texture, and bed thickness. However, relatively little has been published on the length and height of the existing fracture networks, which are key characteristics for determining the surface area of the fracture and thereby both its effective area for matrix flow and the size of the seismic event.
Magnitude Scaling Relations
Seismic moment provides the most fundamental measure of the ‘size’ of an earthquake (or microseismic event). Seismic moment is given by

where μ is shear modulus, D is average co-seismic displacement across the fault and A is the fault area (Lay and Wallace, 1995). Microseismic event size is often reported using the moment magnitude scale, which is logarithmically related to seismic moment as follows:

A representative set of microseismic magnitude measurements from a hydraulic-fracture monitoring experiment is illustrated in Figure 2, which shows a subset of data from a 1997 hydraulic fracture monitoring experiment in the Carthage Cotton Valley gas field in East Texas, USA (Walker, 1997, Rutledge et al., 2004). The treatment zone for this stimulation program was 325m thick and consists of multiple, low-permeability sand layers within an interbedded sequence of sandstones and shale. The subset of microseismic data used here is from phase 1 of the experiment, in which the treatment fluid was a cross-linked polymer gel with added proppant. The induced events were detected using downhole geophone arrays placed in two monitoring wells.
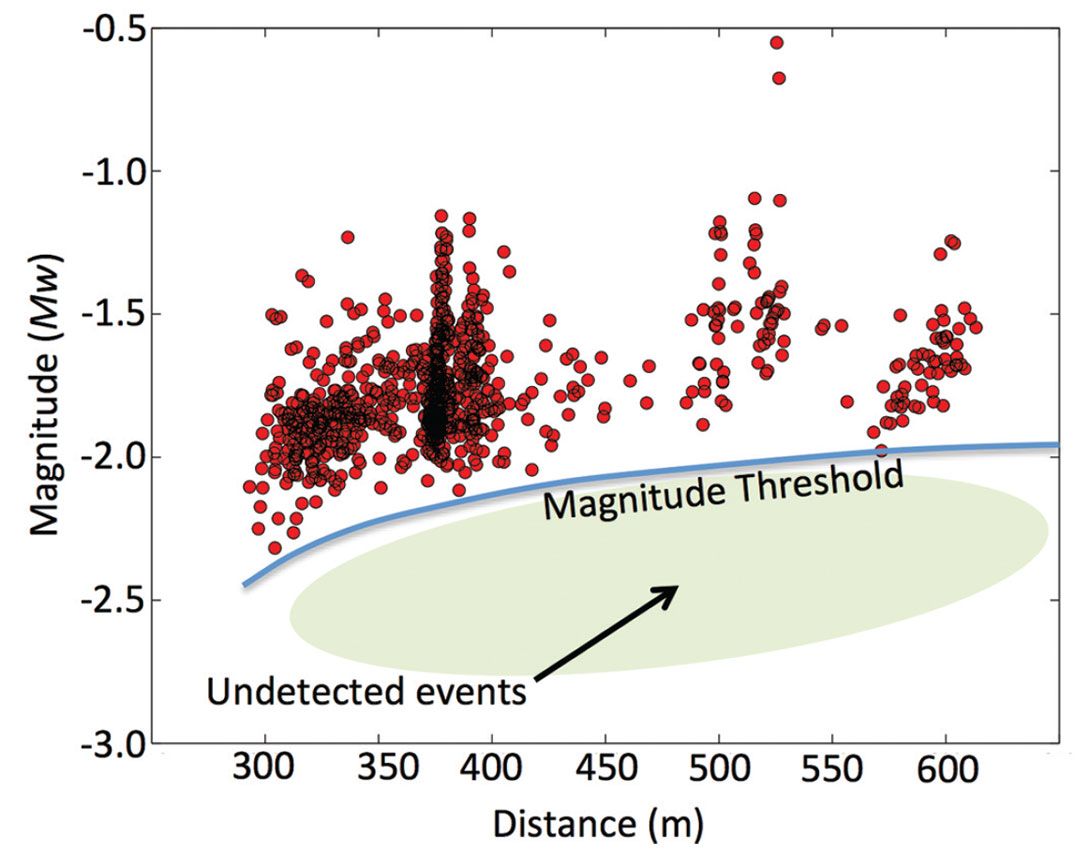
As shown in Figure 2, the distribution of magnitudes exhibits a general increase with distance. An interpreted detection threshold curve is also indicated, showing variation in the inferred minimum detectable magnitude with distance from the closest monitoring array. In practice, the detection threshold depends on a variety of factors, including background noise levels and geophone sensitivity. It also varies with distance, due to signal amplitude decay arising from the effects of geometrical spreading and anelastic attenuation. These considerations show that detected microseismic events should be interpreted as a large-magnitude subset of the actual microseismicity induced by hydraulic fracture stimulation of a reservoir.
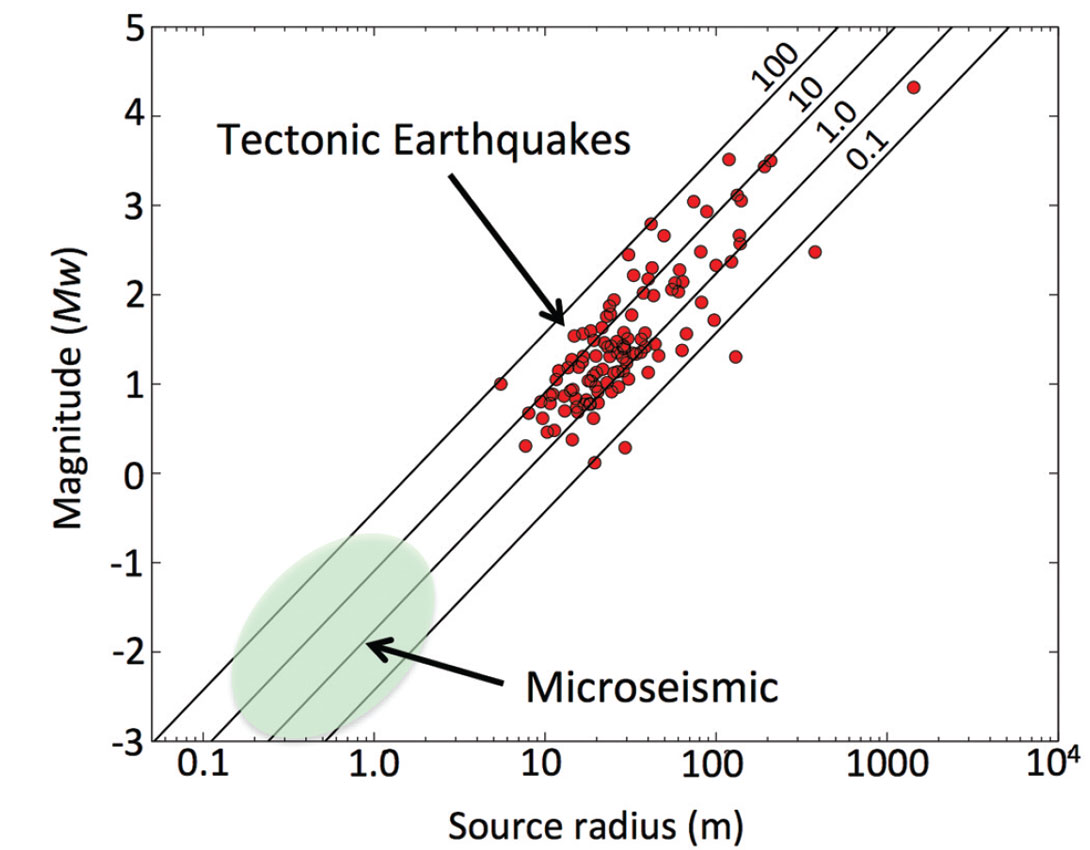
Figure 3 exemplifies the scaling behavior of tectonic earthquakes, based on borehole recordings of about 100 events in California (Abercrombie, 1995). This graph plots source radius, r, a proxy for the spatial dimension of the rupture zone estimated from the measured corner frequency of the S-wave source spectrum, versus moment magnitude, Mw. Magnitude and source radius are related by the difference in stress across a fault before and after an earthquake, known as stress drop (Δσ). Assuming a circular rupture region, this relationship can be expressed as (Eshelby, 1967)

As shown in Figure 3, earthquakes are commonly believed to have stress-drop values that fall within the range of 0.1 to 100 MPa (Abercrombie, 1995). If we extrapolate the scaling behavior of earthquakes into the typical magnitude region of microseismic events (-3.0 < Mw < -1.0), we see that the expected microseismic source radius varies from a few cm to a few m.
Taken together, the above considerations suggest physical scaling relationships of microseismic events, such that detected microseismic events occur on fractures with a heights of 10’s of cm to a few m. Conversely, depending upon experimental design parameters, rupture events on smaller fractures could produce microseismicity that falls below the detection threshold – i.e., “stealth” events. The following section presents observations of natural fracture systems that are exposed in the Canadian Rockies Foothills. We believe that natural fracture systems such as these could provide useful analogs for understanding fracture systems within reservoirs.
Natural Fracture Systems
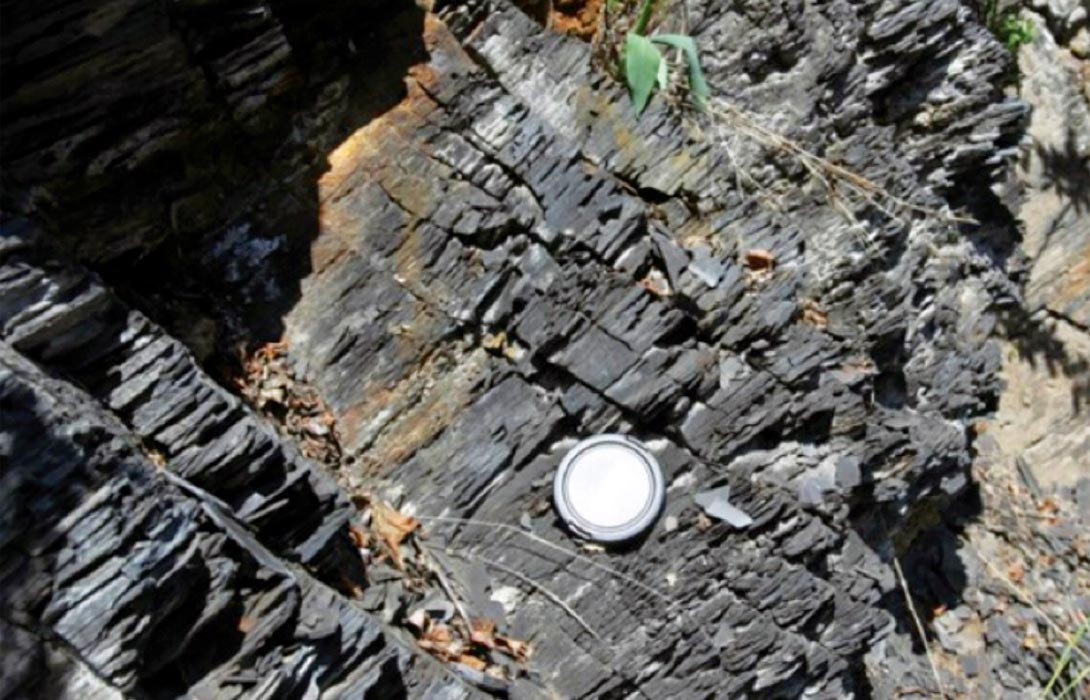
Figures 4-6 show examples from the Second White Speckled Shale on Highwood River near Longview, Alberta, where fractures are easily observed in both outcrop-face and bedding-plane views. These organic-rich, massive calcareous shales contain well defined ~1m tall fractures. An abrupt transition to a more dense and relative short, ~10cm, fracture pattern coincides with the appearance of the first thin (<1cm), siltstone laminae. Although this is a very gradational facies contact, the change in fracture characteristics takes place over a relatively confined interval. The laminated facies grades vertically into the Jumping Pound Sandstone (Figure 7), which at this locality is characterized by relatively massive sandstone facies and well-developed fracture patterns.
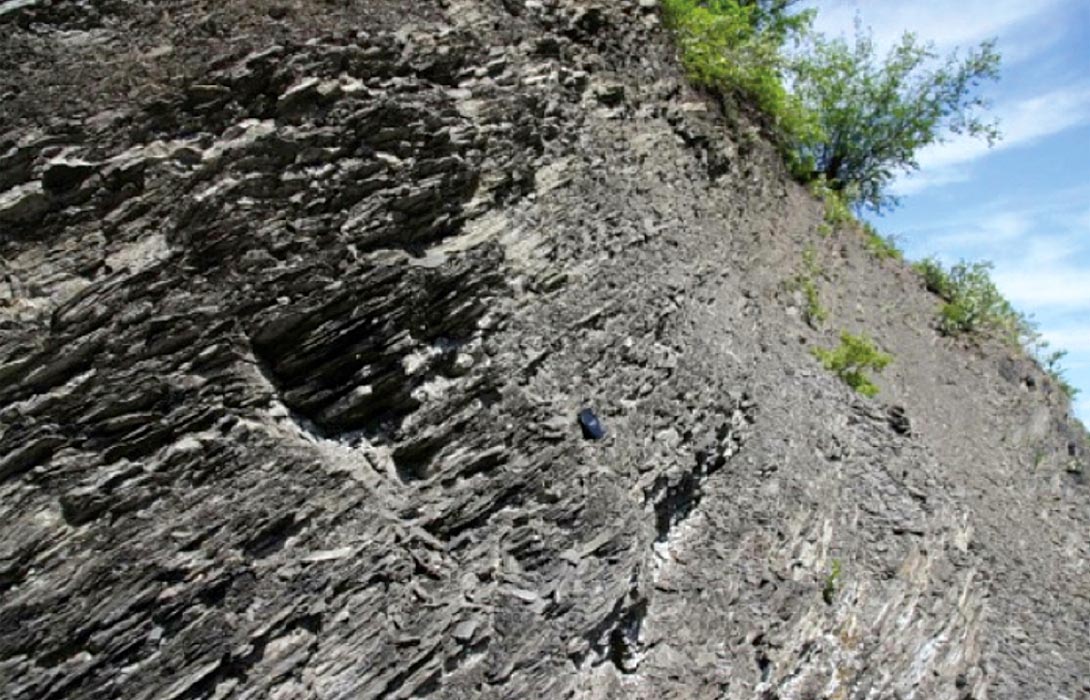
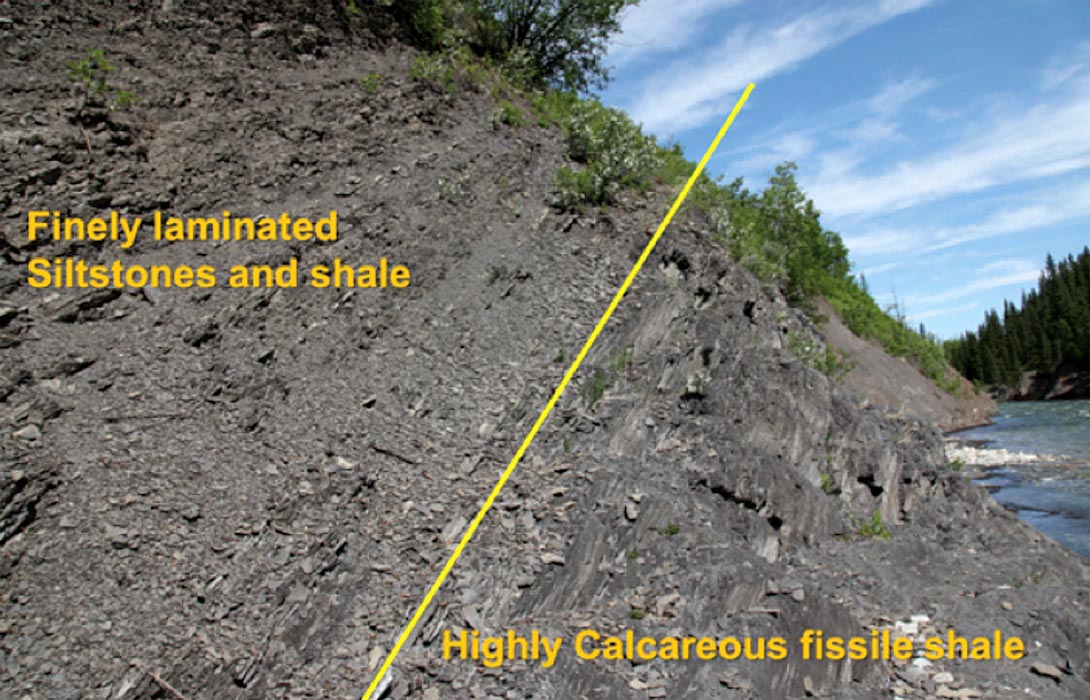
The pattern of natural fractures leads us to postulate that the organic-rich Second White Speckled shales and the Jumping Pound Sandstone units would be likely to produce easily detectable microseismicity during hydraulic-fracture treatment. Conversely, the finely laminated and bedded middle interval containing shorter fractures would likely be characterized by relatively weak microseismicity, potentially below detection threshold in a microseismic survey. These finely laminated units may therefore represent a naturally fractured example of a microseismic “stealth” zone.
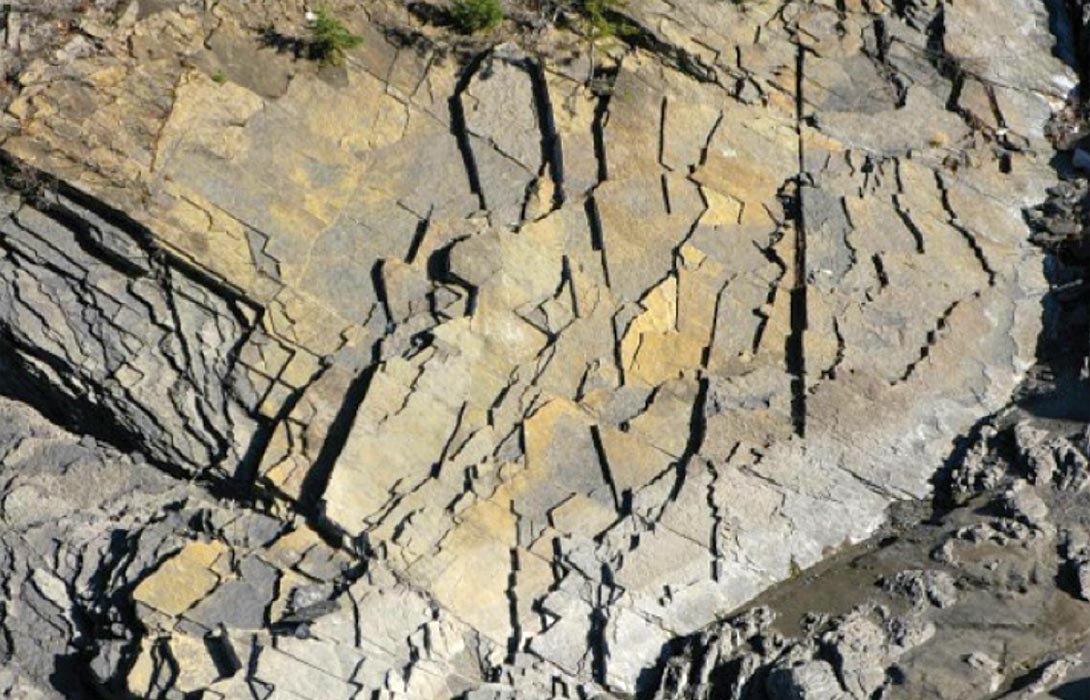
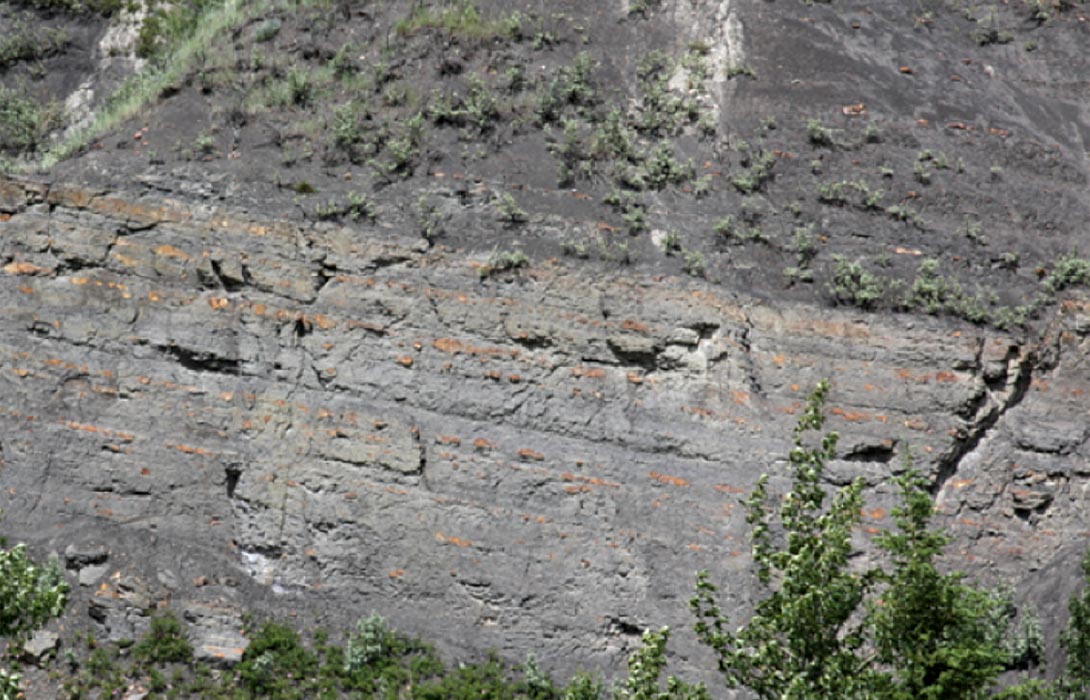
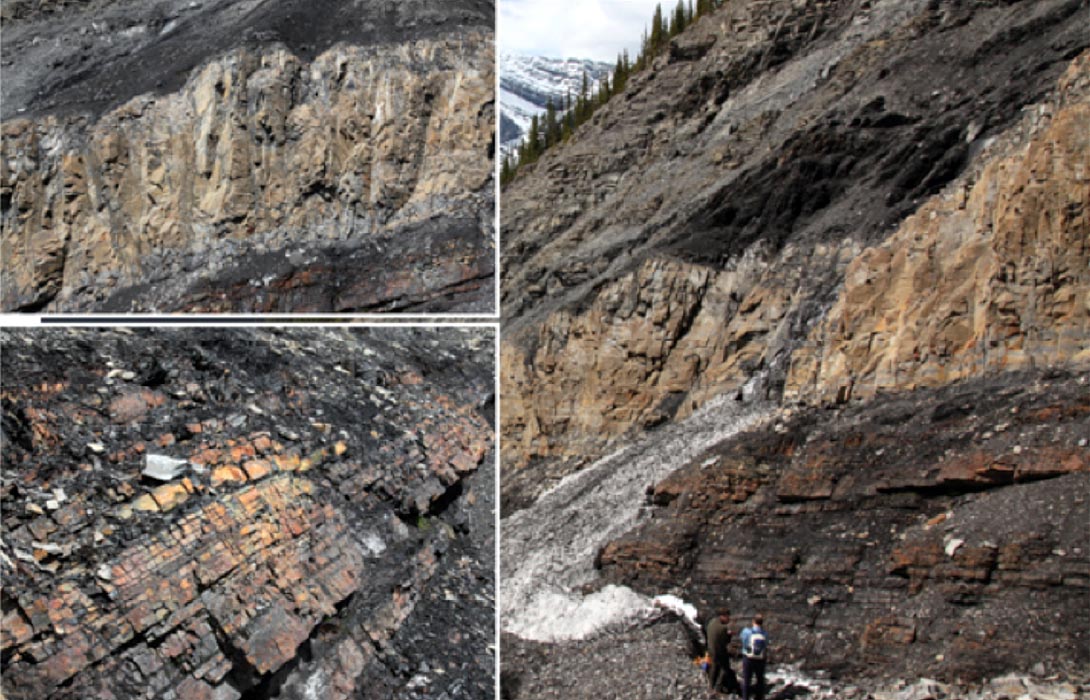
Similar observations are seen in outcrops of the Cardium and Wapiabi formations at Ram Falls and Bighorn Dam, Alberta (Figures 8 and 9), where interbedded sandstone and shale facies are characterized by short and dense fracture patterns, whereas massive shoreface sandstones as well as intensely bioturbated muddy sandstones are characterized by relative tall and well defined fracture patterns. Lithological and sedimentary facies controls on fracturing are also evident in Paleozoic units at Goat Creek, Alberta (Figure 10). Here, the Lower Exshaw and basal Banff shales are intensely fractured, whereas an Upper Exshaw massive carbonate unit is characterized by tall fractures.
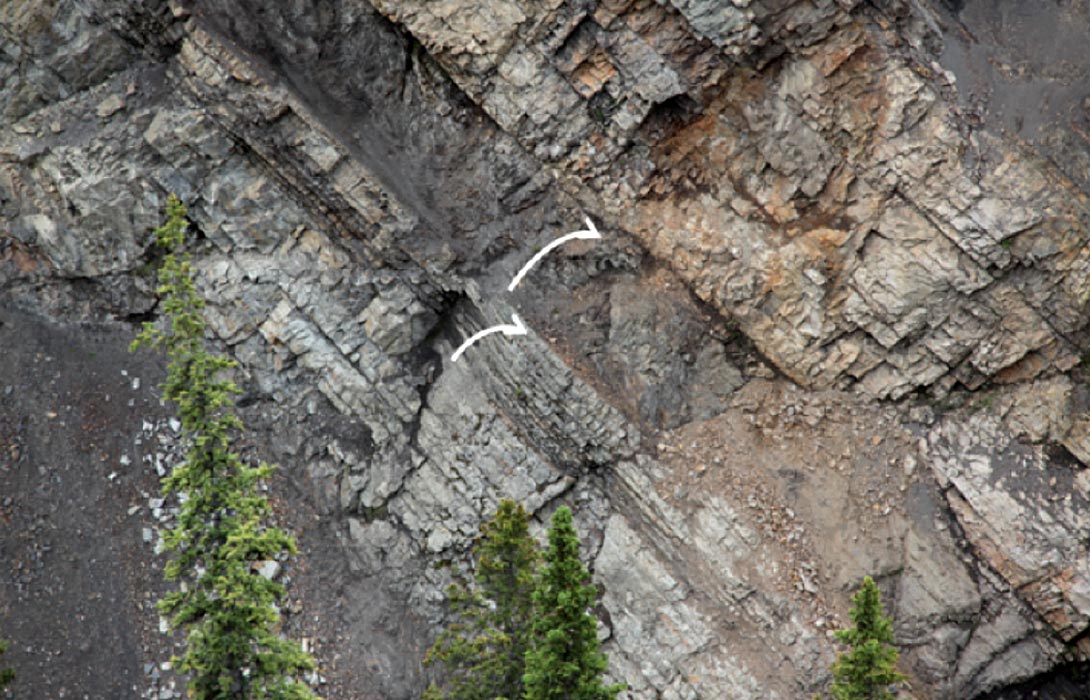
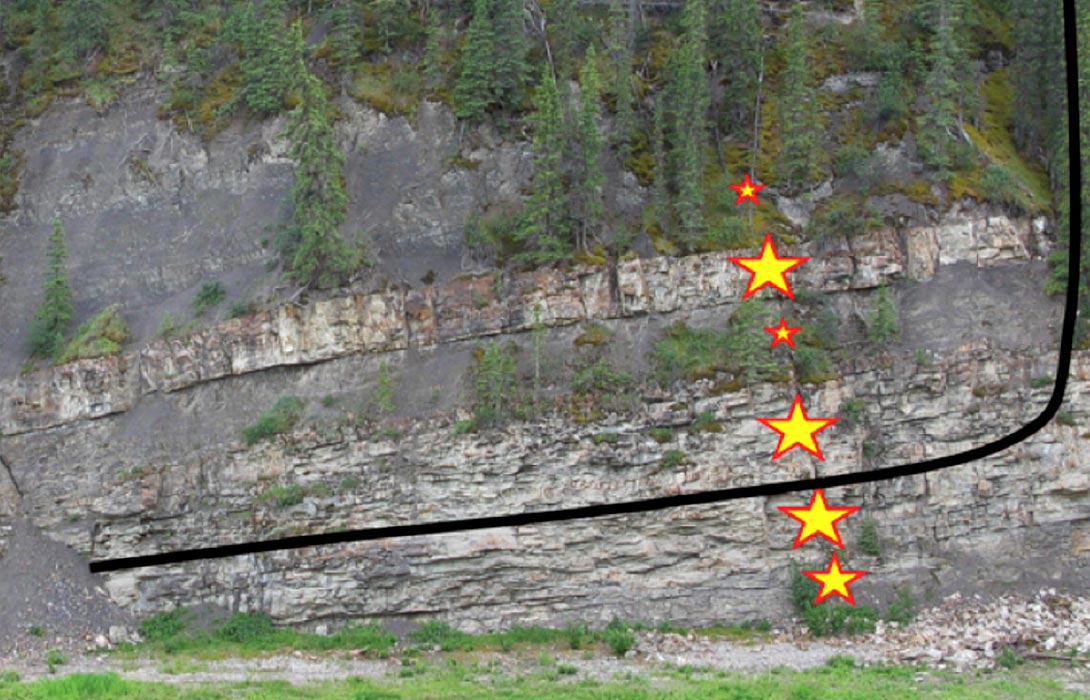
These concepts are encapsulated in an interpretation given in Figure 11. Here, finely laminated shaly facies separate relatively massive sandstones of the Cardium Formation at Bighorn Dam, Alberta. We postulate, based on the expression of natural fractures in these units, that the shaly facies could be representative of reservoir intervals where relatively sparse microseismicity would be expected.
It should be stressed that outcrops examined all are located within the Canadian Rocky Mountain Foothills and thus the natural fractures observed in the outcrops were mainly formed in a compressional tectonic setting and rock expansion due to unloading. Thus, some differences in fracturing style may be expected compared with the fractures induced in the extensional stress regime during hydrological fracturing; however, we believe that the inferred characteristics are dominantly controlled by geomechanical characteristics of these units, and thus provide insights that are applicable to fractures of equivalent units within subsurface reservoirs in the plains.
Concluding Remarks
Some microseismic monitoring studies exhibit evidence for preferential occurrence of microseismic events in certain lithologies (e.g., sand), with microseismic activity occasionally “jumping” from one zone to another without any accompanying microseismicity a scenario that we refer to as “stealth zones”. Direct examination of naturally fractured reservoir units in the Foothills region west of Calgary provides insight into geologic factors that could influence microseismicity. In particular, field observations of the Second White Specks shale and Jumping Pound Sandstone at Highwood River, Cardium and Wapiabi formations at Bighorn Dam and Banff/Exshaw stratigraphy at Goat Creek reveal that homogeneity of sedimentary facies, a function of primary depositional processes, degree of bioturbation and subsequent cementation, plays a major role in the characteristics of natural fracture systems. Homogeneous and laminated sedimentary facies occur in both shales and sandstones; this suggests that it may be difficult to predict fracture characteristics based entirely on sand/shale ratios as derived, for example, from well logs.

Acknowledgements
Per Kent Pedersen acknowledges that the ideas presented here build upon discussions with numerous people from academic and industry field trips. Per Kent Pedersen’s field work has been supported by several grants and companies over the last 10 years. Shawn Maxell is thanked for providing the Cotton Valley dataset. We also thank sponsors of the Microseismic Industry Consortium and the Tight Oil Consortium for their support.
Related Reading


Join the Conversation
Interested in starting, or contributing to a conversation about an article or issue of the RECORDER? Join our CSEG LinkedIn Group.
Share This Article