Over the past 10 years, land seismic acquisition has changed significantly. Nodal/cable-less systems have broadly replaced cabled systems, vibroseis sources have replaced explosive sources even in areas with difficult terrain, and high-density seismic programs are becoming commonplace. This article, based on the Chief Geophysicists Forum presentation “Top 5 Innovations in Geophysical Acquisition”, will provide a brief overview of some of the “new-to-Canada” technologies.
Introduction
Although high density 3D seismic surveys have been acquired successfully for many years outside of Canada, the technology to acquire these surveys for Canadian programs has only recently been tested and implemented resulting in significant data quality improvements. Advances in equipment technology are enabling the acquisition of lower/higher frequencies in datasets and the ability to deploy equipment in rugged terrain conditions. New methods have been developed to reduce costs and environmental impact, to maximize field efficiencies, and to optimize processing algorithms. These changes in field operations have revolutionized survey design with high-density geometries providing amazing improvements in data resolution while minimizing field costs. All of these methods, however, result in the acquisition of significantly larger datasets with the volume of some land surveys now in the 100’s of terabytes of data. These larger data volumes provide incredible resolution and improved drilling results, but also require more storage capacity, both during processing and for data archiving.
Equipment Advances: Geophones
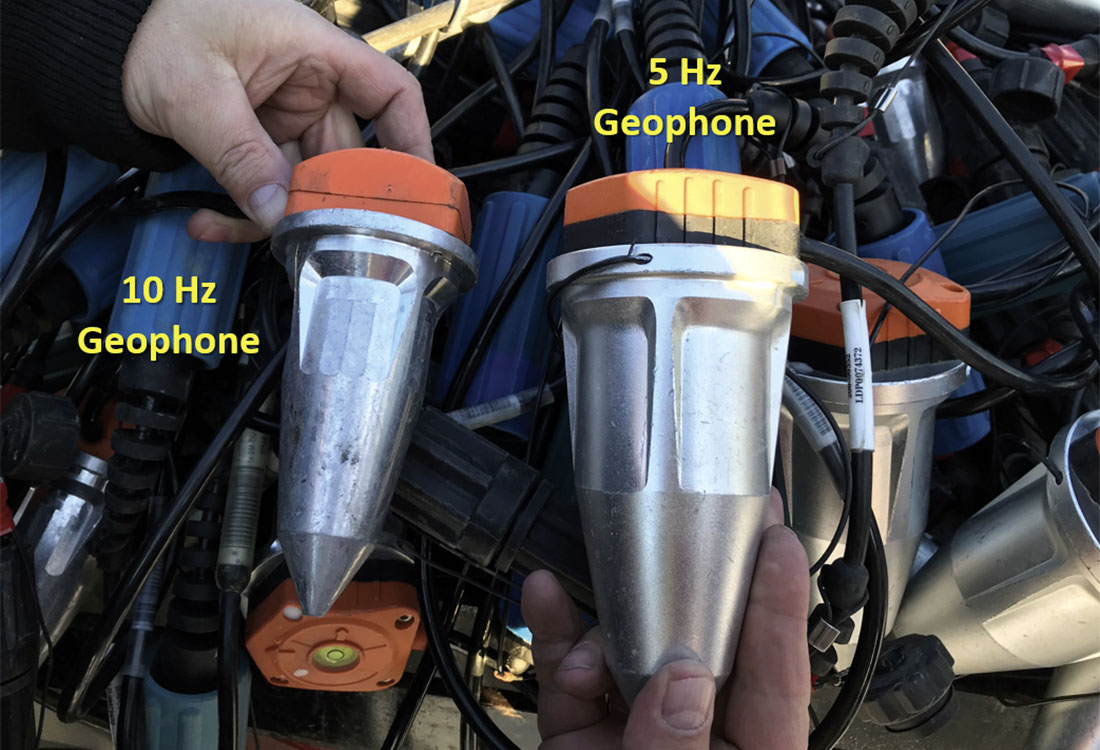
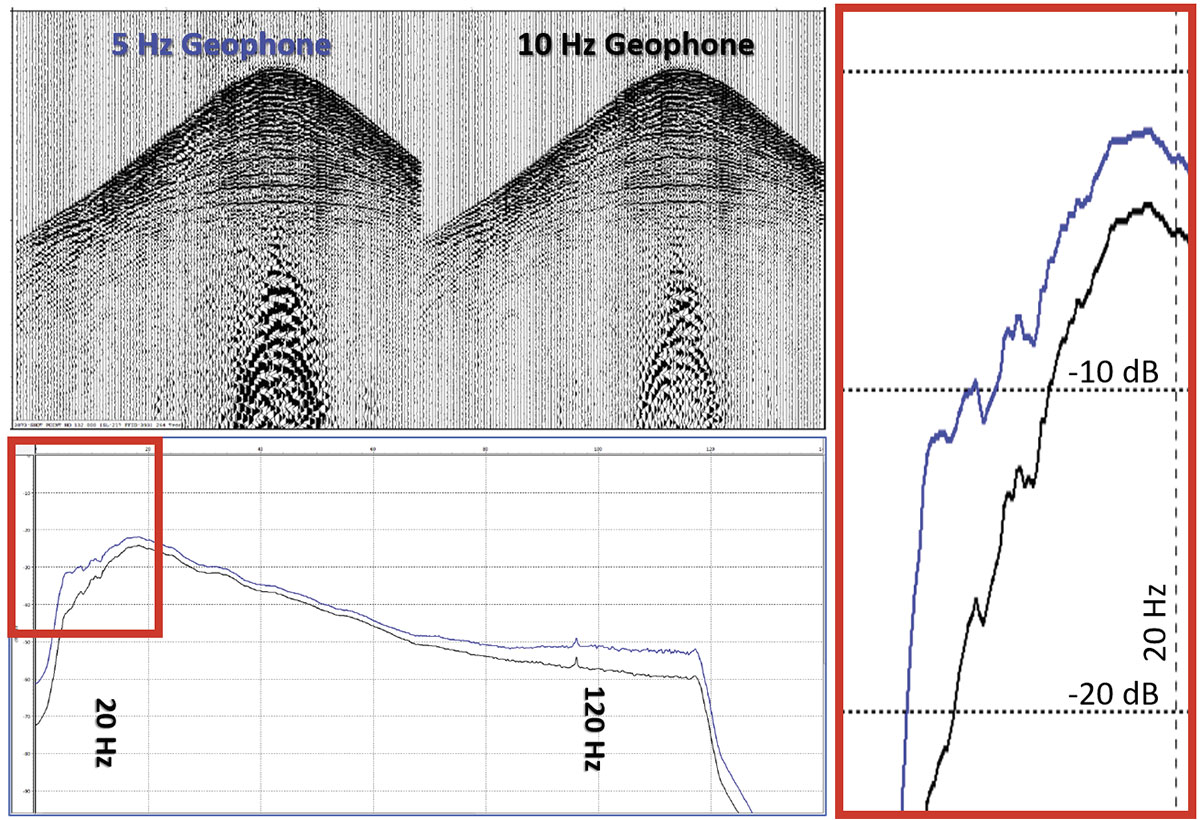
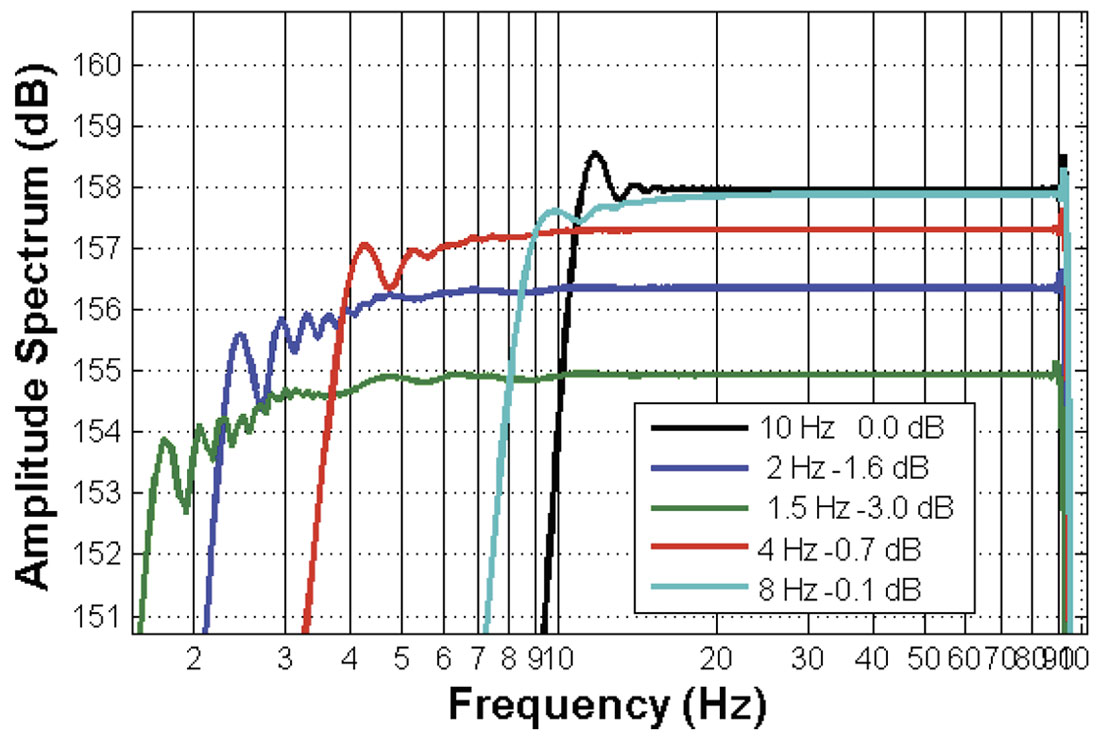
Seismic receiver technology is constantly advancing with new, smaller, high-fidelity geophones becoming available in the large quantities needed for high-density surveys. Although 10 Hz geophones are currently the standard used in Canada, 5 Hz geophones are becoming more common-place (Figure 1). Testing results indicate that more low frequencies (<15 Hz) and mid-range frequencies (80-120 Hz) can be achieved with 5 Hz geophones (Figure 2), but 10 Hz geophones tend to out-perform 5 Hz analog geophones at frequencies >150 Hz.
Although not yet available in large volumes in Canada, low frequency 2.5 Hz geophones, high-fidelity digital geophones, and extreme broadband geophones (0.3-400 Hz) (Howe, 2018) are in development. As the cost of these technologies decreases, it is expected that these geophones will become available for regular seismic acquisition programs. The improvement in low frequencies is particularly beneficial for inversion work.
Equipment Advances: Vibroseis
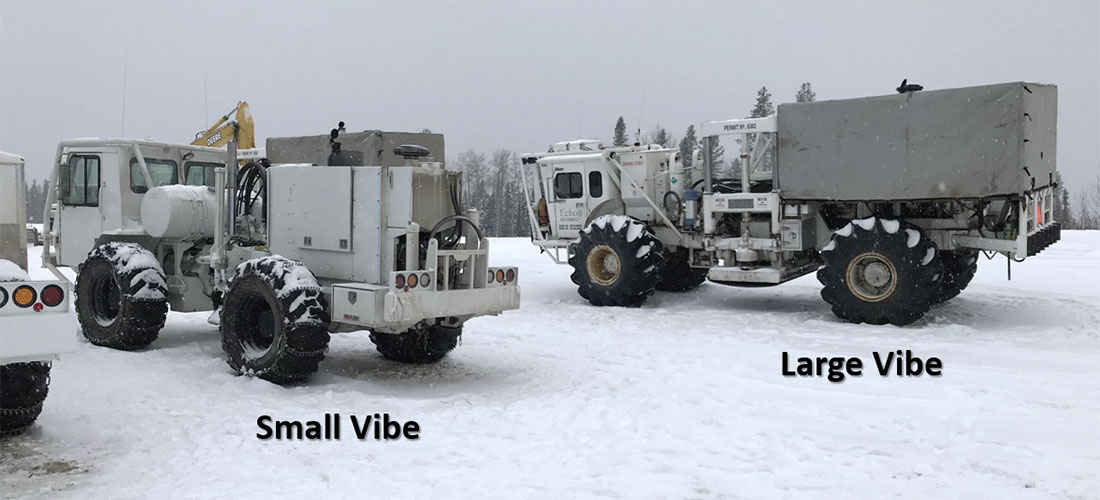
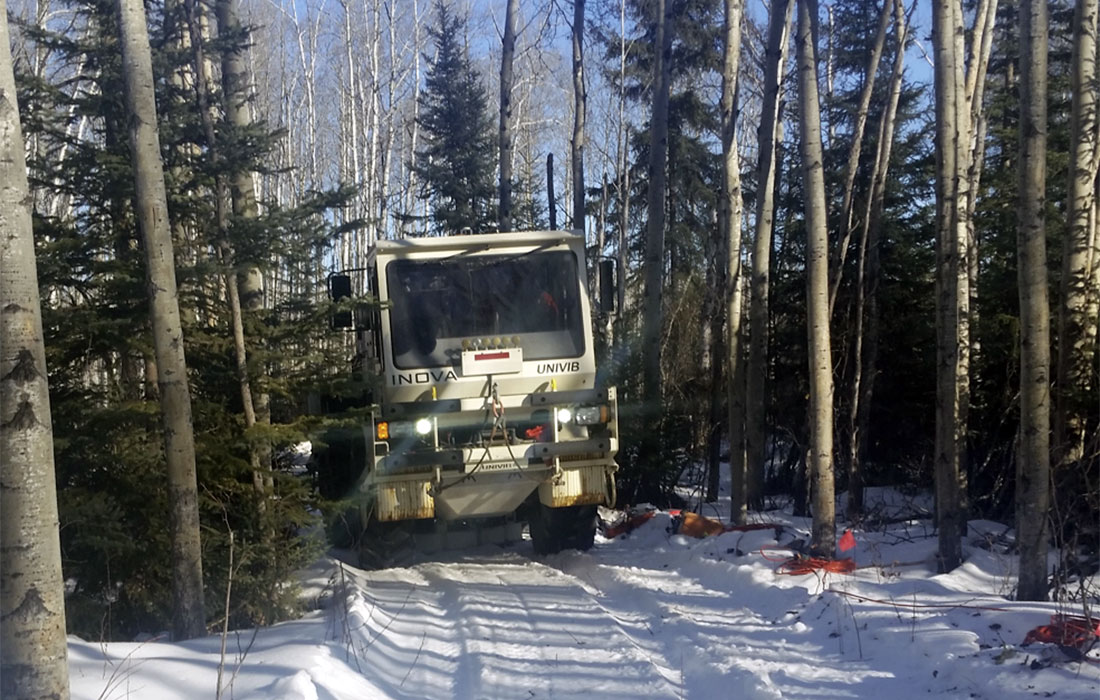
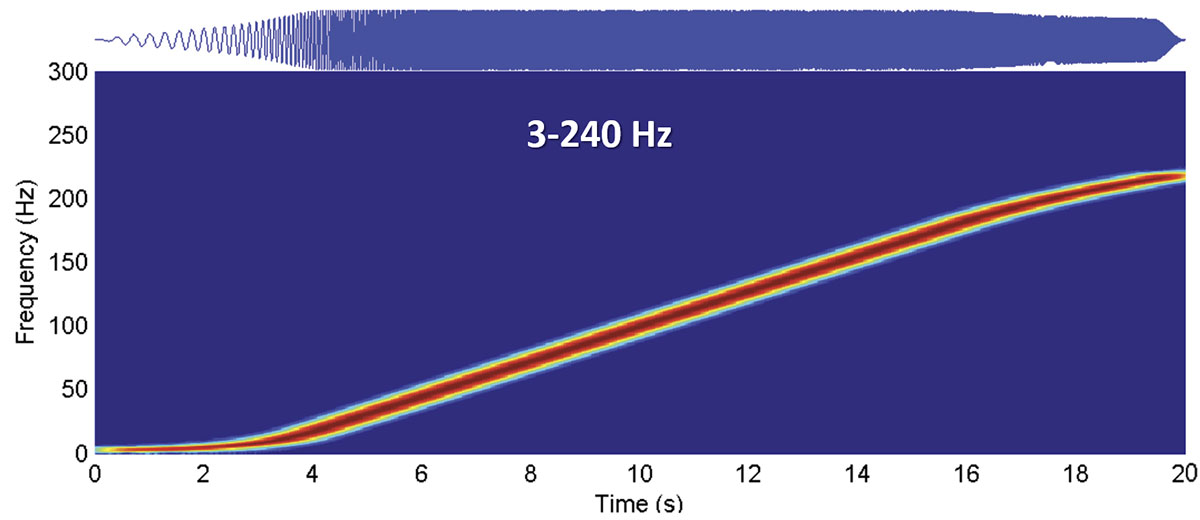
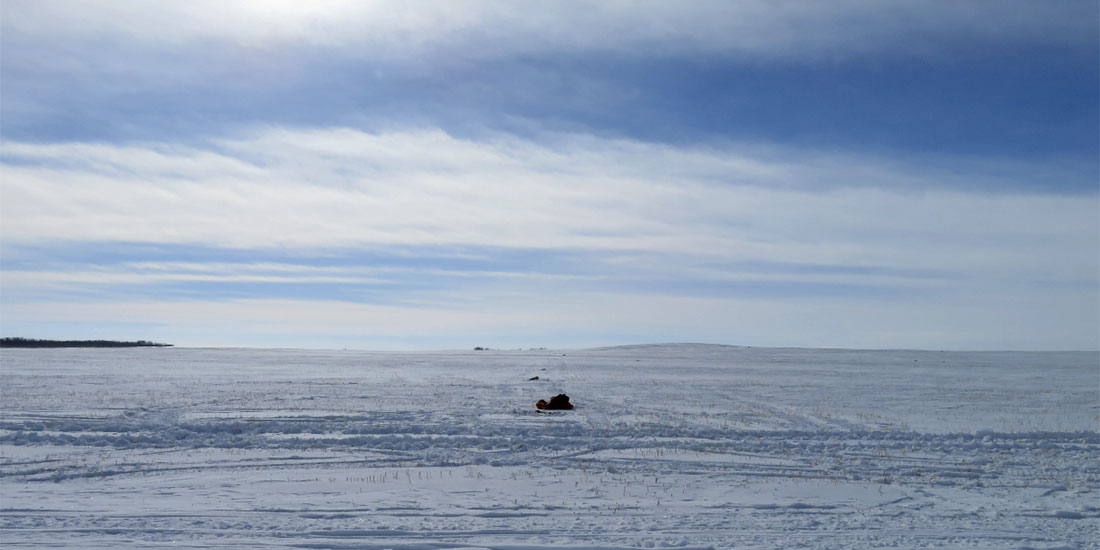
The use of vibroseis sources has enabled the acquisition of extremely high-density surveys, but in the past these surveys were limited to areas with minimal elevation changes and no tree-cover. Although small “mini-vibes” existed that could be used on narrow cut lines, the low peak force (~10,000 lb) and older hydraulics often limited the low frequency response and the depth of signal penetration. New developments have resulted in mini-vibes with higher peak force (15,000, 26,000, and more recently 34,000 lb), improved frequency bandwidth (1.5-300 Hz), and greater depth of signal penetration (up to 3 km) (Digital Energy Journal, 2010) (Figure 3). With the improvement in technology, it is now possible to acquire large-scale seismic surveys utilizing mini-vibes in heavily forested regions of Canada (Figure 4).
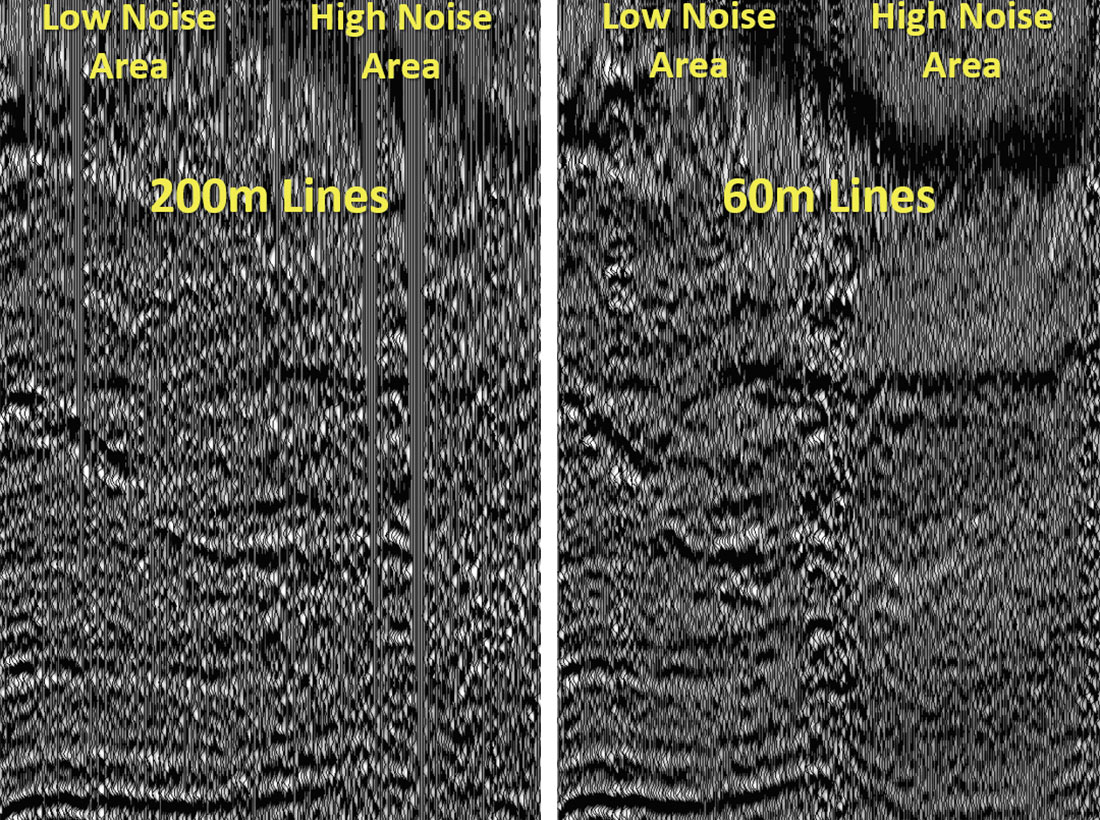
Vibroseis sweep technology has also improved with the ability to start at lower start frequencies (Figure 5) and to acquire data with higher end frequencies (Figure 6) (Winter et. al., 2014). Also, the development of custom sweeps specifically designed for the target zone can provide data equivalent to explosive sources (O’Byrne, et. al., 2016). In order to obtain the highest quality data, it is recommended that vibroseis acquisition startup tests be conducted at the beginning of each seismic program to optimize the vibroseis parameters for ground conditions and target imaging (Charles, et. al., 2016).
New Acquisition Methods: Stake-less Surveying
Traditionally, the surveying of sources and receivers is conducted at the beginning of field operations (in open areas) or after line clearing (in areas with trees), and each surveyed location is marked with stakes (wooden laths) or pin flags (Figure 7). For vibroseis operations, once surveying of an area is complete, the recording crew lays out equipment at each staked receiver location, and the vibroseis source is driven to each staked source location and shakes adjacent to the stake.

In stake-less survey operations, receiver and source locations are still surveyed, but no stakes or pin flags are placed in the ground (Figure 8). This saves a surprizing amount of time since there is no need to hammer stakes into frozen ground nor spend time writing the station number on the stake. There is also less clean-up at the end of the job with no broken laths or missing pin flags to find and remove in the spring after snow melt. Although stakes are not used for source and receiver locations, it is still necessary to survey, map, and flag/mark hazards, exclusions, and source offsets. Since exclusions can change on a daily basis, it is important to regularly update exclusion files during recording operations.

Two challenges exist with stake-less surveying: (1) accurately navigating to stake-less locations to deploy equipment and (2) maintaining survey accuracy. In open areas without any tree canopy, this is relatively easy, but in areas with extensive canopy, both navigating to a location and acquiring accurate survey at the location can be difficult.
If the stake-less survey is conducted prior to recording, then accurate navigation to the stake-less receiver locations to place the geophones is required. Depending on the navigation system utilized (e.g. Real-time Kinematic, GPS) and the amount of canopy, accuracy may vary from centimetres to several metres. These potential errors need to be assessed relative to the station interval to determine if they are acceptable or not.
Stake-less surveying may also be implemented during recording operations. Accurate navigation to preplot is still required, but the surveyed location will be at the actual geophone location, which is beneficial. On large programs with limited recording time windows, it may be difficult to accurately survey quickly enough to keep up with the equipment layout/pickup, particularily in treed areas. Depending on the survey accuracy required, the GPS positioning of the nodes may also be utilized as part of the survey, but this requires quality control and it may be difficult to obtain the required accuracy in areas with canopy.
Most vibroseis trucks (vibes) are equipped with RTK (Real-time Kinematic) positioning enabling accurate navigation to source locations in open areas. The advantage of utilizing this methodology is that if ground conditions at the planned source location are poor, the vibes can move up to find better ground conditions and survey information will be available for this new location. (Note that stake-less survey operations are not yet recommended for explosive source surveys since most seismic drills are not equipped with accurate navigation systems.) As with the receiver survey, in open areas, reasonable accuracy can be achieved for the X and Y coordinates, but elevation (Z) may not be reliable due to the short occupation time at each station. One solution is to utilize LiDAR for elevation data. In areas with thick canopy, however, this method may not provide the necessary X, Y survey accuracy, for small station intervals.
As technology improves, it is expected that the accuracy of the various stake-less survey methods will improve. Methods for improving current stake-less survey practices include: extensive pre-field modeling, detailed hazard and exclusion mapping, utilizing LiDAR for elevation data, source/receiver line tracking, and quality control checks.
New Acquisition Methods: High Density Vibroseis
Conventional vibroseis operations typically involve positioning two to four (or more) vibes at the source location and then all vibes shake the same sweep at the same time. The sweep is usually repeated at each location anywhere from two to eight times (or in some cases more). After each sweep, there is a listen time equal to the desired record length. Once all repetitions at the source location have been completed, all the vibes move up to the next source location (Figure 9).
In high density vibroseis operations, only a single vibe is used at each source location and only a single sweep is taken. To compensate for the lower signal strength at each source location, the survey is typically designed with higher source density (i.e. smaller station/line intervals). To increase efficiency in field operations, the sweeps are overlapped in time.
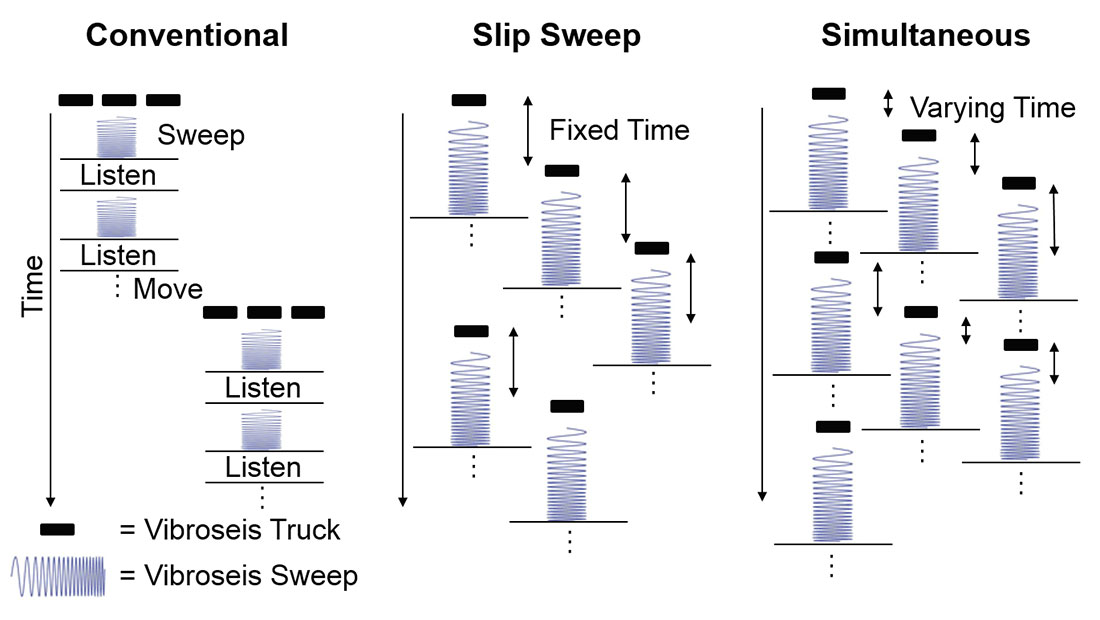
Slip sweep, first introduced in 1996 (Rozemond, 1996), involves starting the next sweep at a fixed time after the start of the first sweep (Figure 9). Once the first sweep is finished, the vibe can immediately move to the next source location. Vibes are typically kept a minimum distance apart (separation distance). The slip time and separation distance are determined from theoretical modeling, field testing, and target imaging/signal-to-noise requirements.
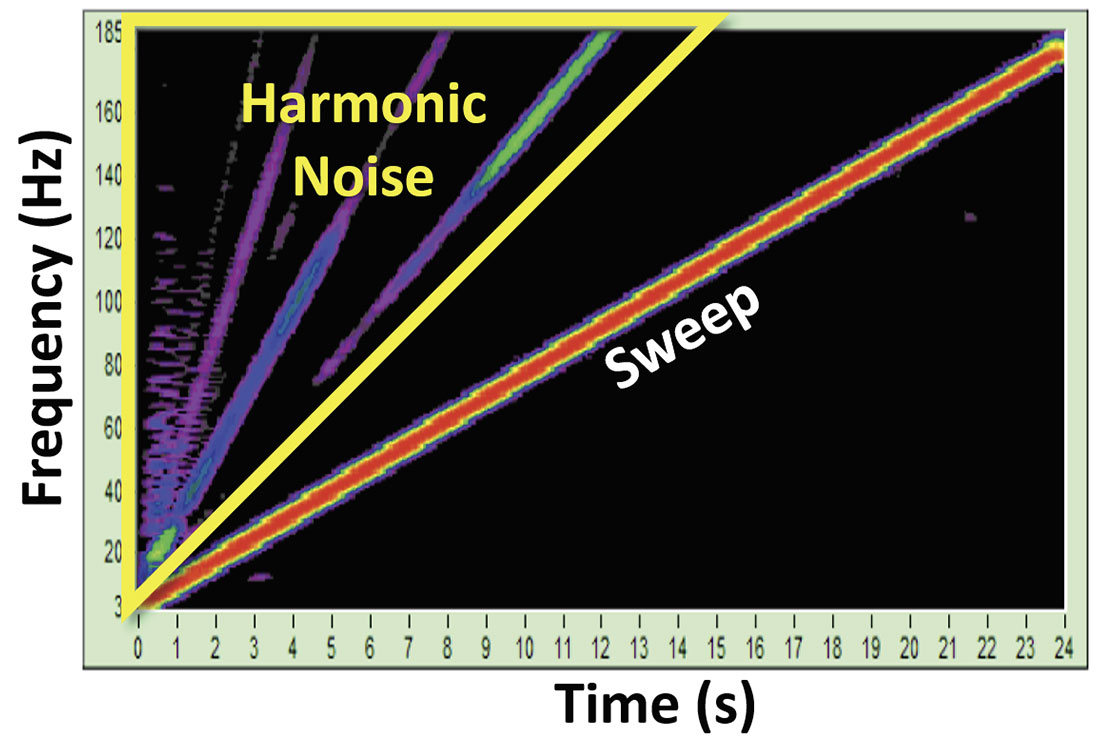
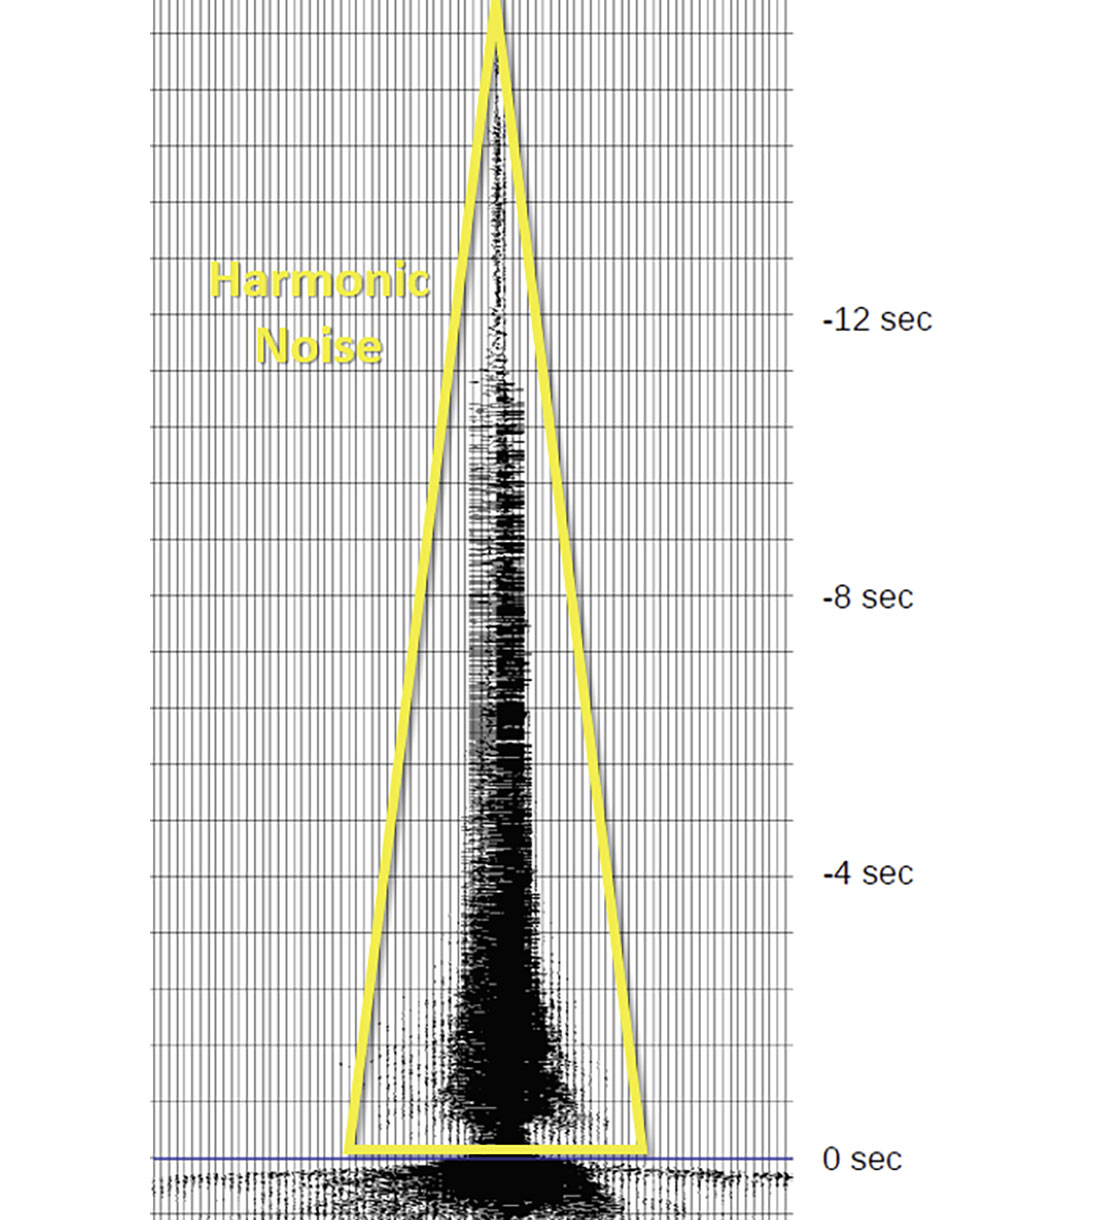
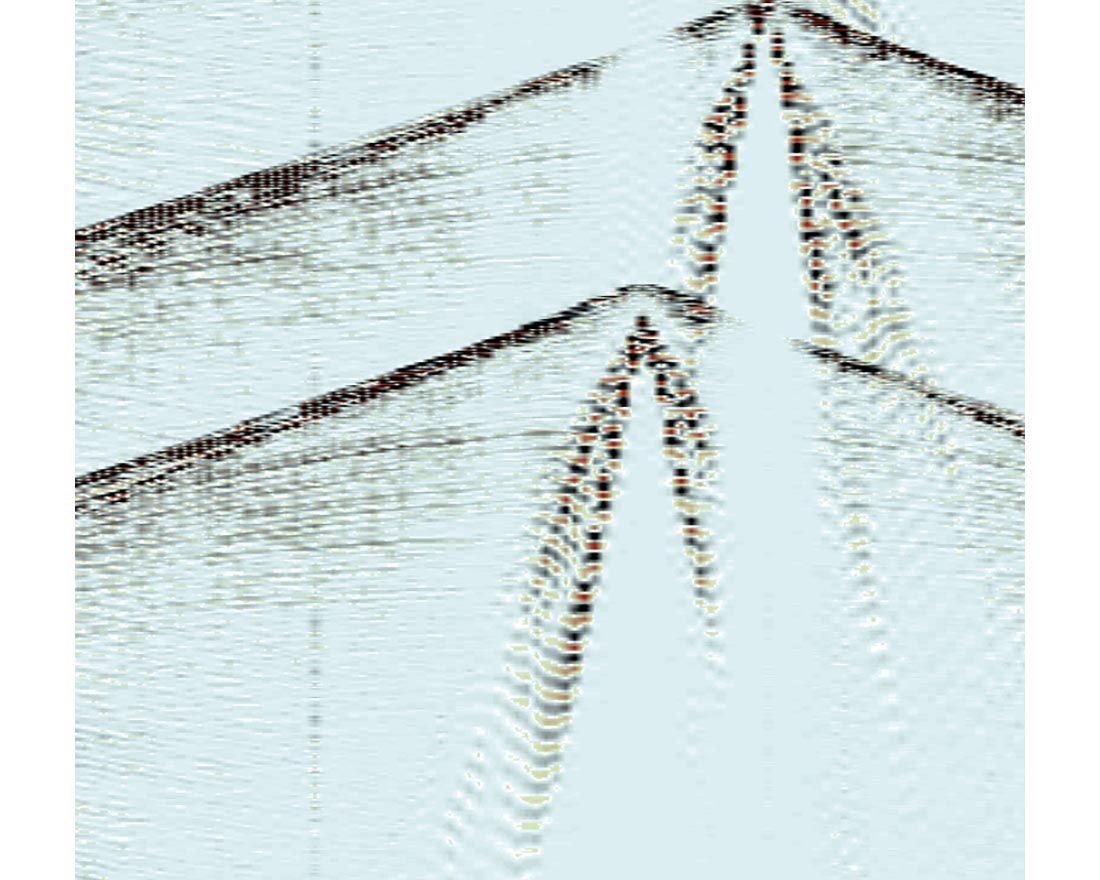
When vibroseis sweeps are overlapped, the harmonic noise generated by one sweep is correlated into negative time and contaminates the previous sweep (Figures 10 and11). Figure 12 illustrates a shot record with harmonic noise, which can be removed in processing utilizing harmonic noise filters, but only if the ground force has been recorded for each sweep.

Since the introduction of slip sweep, new methods such as Independent Simultaneous Sweeping (ISS) (Howe, 2018) and Distance Separated Simultaneous Sweeping (DS3) (Bouska, 2009) have been introduced. These methods increase operational efficiency by removing the slip time resulting in vibroseis sources shaking simultaneously (Figure 13). However, with the increase in the speed of source acquisition, more equipment is often required on the ground for both slip sweep and simultaneous source operations.
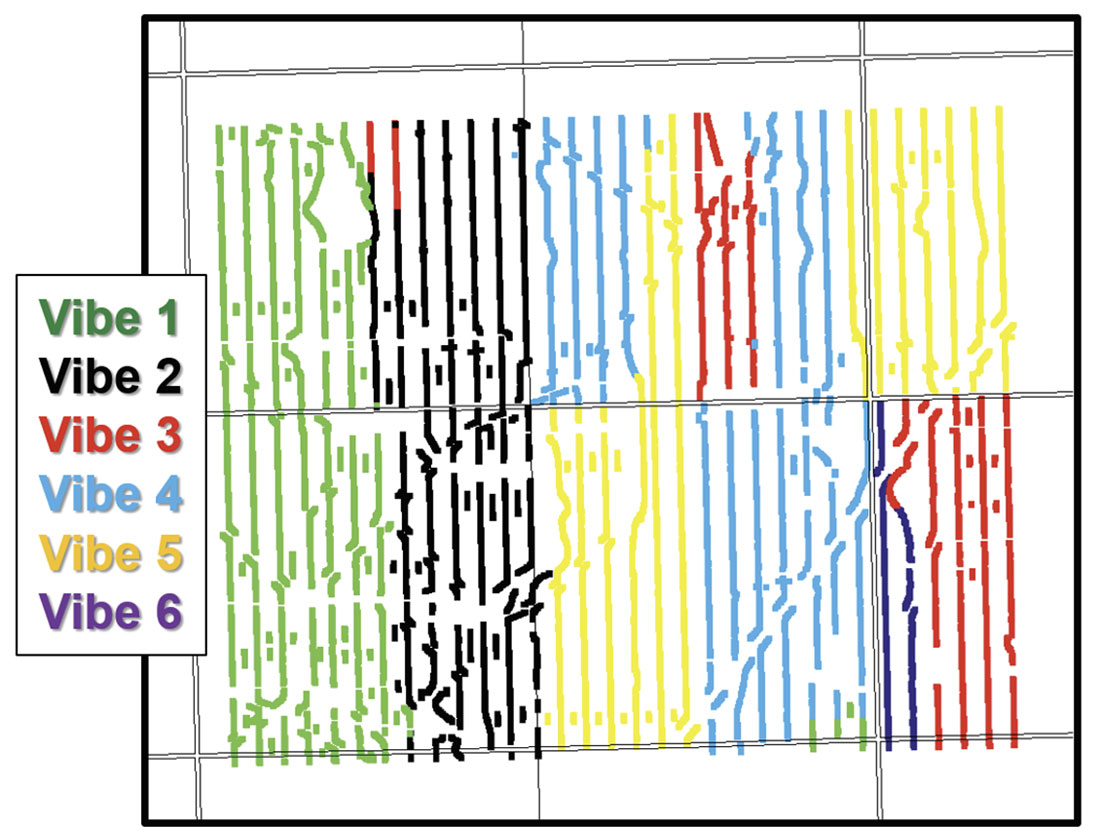
Although single vibe/single sweep and slip sweep acquisition has been extensively tested in Canada with numerous case studies illustrating the increased efficiency and improved resolution due to utilizing higher trace density geometries, simultaneous source acquisition is relatively new to Canada. Figure 14 illustrates the increase in operational efficiency that can be achieved with simultaneous source. In this example, six vibes acquired ~19,000 vibe points (VPs) in four days with a maximum production of 7,500 VPs per day.
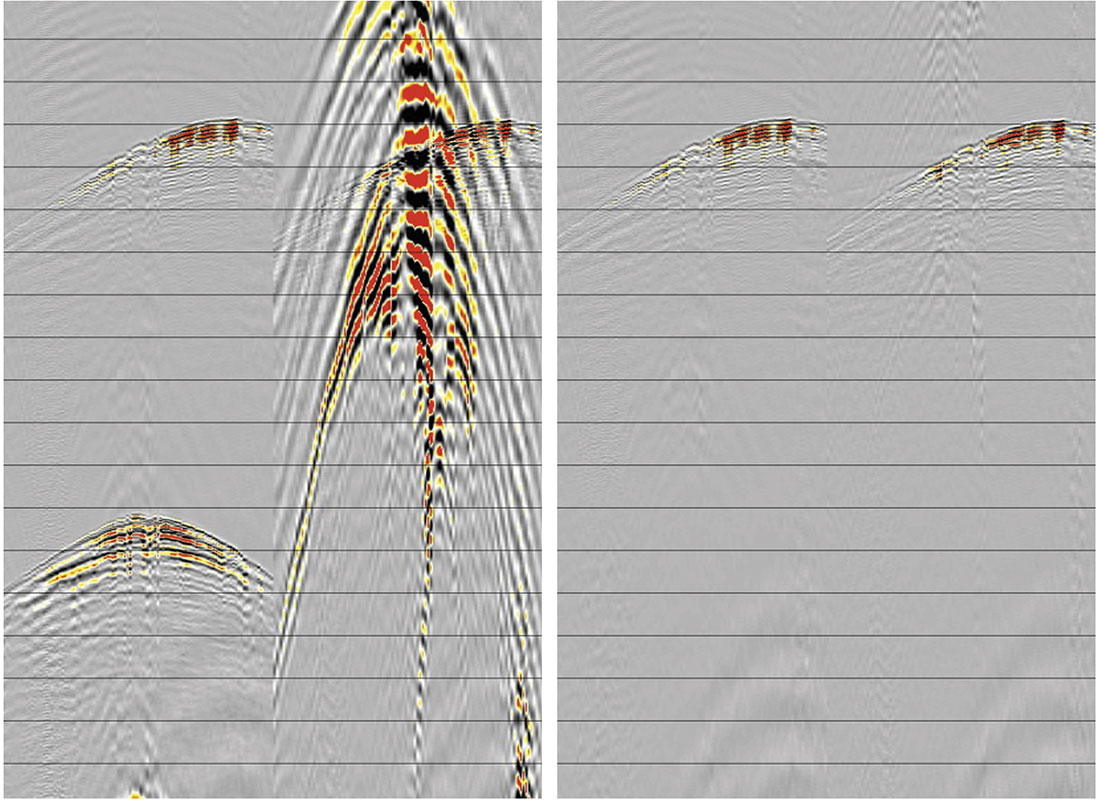
Simultaneous source can be acquired much faster than slip sweep; however, the resulting shot records are blended (have overlapping sources) and require deblending in processing (Figure 15). Numerous deblending algorithms have been developed and this is an area of active research (see Ou, et. al., 2017 for a review of recent methods). A summary of current research and methods can be found in the recent The Leading Edge article "Workshop Review – Seismic with simultaneous sources: Where does the industry stand?" (El-Taha & May, 2018).
New Acquisition Methods: Compressive Sensing
Various methods have been proposed to randomize acquisition geometry to increase trace diversity and improve interpolation/ reconstruction processes (e.g. midpoint scatter, Flexi-Bin®, randomization algorithms). Compressive sensing employs nonadaptive linear projections to preserve signal that is sampled at less than the Nyquist sampling interval (Baraniuk, 2007). By using a compressive sensing algorithm instead of randomization to optimize source and receiver locations, it is possible to acquire sparse data and then reconstruct it back to high density data in processing. The key is to optimize the geometry for the specific reconstruction processing algorithm. The challenge is to implement the optimal geometry in the field where line and station deviations due to exclusions and/or variation in terrain are common. Additionally, this method is dependent on the specific reconstruction algorithm to be utilized in processing.
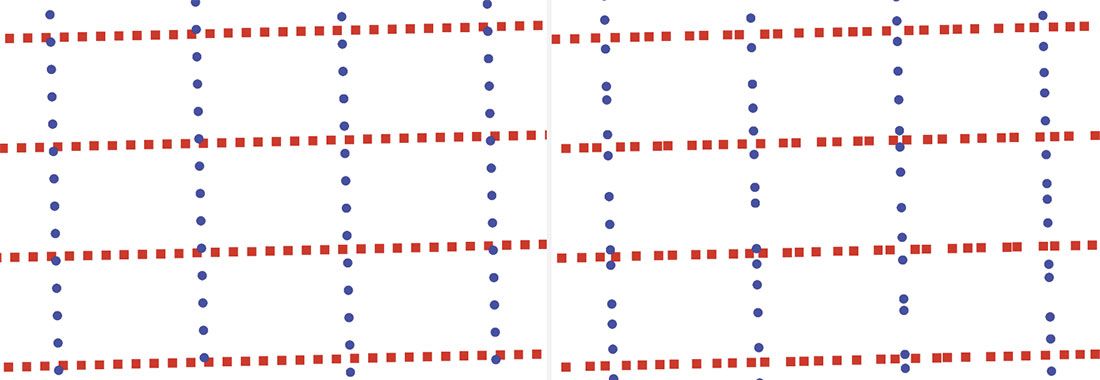
Research is ongoing to design optimal compressive sensing algorithms for selecting seismic acquisition geometries (see SEG 2017 Technical Program session ACQ 4: Compressive Sensing and Simultaneous Shooting Land/OBC for recent publications). One method, Non-uniform Optimal Sampling (NUOS) (Li, et al., 2012), is illustrated in Figure 16, where a regular geometry is optimized for reconstruction to smaller station intervals.
Implementing New Methods
There are two considerations when implementing these “new-to- Canada” technologies: (1) to maximize benefit, the survey geometry should be optimized for the technology, (2) field testing is recommended to efficiently obtain the highest resolution data. The benefits of reducing station and line intervals are well understood (Figures 17 and 18), but the most cost-effective way to achieve this is not always apparent. Modeling studies (Figure 19) and decimation tests (Figure 20) are useful for determining optimal sampling geometry, but equipment optimization calculations (e.g. channels moved per day, VPs per vibe per hour) and field tests (e.g. vibroseis sweep parameters, slip time, simultaneous source distance separation) for signal optimization are equally important. When these are all implemented effectively, the resulting data provides significant benefits.
Results
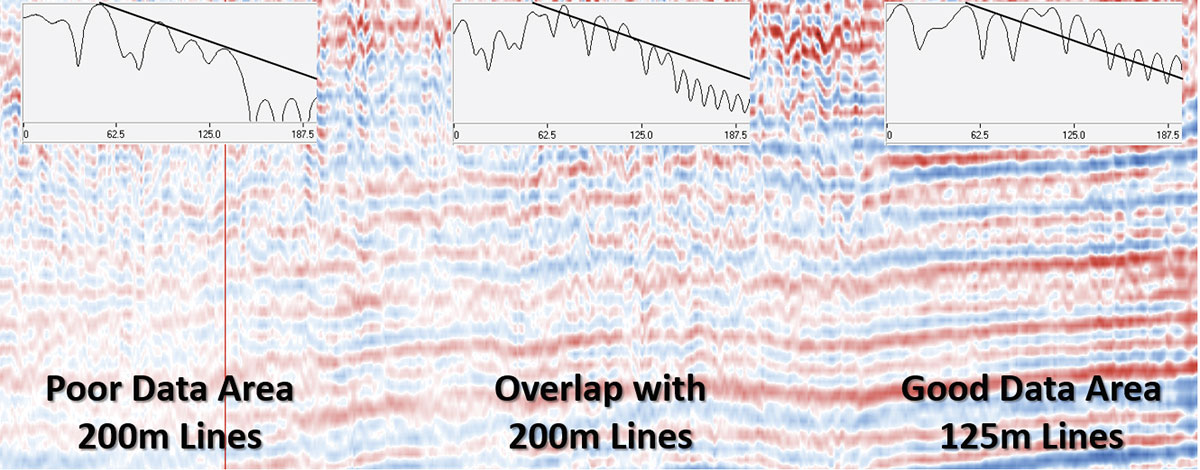
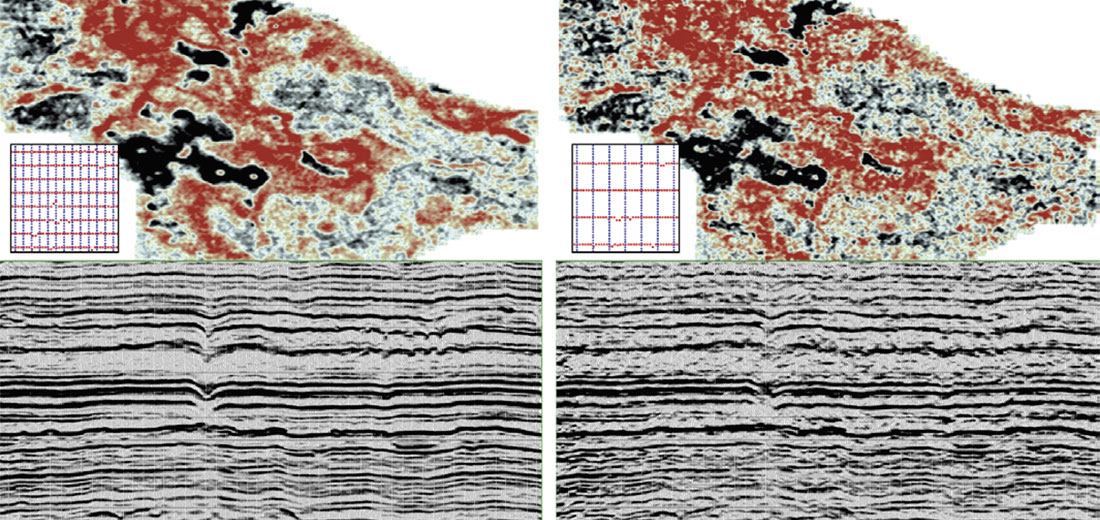
The following examples in Figures 21 and 22 illustrate the improvement that can be achieved by utilizing these innovations. In the first example, standard practice within the survey area was to acquire seismic data with an explosive source utilizing large (50-75 m) source station intervals in order to minimize drilling costs. The only vibroseis program in the area was acquired with the same source station interval using conventional vibroseis acquisition methods with multiple vibes acquiring multiple sweeps at each source location. The new 3D survey was designed to utilize high-density, single vibe/single sweep, slip-sweep vibroseis acquisition with smaller source station intervals, source line, and receiver line intervals. The program also tested stake-less survey operations and was acquired with a 1.5 Hz start frequency. The new 3D had a 3x increase in fold (within the natural bin) and a 7.5x increase in target trace density (12x increase in nominal trace density = 33,000 tr/km2 to 400,000 tr/ km2) when compared with the adjacent explosive source survey. The results were phenomenal with a significant improvement in both low and high frequencies as well as an increase in resolution, which enabled the mapping of new targets and improved drilling results (Figure 21).
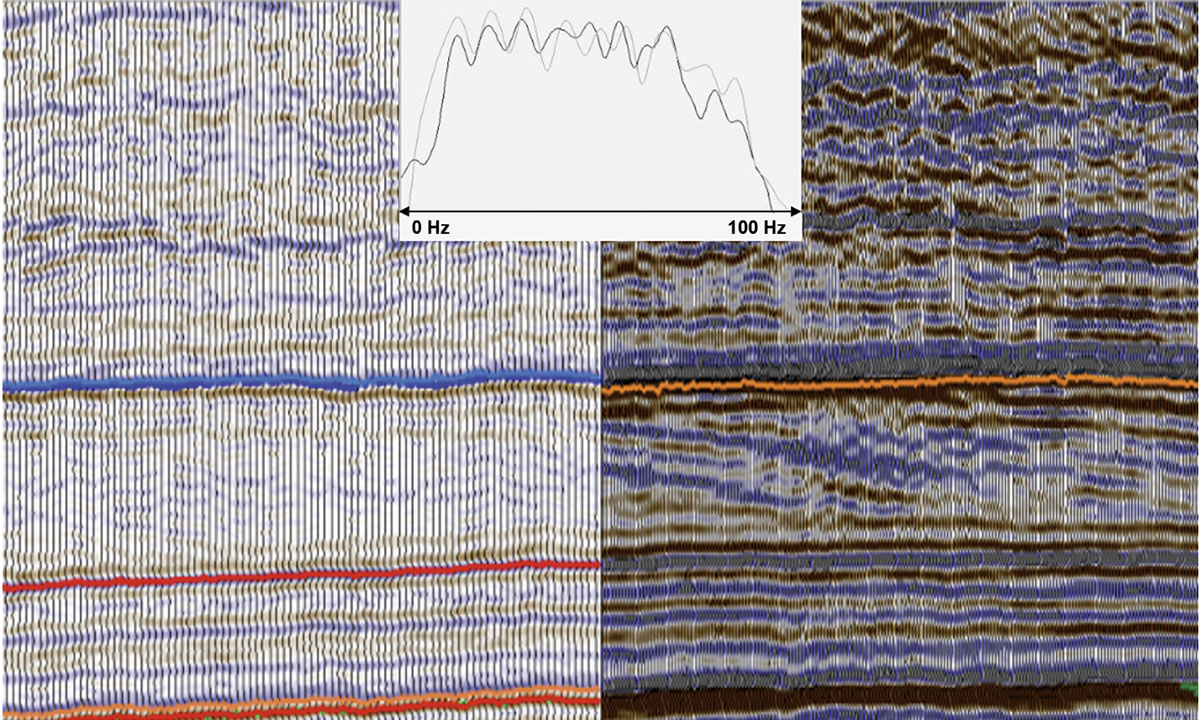
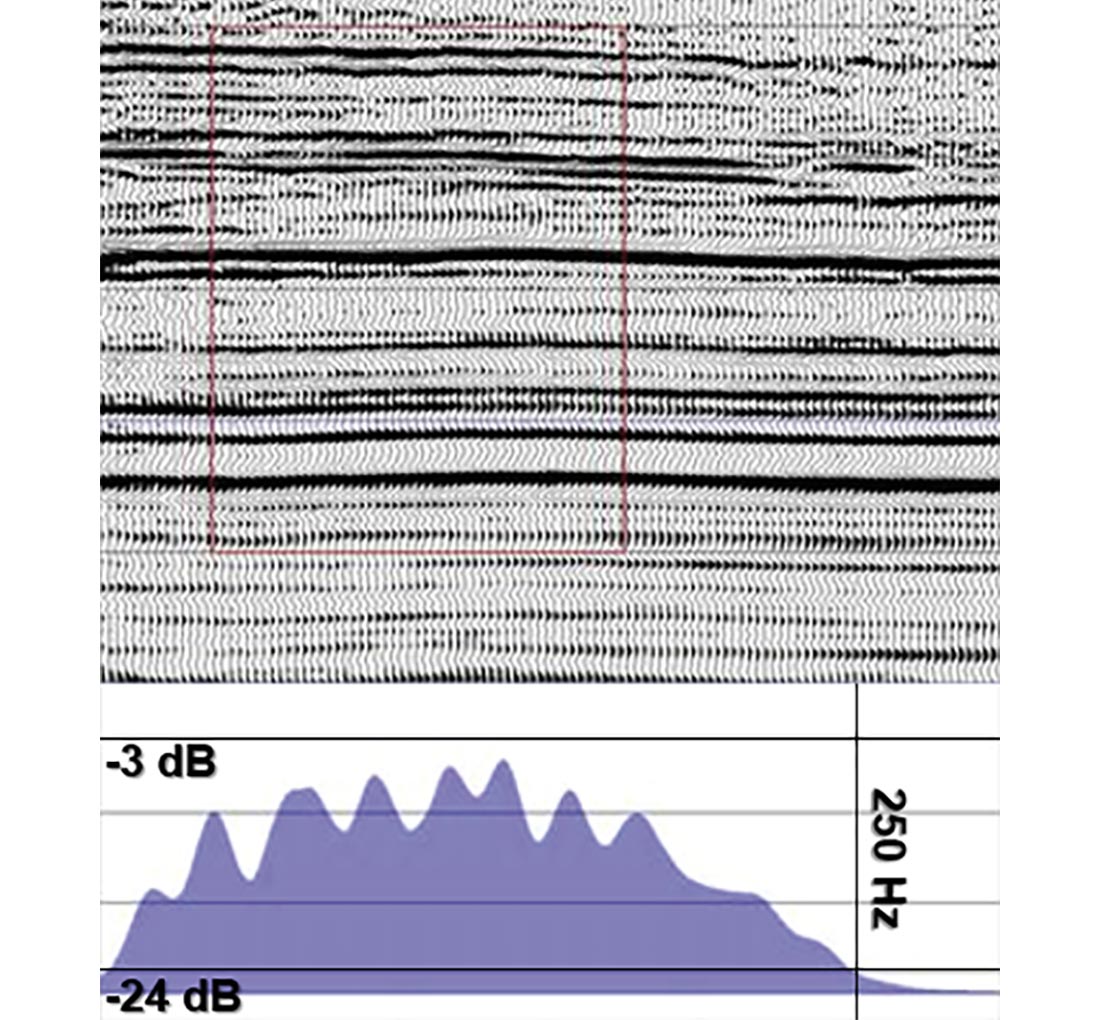
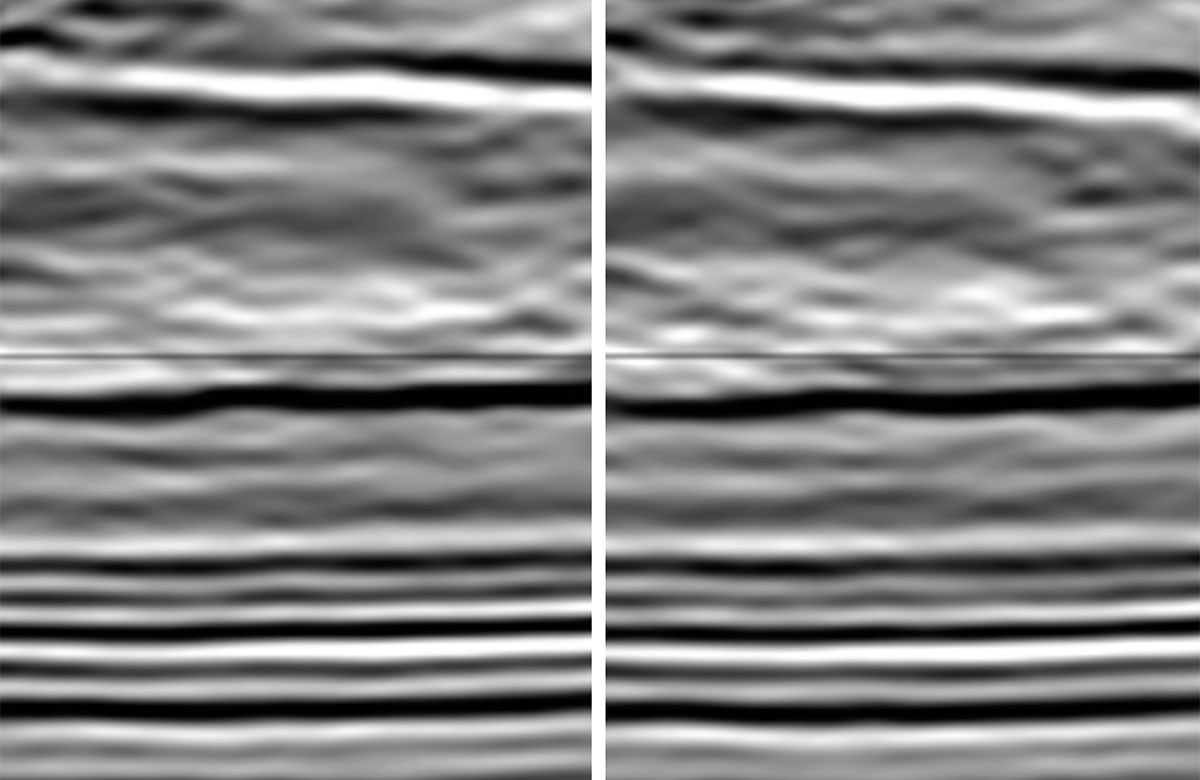
The second example, also acquired with high-density slip-sweep vibroseis acquisition and stake-less surveying, had a nominal trace density of 1,400,000 tr/km2. Target trace density increased 18x compared to the adjacent explosive 3D. Frequency content nearly doubled (Figure 22) with initial processing results indicating that useable angles increased from 45 degrees to 75 degrees. Moving to simultaneous source acquisition would enable even higher trace densities.
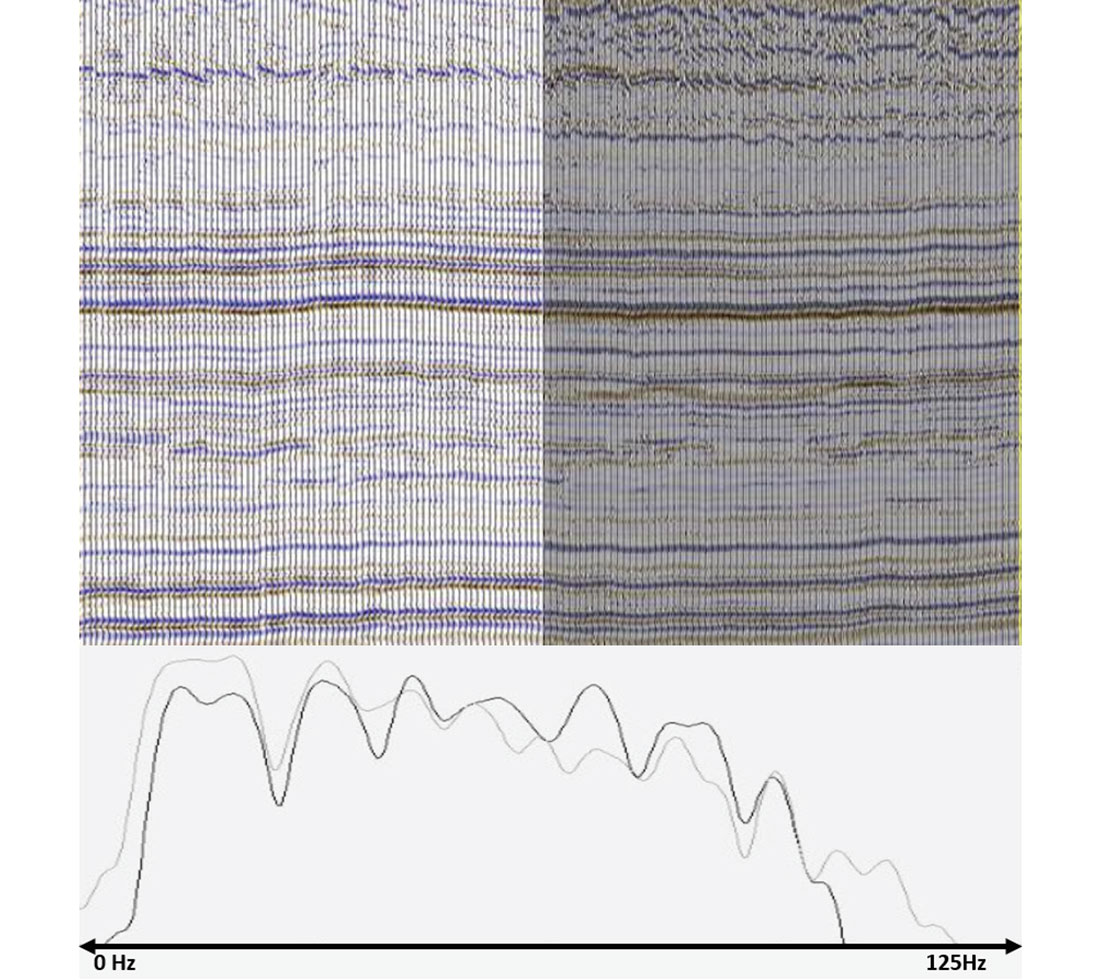
In the final example (Figure 23), both a conventional vibroseis and a simultaneous source vibroseis survey were acquired over the same area with the same high-density geometry (4,000,000 tr/km2 at target; 18,000,000 tr/km2 nominal). Results indicate that despite the added noise from operating vibes simultaneously and the need to deblend the data, the final stack is directly comparable to the conventional data. The key benefit of the simultaneous source survey was that it was acquired 50% faster than the conventional vibe survey.
Conclusions
As seismic acquisition in Canada continues to evolve, it is expected that survey size and data volume will increase exponentially. This will require changes in data management to efficiently handle large volumes during transport, processing, and storage. Although challenging at times to acquire, process, and store, these large datasets result in significant interpretation and inversion improvements leading to more accurate and efficient drilling operations. In summary, here is a short list of benefits and considerations for each of the innovations highlighted in this article:
Low Frequency Geophones
Benefits
- Improved low frequency response
- Better inversion results
Considerations
- Larger geophone (diameter, weight)
- May have a poor response above 150 Hz
Small Vibroseis
Trucks Benefits
- Reduced environmental impact (size, weight, noise)
- Can utilize narrower cut line widths (3 m vs. 4.5-5 m)
Considerations
- Lower clearance – may require additional snow plowing in winter
- Some models may have limited low frequency response
Stake-less Surveying
Benefits
- Faster (no time required for writing on/placing lath/pin flags)
- Reduced cost (no lath/pin flags, faster)
Considerations
- Still need to survey, map, and flag hazards, exclusions, and offsets
- Requires accurate navigation to source and receiver locations
- Difficult to implement in areas with extensive tree canopy
- Implementation methods, costs, and accuracy may vary
- LiDAR is recommended for elevation data
High Density Vibroseis Acquisition
Slip Sweep
Benefits
- Faster than conventional vibroseis acquisition
- Achieve higher trace density for the same and/or reduced costs
- Can utilize cost savings to acquire higher resolution data (smaller station/line interval)
Considerations
- Increased noise (harmonic, vibe)
- May require harmonic noise removal in processing
- May require more equipment than conventional vibroseis to maintain efficient field operations
- Distance and time separation testing recommended for optimal data quality
- Larger data volumes require more storage space
Simultaneous Source
Benefits
- Faster than slip sweep vibroseis acquisition (no slip time)
- Achieve higher trace density for the same and/or reduced costs
- Can utilize cost savings to acquire higher resolution data (smaller station / line interval)
Considerations
- Increased noise (harmonic, vibe, and overlapping shot records)
- May require more equipment than conventional vibroseis to maintain efficient field operations
- Distance separation testing combined with equipment utilization optimization recommended for optimal field operations and data quality
- Requires deblending in processing (can add time to processing flow)
- Extremely large data volumes require more storage space
Compressive Sensing
Benefits
- Higher (reconstructed) trace density for reduced costs
- Better (reconstructed) resolution
Considerations
- Algorithm specific
- Requires reconstruction in processing (can add time to processing flow)

Acknowledgements
Thank you to the following companies for giving permission to share the results and/or for helping to acquire or process the data: Anonymous 1 & 2, Absolute Imaging, BHP Billiton, Crescent Point Energy, Eagle, Earth Signal, Echo Seismic, GeoKinetics, Geo-X, Key Seismic, OptiSeis Solutions Ltd., Pen & Trace Geoservices Inc., SAExploration, and Symroc.


Join the Conversation
Interested in starting, or contributing to a conversation about an article or issue of the RECORDER? Join our CSEG LinkedIn Group.
Share This Article