Coda-wave attenuation is an important criterion for the study of elastic properties of the lithosphere. In this article, attenuation is measured in northeast British Columbia using records from 9 new stations of the Canadian National Seismic Network (CNSN). Our dataset is comprised of 402 earthquakes recorded between August 2013 and January 2017, with magnitudes ranging from 1.5 to 4.7, depths from 1 to 14 km and epicentral distances of 15 to 100 km. The coda-wave attenuation is measured by means of QC based on the single-backscattering model. Coda windows were selected to start at tC = 2tS (two times the travel time of the direct S wave), and were filtered at center frequencies of 2, 4, 8, 12 and 16 Hz. Our study reveals a consistent pattern in the northeast of British Columbia that shows very low Q0 values. Based on our calculations, Q0 varies between 43 and 71 over the range of a2 from 20 to 70 at the new CNSN stations (NBC4, 5, 7, 8 and NAB1) at the western edge of the continental craton. This is consistent with a previous study (Farahbod & Cassidy, 2018) that shows a low average Q0 at the FNBB and BMBC stations (46-76 over the range of a2 from 20 to 70). Those stations were deployed in a region of active hydraulic fracturing operations, suggesting that injections could be a contributing factor for low Q0 values.
Introduction
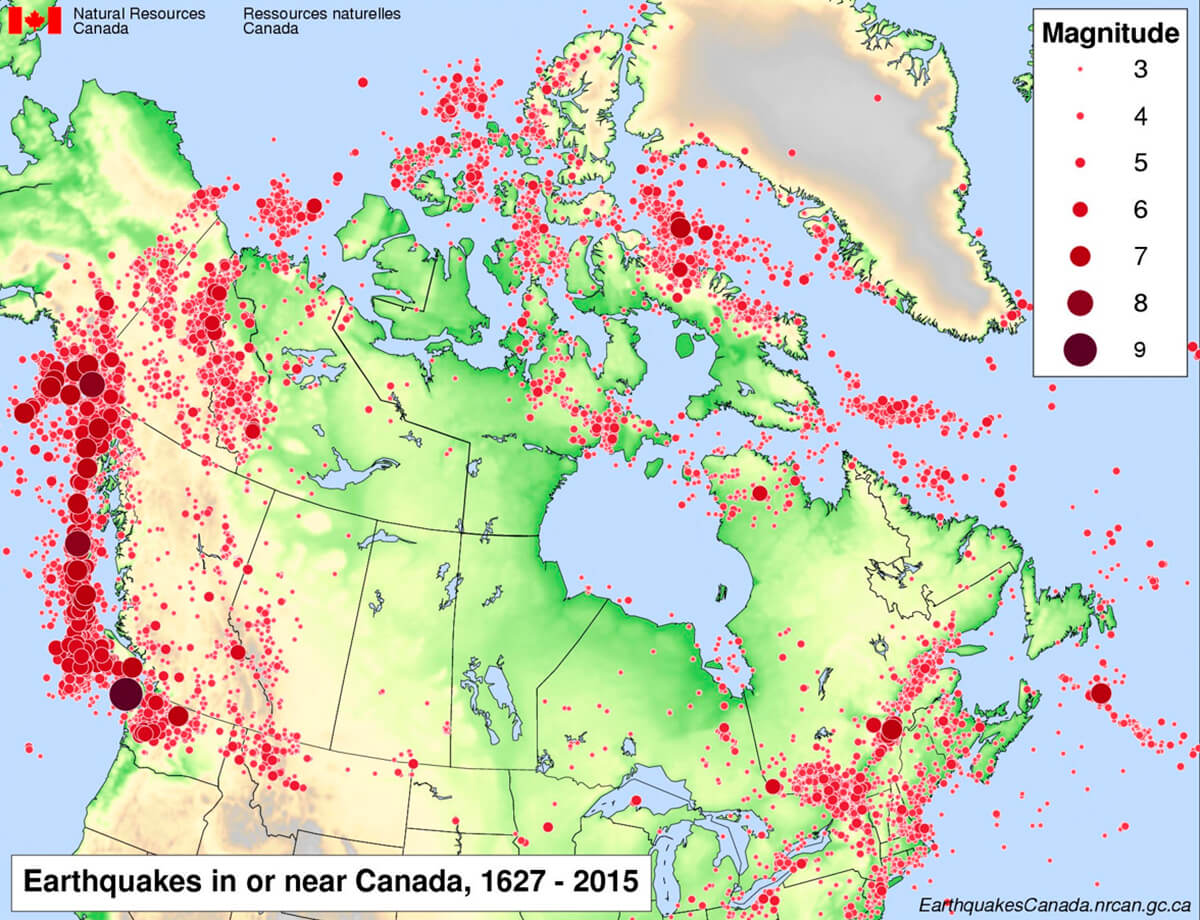
Each year, nearly 2000 earthquakes are located in the province of British Columbia (BC). The majority of these events are located along the Pacific coast, in the offshore region that extends from northern Vancouver Island to Haida Gwaii, or in the Cascadia subduction zone (Figure 1). The west coast of Canada is one of the few areas in the world where all three types of plate movements (convergent, divergent and transform) take place, resulting in significant earthquake activity. Earthquakes in this region occur along the faults in the offshore region (e.g., a magnitude 8.1 Haida Gwaii earthquake of 1949); within the subducting ocean plate (e.g., a magnitude 6.8 earthquake beneath the Seattle-Tacoma region in 2001); and within the continental crust (e.g., a magnitude 7.3 earthquake on central Vancouver Island in 1946). In contrast, the central interior of BC is one of the most seismically quiescent areas of the province. For example, in more than 40 years of earthquake monitoring, few earthquakes have been detected or located in the vicinity of the Nechako basin (Cassidy et al., 2007).
In recent years, detailed coda Q attenuation studies have been conducted in the Cascadia subduction zone of southwestern BC (Farahbod et al., 2016), in the vicinity of the Anahim volcanic Belt in the interior of BC (Farahbod and Cassidy, 2016), and in the eastern Cordillera and westernmost craton (Farahbod and Cassidy, 2018). In this study, we examine seismic attenuation characteristics of northeastern BC based upon seismic data collected by nine new CNSN stations (NBC1-8 and NAB1) from the first operating day in August 2013 until the end of 2016. The single-scattering approximation (Sato, 1977) using S-Wave coda is applied; the attenuation and frequency dependency for different paths and the correlation of the results with the geotectonics of the region will be presented.
Geology and tectonic setting
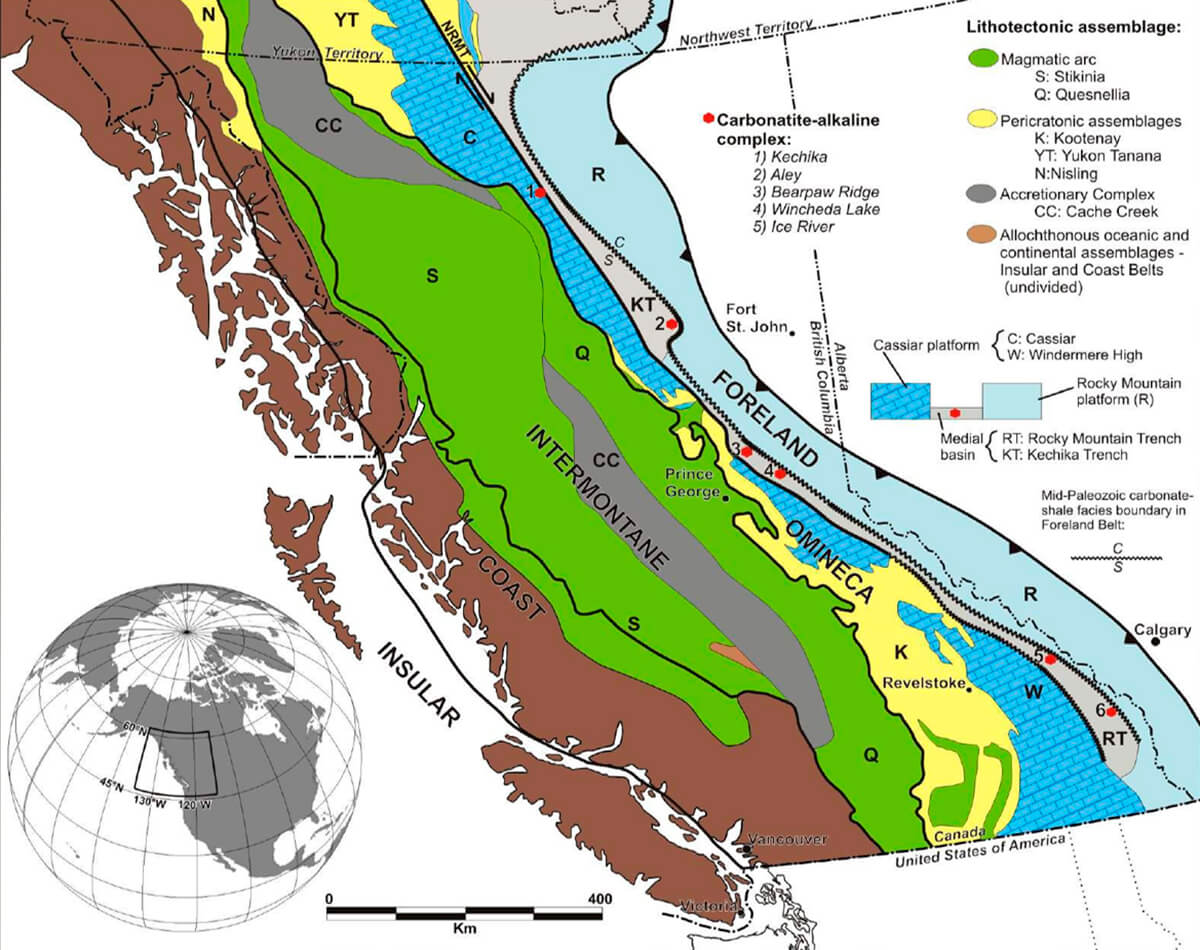
The complex geology of BC is a function of its location on the western edge of the North American continent and the eastern rim of the Pacific Ocean. There are five morpho-geological belts that define the geology of BC from east to west: the Foreland, Omineca, Intermontane, Coast and Insular Belts (Figure 2). Each one has different metamorphic, physiographic, metallogenic and tectonic histories.
The Foreland Belt is composed of weakly metamorphosed sedimentary rocks which are 1.4 billion to 33 million years old. During the breakup of Pangea during the Jurassic (~180 Ma.) the North American continent began to move westward, accreting terranes which lay just off the coast of the continent. These terranes were squeezed between the subducting oceanic lithosphere off the coast of North America and the wedge-shaped North American Craton.
These terranes were squeezed upwards and downwards, which resulted in the detachment of the thick miogeoclinal sequences deposited during the late Proterozoic and Paleozoic from the cratonic basement. These sequences were upthrust onto the edge of the North American Craton forming the Foreland Belt (Welford et al., 2001).
The Omenica Belt is composed of highly metamorphosed, pericratonic (near craton) terranes on the edge of the North American craton not far from the continental margin that are 2 billion to 180 million years old. This belt goes from low hills to high mountains across its length, and today represents the once deeply buried roots of this ancient magmatic arc assemblage (Monger and Price, 2002).
The Intermontane Belt is a flatter, more rounded region where lightly metamorphosed former island arcs and ocean basins accreted onto the continent 180 to 175 million years ago, and were intruded by plateau basalts 10 million years ago. Volcanic activity has been recorded as occurring in the past 10,000 years, including in the Nazko Cone.
The Coast Belt is the suture zone between the Intermontane Belt and the Insular Belt and it contains heavily metamorphosed fragments of both the terranes.
The Insular Belt forms the offshore islands (including Vancouver Island, the Gulf Islands, Haida Gwaii and the Alexander Archipelago in Alaska) and it is the most tectonically active of the belts.
In our study area (northeast BC), Quaternary-aged sediments host natural gas. These reservoirs are likely associated with the valley-fill sediments of incised paleovalleys that have little or no surface expression (Hickin 2009). These same units commonly host water, of which some form artesian aquifers (Hickin 2009). As shale gas plays require large volumes of water for hydraulic fracturing, groundwater aquifers are considered to be an important water source.
The coda Q method
In this study, we determine the coda Q or QC factor for northeast British Columbia using the single-backscattering approximation, which explains the decay of earthquake coda under the assumption of weak isotropic scattering from homogeneously distributed heterogeneities (Aki, 1969; Aki & Chouet, 1975; Sato 1977). The coda waves are assumed to comprise S-to-S backscattered waves which do not produce secondary scattering when encountering another scatterer, and the measured QC depends on both intrinsic and scattering attenuation (Aki & Chouet, 1975; Wu & Aki, 1988). The coda wave amplitude at frequency f, and lapse time t (time from the event origin) is described by
where S(f) is the source factor which is related to the earthquake’s source spectrum and includes station site, backscattering, and source effects (Wu & Aki, 1988). The geometrical spreading parameter ν is 1, 0.5 and 0.75 for body-wave scattering (this study), surface wave scattering, and diffusion, respectively (Aki & Chouet, 1975). Equation (1) assumes that the source and receiver are at the same point, a good approximation only for signals at a lapse time, t, greater than 2 times the travel time of the direct S wave, tS (Rautian & Khalturin, 1978; Sato, 1977). Equation (1) for body waves can be written as
so that QC can be obtained by linear regression of ln(A(f, t)) on t over a coda time window at a constant frequency f. In practice, A(f, t) is obtained by bandpass-filtering the coda signal over a narrow passband centered on frequency f and fitting a time decay envelope to the filtered signal (Rautian & Khalturin, 1978). When many decay curves are available for the same region, all data can be inverted simultaneously to obtain one QC value (Aki & Chouet, 1975; Havskov et al., 1989). Obtaining one Q value for each decay curve and averaging Q-1 values gives the same result (Kvamme, 1985). This latter method has the additional advantages of faster computation and the ability to check the fit to equation (2) to eliminate bad results (Havskov et al., 1989).
Assuming that the coda window starts at t1=2tS, the end time t2 controls the maximum size of the volume sampled by the backscattered waves (Zelt et al., 1999). The sampling volume is one-half of a three-dimensional ellipsoid, with the source and receiver as focal points, semi-major axis a1 = VSt/2 and semi-minor axis a2 = (a12 – R2/4)1/2, where VS is the average S-wave velocity (3.5 km/sec) and R is the station-event separation (Pauli, 1984). For similar a1 and a2, the sampled volume is nearly a sphere and the maximum depth sampled is approximately given by Zmax = a2 +d/2, where d is the event depth (Havskov et al., 1989; Zelt et al., 1999).
Practically, to make meaningful comparisons of QC from different regions, it is important to make estimates of the volumes sampled by different stations. The average sampling volume can be determined by setting t = (t1 + t2)/2 in the equation for a1 (Havskov et al., 1989). Therefore, by varying t2, it is possible to ensure that the volumes being sampled by each event-station combination are approximately the same (Zelt et al., 1999).
Data and Analysis
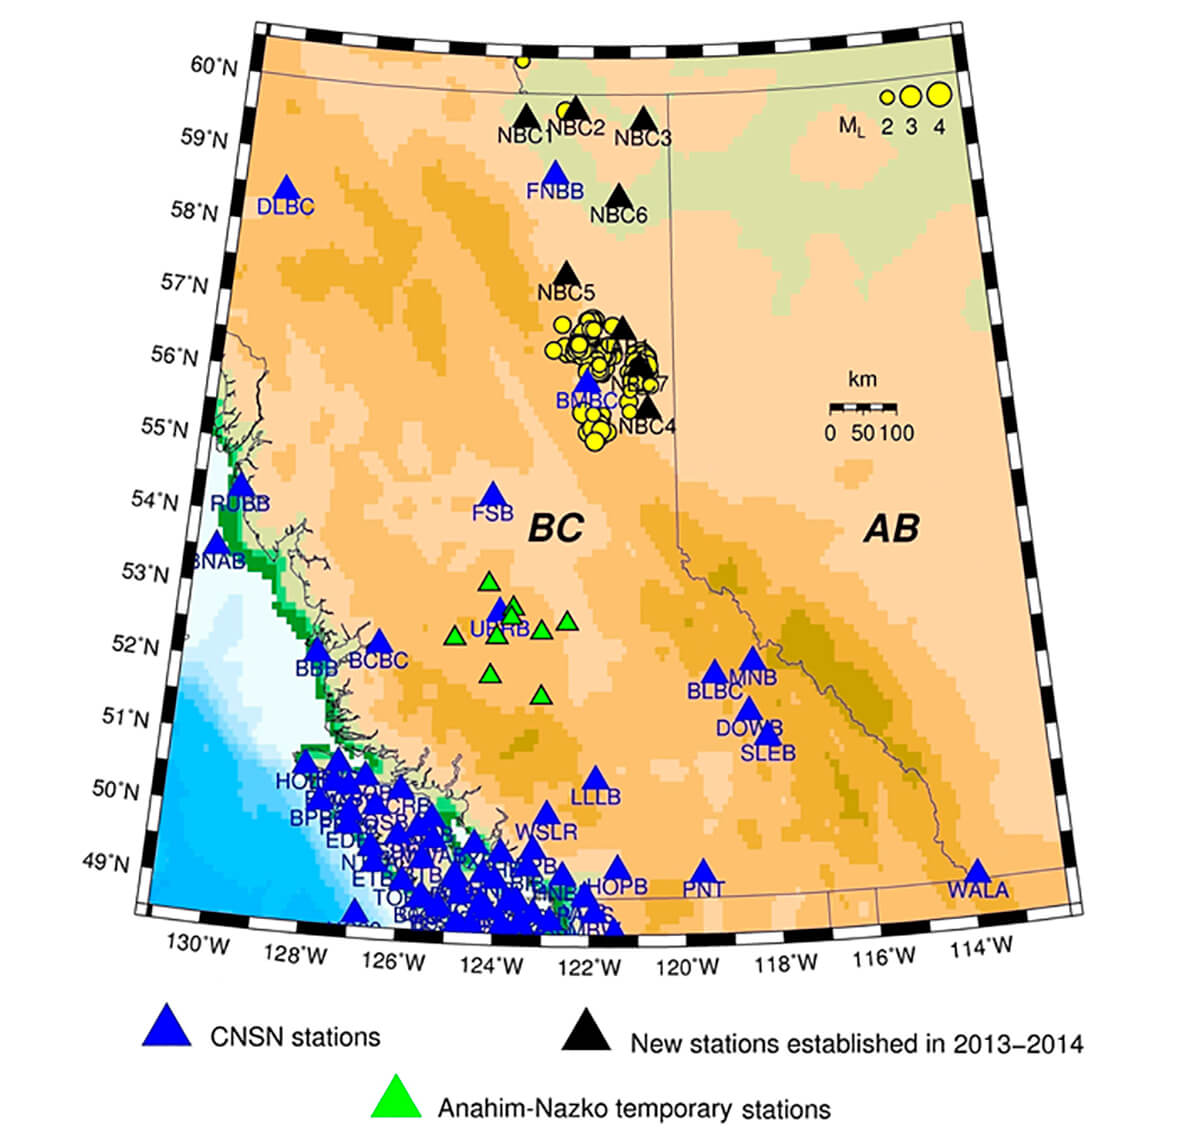
For calculating QC , we used seismic waveform data from 9 CNSN stations (NBC1-8 and NAB1) in northeast of BC. These data have sampling rates of 100 Hz and a flat frequency response from 1 to 16 Hz. We selected earthquakes within 100 km of each seismic station (Figure 3) and our dataset comprises 402 events recorded between August 2013 and January 2017, with magnitudes ranging from 1.5 to 4.7, depths from 0 to 14 km and epicentral distances of 15 to 100 km. This provided a total of 315 high signal-to-noise traces (SN≥5.0) useful for QC calculation; however, the number of traces actually used for analysis depends on sampling size.
The coda window length used in this study is 20 seconds except for epicentral distances less than 30 km, for which it is 10 sec.
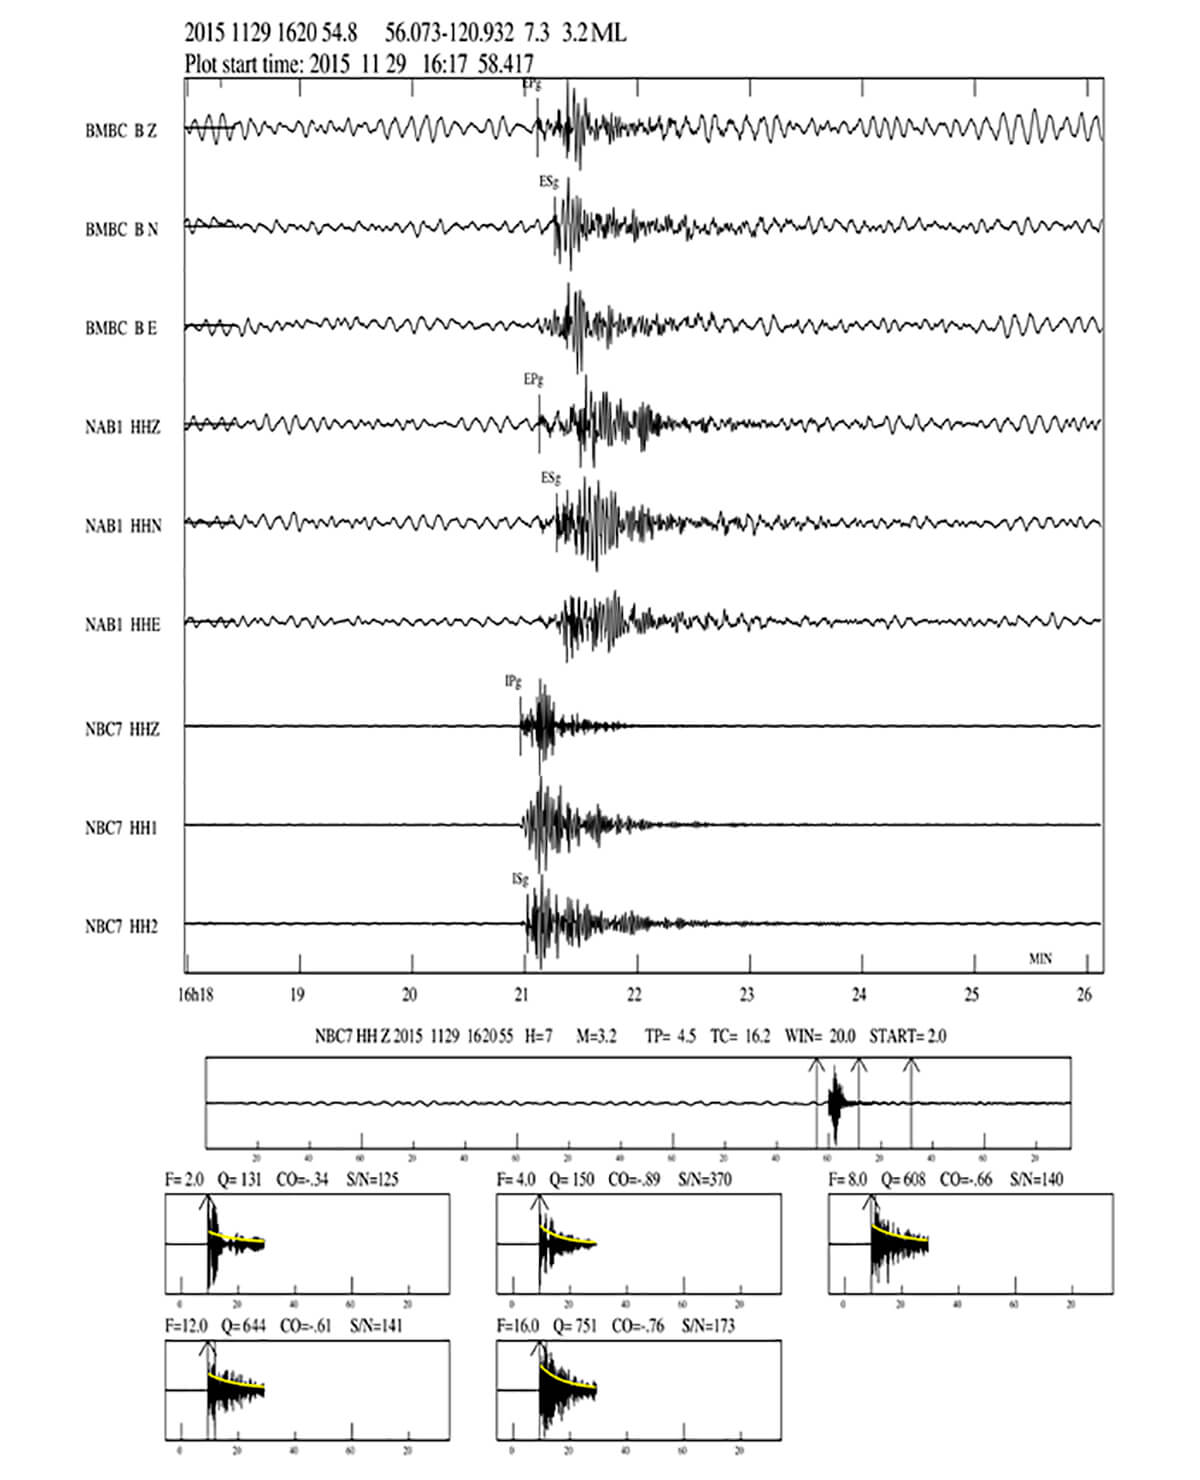
For each event-station combination, we picked P-wave and S-wave arrivals (Figure 4) and relocated earthquakes considering a velocity model used for standard earthquake locations in this region. Then we calculated QC at five frequencies between 2 and 16 Hz using equation (2). The frequency dependence of QC can be expressed as QC = Q0fα (Rautian & Khalturin, 1978); Q0 (QC at 1 Hz) and α, are obtained by linear regression of log (QC) on log (f). For each station, QC is determined by averaging the calculated values from all events.
In general, QC increases with lapse time, which likely is a result of including a greater volume of less complex upper mantle material in the sampling volume (Pauli, 1984 & Zelt et al., 1999). Therefore, in order to reduce sampling size and to ensure that approximately equivalent volumes are sampled at each station used to calculate QC, we fixed a2 and the average of maximum lapse time to specific values. These values are selected based on the location distribution of earthquakes around the stations.
We used the computer program SEISAN (Havskov and Ottemöller, 2012) to calculate coda Q. The program calculates QC for a series of events and stations at five frequencies (2, 4, 8, 12 and 16 Hz). On completion, the average values are calculated and a QC versus f curve is fit to the calculated values (Havskov and Ottemöller, 2010). The program also plots the individual events and filtered coda windows (Figure 4).
Coda Q Results
In order to make a regional comparison of QCover the study area, it is necessary to use the shortest possible event-station paths. This constraint prevents us from selecting all the data with high signal-to-noise ratio. Therefore, we calculated QC at different stations by using different sets of ellipse parameter a2 (20-100 km) and lapse time (12-60 sec), with maximum sampling depth (on average) between 20 km and 101 km (Tables 1 and 2). The corresponding estimated Q0 error for each station with five or more events ranges from 4 to 10 (bold values in Table 1). Error in frequency dependency factor (α) varies between 0.04 and 0.11 (Table 2).
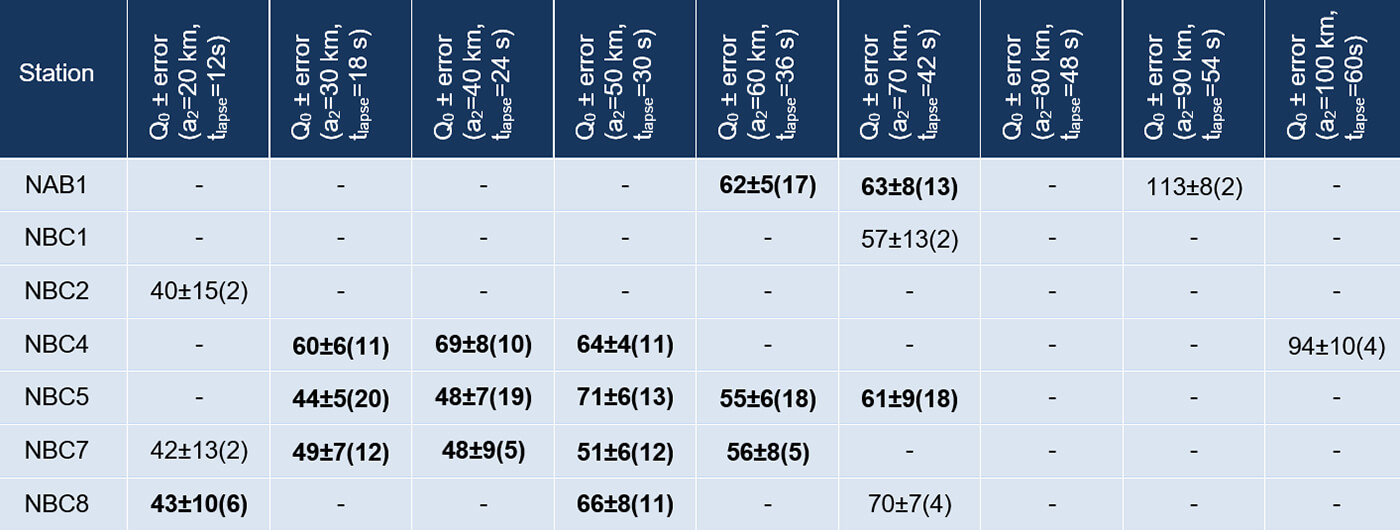
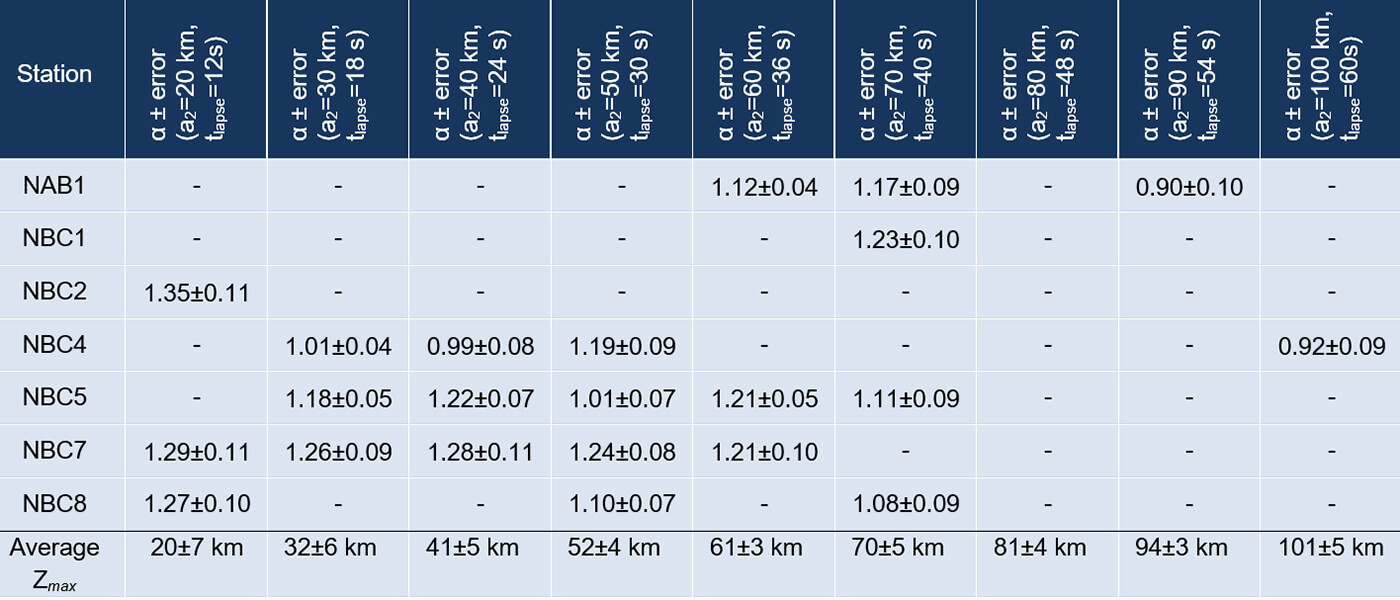
Overall, there is an increase in Q0 values with increasing sampling volume. Our estimated Q0 values (with five or more events used for each estimate) are the lowest at station NBC8 (Q0 = 43, a2=20 km) and the highest at station NBC5 (Q0 = 71, a2=50 km). Less reliable estimates (with at least three events for each measurement) also indicate relatively low Q0 values at station NBC8 (Q0 = 70, a2=70 km) and NBC4 (Q0 = 94, a2=100 km). Due to lack of seismicity reports within 100 km of NBC3 and NBC6 for the time interval of this study, we don’t have any QC estimates for these stations. Comparing the distributions of Q0 and α, an inverse correlation is observed over all the study area.
Summary and conclusions
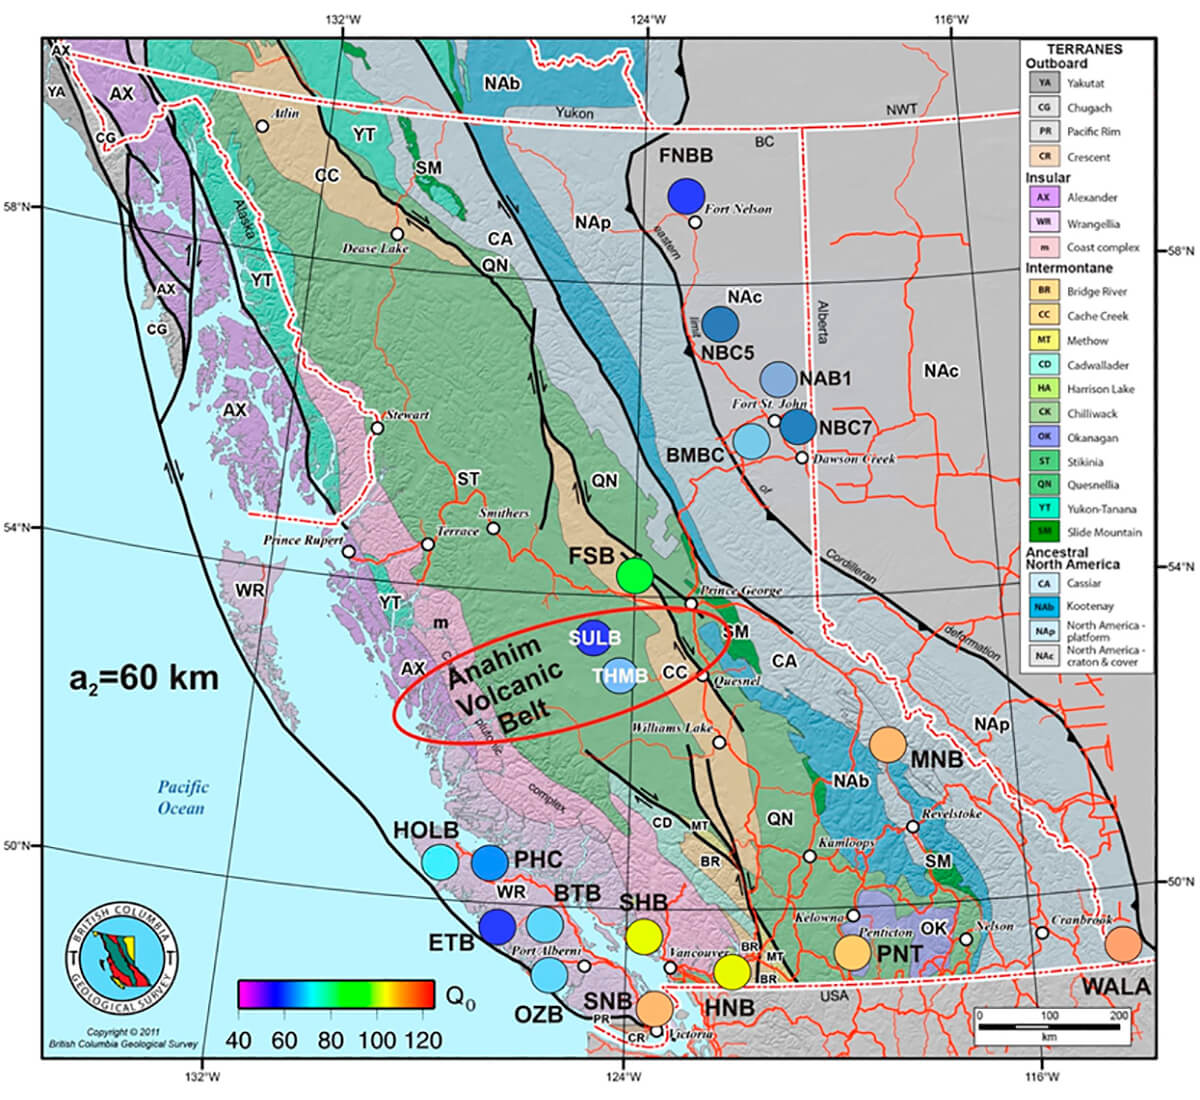
We investigated coda-wave attenuation in northeast BC and the westernmost continental craton using the single-scattering approximation on records of the regional CNSN. In the previous studies (Farahbod et al., 2016; Farahbod and Cassidy, 2016 & 2018), QC was estimated for
stations in a vast area covering a wide range of tectonic settings (Figure 5). The lowest Q0 of 39 (a2=30-35 km, Nazko temporary station MCMB1) was observed in the Anahim volcanic belt. The highest Q0 of 165 (a2=90 km, station WALA) is on the western flank of the stable North America craton (NAc). We note that Woodgold (1990) found very high values of Q0 (480-770) in the stable craton of eastern North America. Other high Q0 values are observed mainly in the North America platform (NAp, Figure 5) in eastern BC. In contrast, stations in northeast BC, including FNBB, BMBC and the new stations, are exceptional, and despite a fairly stable location on the NAc, they represent relatively low Q0 estimates. There is a general consensus that the observed seismicity around FNBB in the Horn River Basin is mainly induced or triggered by hydraulic fracturing operations (Farahbod et al., 2015). This technique, which injects pressurized liquid into rock formations to create artificial fractures, is commonly used in northeast BC in recent years to extract unconventional oil and gas.
We note that oil and gas extraction began in the 1950s in the Montney basin (around station BMBC, NBC4, 5, 7, 8 and NAB1) using conventional methods. More recently, hydraulic fracturing operations and waste water injection have triggered and induced many events in this area as well. These earthquakes are mainly characterized by very shallow depth and are located near injection wells.
There are similar reports of induced seismicity from other parts of the world. For example in China, many earthquakes are induced by water injection near oil fields (Genmo et al., 1995). These earthquakes are characterized by low stress drop and low Q value (between 45 and 118). This implies that the earthquakes are caused by brittle fracture of weaker rocks under low ambient stresses, due to a decrease in their strength resulting from injection of water (Genmo et al., 1995).
In this study, our Q0 estimates at the new CNSN stations (NBC4, 5 and 7) and also at BMBC (Farahbod and Cassidy, 2018) in the range of a2 between 30 and 70 km, are among the most reliable results in BC, in terms of the number of observations. Q0 values are fairly constant in the range of a2= 50-70 that is different from most of the other Q studies, which in general indicate higher Q with increase of lapse time. Spatial coincidence of these stations with the areas of active hydraulic fracturing operations seems to suggest that injections could be a contributing factor. However, we do not rule out that the increasingly thickened sediment section toward the Canadian Cordillera can also contribute to the observed high seismic attenuation.

Acknowledgements
We gratefully acknowledge the sources of seismic data used in this study: the Nechako POLARIS array (funded by Geoscience British Columbia, Natural Resources Canada, and the British Columbia Ministry of Energy, Mines, and Petroleum Resources); and the Canadian National Seismograph Network (operated by the Canadian Hazards Information Service). Technical assistance from Ryan Visser is greatly appreciated. This research is partially supported by NRCan’s Induced Seismicity Research Project. This paper is NRCan contribution 20190300.


Join the Conversation
Interested in starting, or contributing to a conversation about an article or issue of the RECORDER? Join our CSEG LinkedIn Group.
Share This Article