The Exploration Geophysics Laboratory (EGL) is an industry-funded consortium positioned inside the Bureau of Economic Geology, a major structural component of the Jackson School of Geosciences at The University of Texas at Austin. The research focus of EGL is to develop and apply multicomponent seismic technology that will assist the evaluation and exploitation of subsurface energy resources. EGL, like other academic groups that do research in multicomponent seismic topics, is often puzzled and disappointed at the slow pace at which S-wave reflection technology is being integrated with conventional P-wave seismic technology to improve the understanding and characterization of geologic targets. EGL concludes there are two fundamental factors that contribute to industry reluctance to utilize S-wave seismic data:
- The additional cost of acquiring S-wave data to complement P-wave data often cannot be justified, and
- Conventional S-wave sources (e.g. horizontal vibrators) cannot be deployed across many prospect areas. For instance, horizontal vibrators cannot be used across surfaces where swamps, marshes, dense timber, or severe elevation changes dominate the landscape.
We at EGL have launched an effort to eliminate these two barriers to using S-wave reflection seismology. Our approach is to utilize direct-S modes produced by common P-wave seismic sources.
Direct-S Modes Produced by P-wave Sources
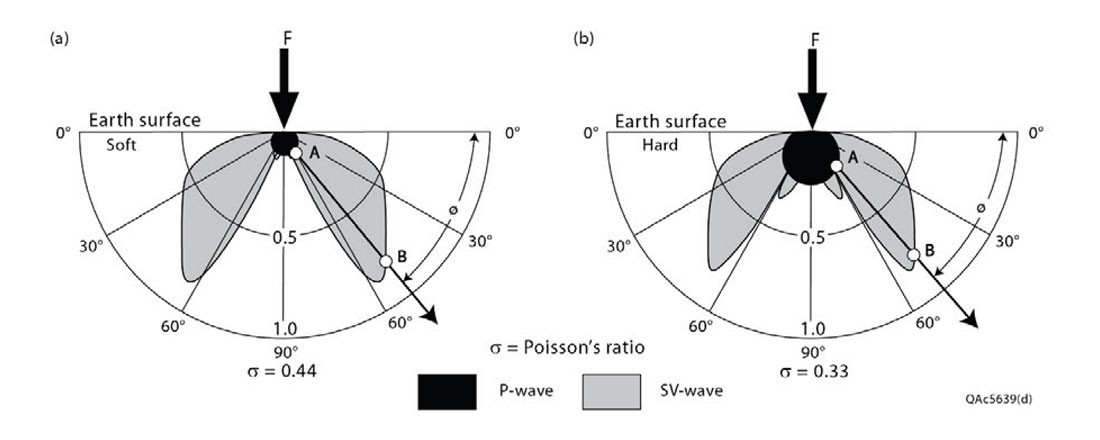
The fundamental physics of P and S radiation from a vertical-displacement source (i.e. a P-wave source) is illustrated in Figure 1. This theoretical insight has been in the geophysical literature since at least the 1950’s and can be easily replicated by any modeling code that creates full-elastic illumination by a vertical source-displacement vector. The calculation in Figure 1 shows that even though we refer to vertical-displacement sources as “P-wave” sources, these sources actually produce more illuminating S energy than they do illuminating P energy. Sources that create vertical displacements include vertical vibrators, vertical impacts, and shot-hole explosives, all of which are common P-wave sources. Thus a logical question is “Why are we not utilizing the direct-S modes produced by these P-wave sources?”
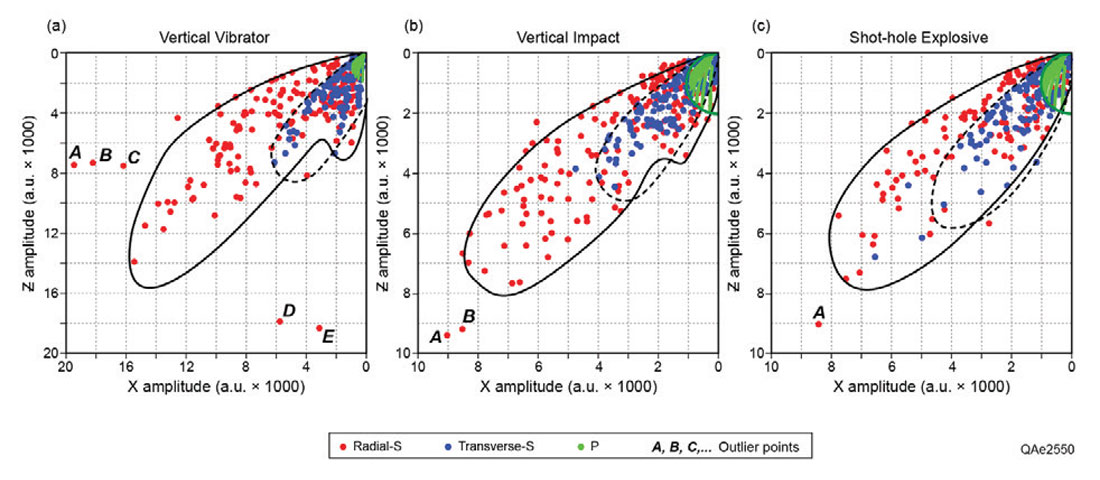
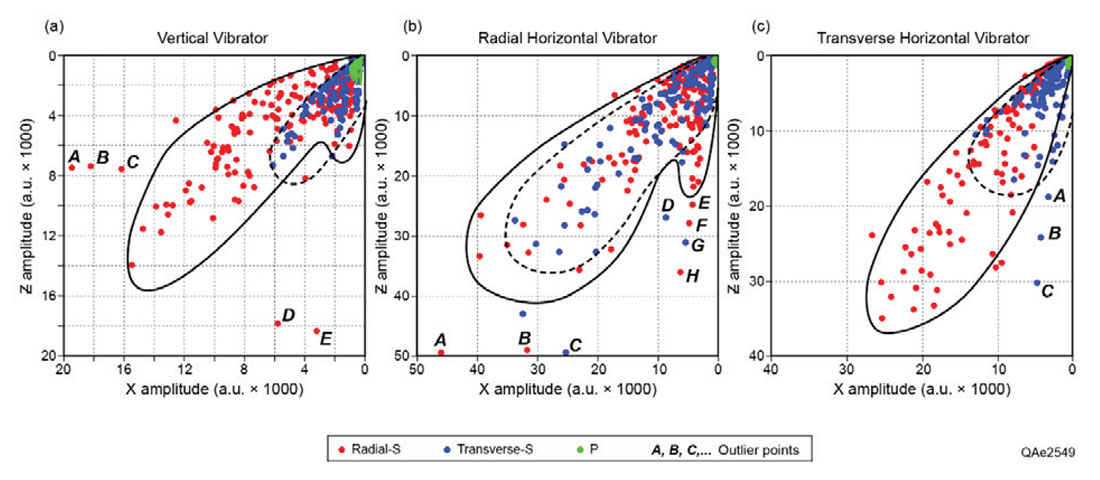
We at EGL have conducted numerous source tests to document the physics of direct-P and direct-S radiation produced by P-wave sources. Some of our test results are illustrated in Figures 2 and 3. In our work, we use the term direct-S to refer to S modes that are produced directly at P-wave source stations. These direct-S modes must be distinguished from SV modes produced by P-to-SV conversion at interfaces remote from a source station. The data in Figures 2 and 3 were generated by recording walkaway VSP data with a 24-station vertical array of 3C geophones. Vertical vibrators, inline horizontal vibrators, crossline horizontal vibrators, vertical impacts, slanted impacts, and shot-hole explosive sources occupied exactly the same source stations in these walkaway tests, and all data were recorded in a 1-day period without unlocking and repositioning any downhole 3C geophone. The data in Figure 2 verify that all P-wave source types generate direct-S modes, and that these direct-S modes are much more energetic than their companion direct-P mode. Note that the data in Figure 3 show that the direct-S radiation pattern produced by a vertical vibrator is essentially the same as the direct-S radiation patterns produced by the “gold standard” direct-S sources – inline and crossline horizontal vibrators.
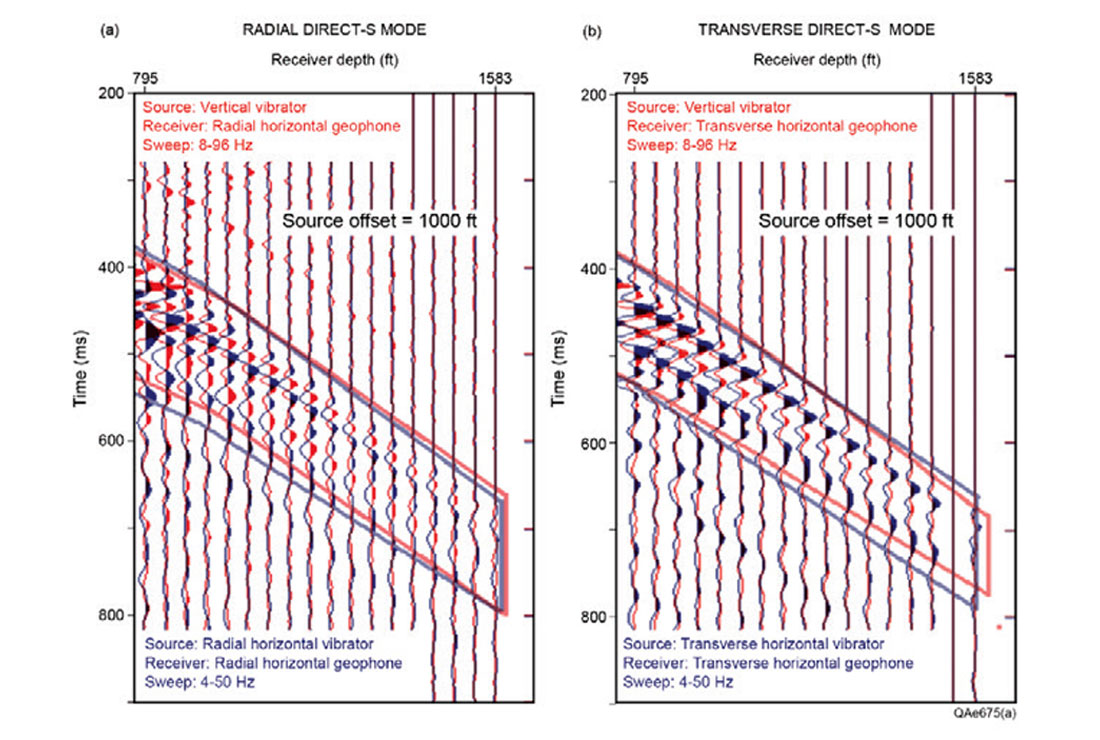
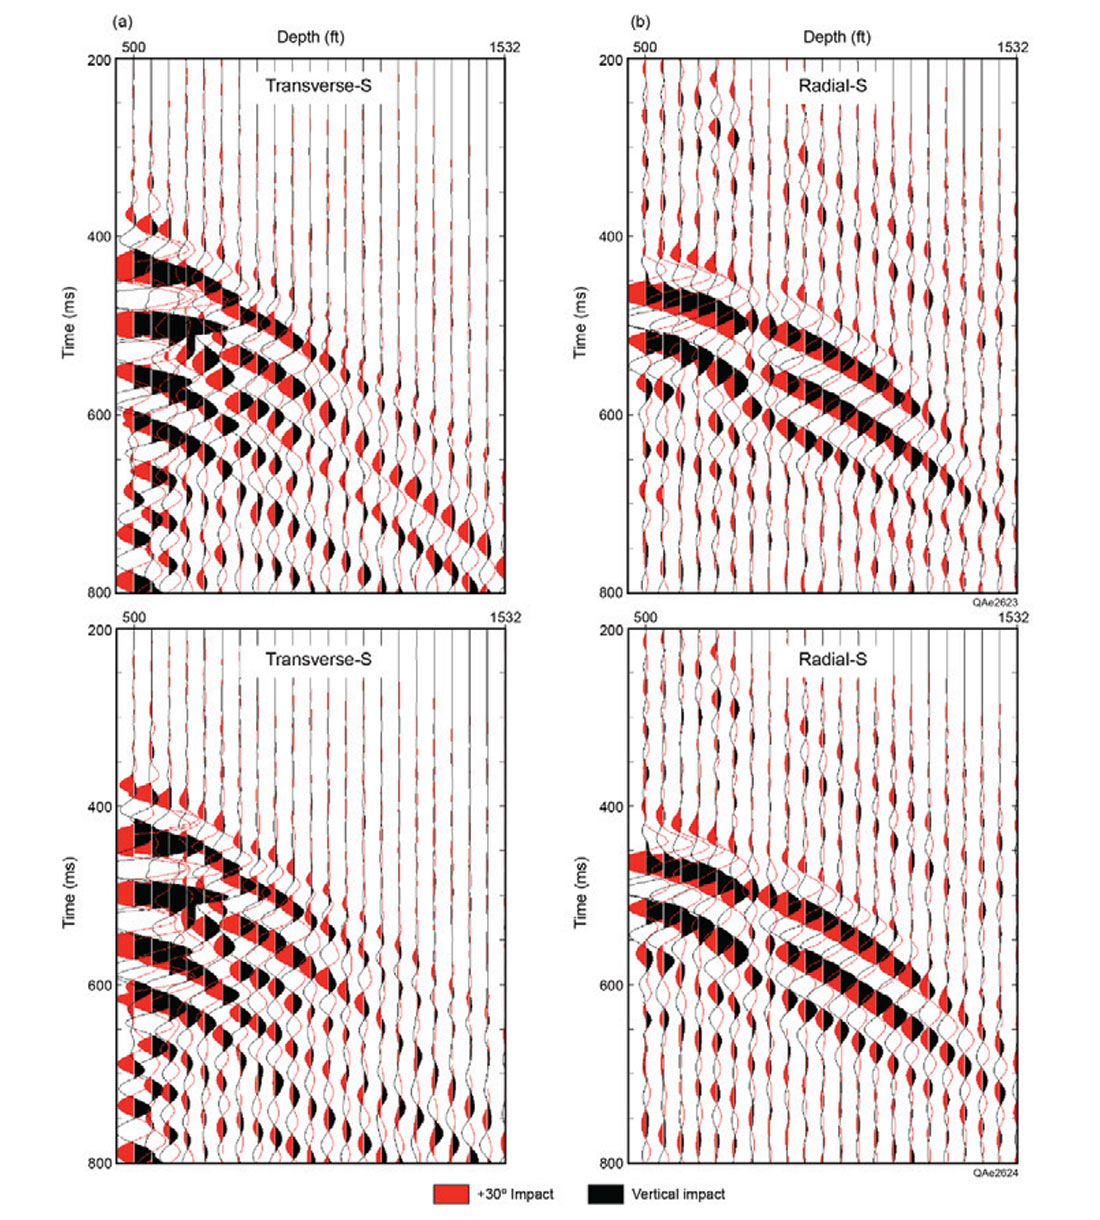
Most geophysicists believe there are two gold-standard direct-S sources: (1) horizontal vibrators, and (2) inclined impacts. When inclined-impact sources are used, the wavefield produced by a left-inclined impact is subtracted from the wavefield produced by a right-inclined impact. This subtraction cancels those portions of the wavefields that are generated by the vertical component of each source displacements and adds the wavefields generated by the two horizontal displacement components. We have compared direct-S modes produced by these two gold-standard direct-S sources with the direct-S wavefields produced by their equivalent vertical-displacement sources. These comparisons are shown in Figures 4 and 5. The data in Figure 4 show that the direct-S wavefield produced by a vertical vibrator is almost an exact peak-for-trough match with the direct-S wavefield produced by a horizontal vibrator. The two direct-S wavefields have opposite phase in Figure 4a only because the author pointed the headlights of the horizontal vibrator in the wrong direction when these data were recorded. My bad. Similarly, the data in Figure 5 show that the direct-S wavefield produced by a vertical impact is essentially an exact peak-for-trough match with the direct-S wavefield produced by left and right slant impacts. As a result of our extensive field tests, EGL concludes there is essentially no difference in the direct-S mode illumination produced by a gold-standard direct-S source (which applies a pure horizontal displacement to the earth) and the direct-S mode illumination produced by its equivalent P-wave source (which applies a vertical displacement to the earth).
Many other real-data source tests have been acquired to compare direct-S modes produced by: (1) point P-wave sources and large-array P sources, and (2) explosives buried at different depths. Presently these latter test data are being shared only with the companies that sponsor EGL.
Application to Unconventional Reservoirs
One study has been done by EGL to demonstrate how direct-S modes produced by P-wave sources can be used to evaluate Wolfberry unconventional reservoirs in the Midland Basin of west Texas. Examples of this work are displayed as Figure 6 through 8. The energy source that generated these data was an array of three inline vertical vibrators. Data were recorded with 3C point receivers and with 110-ft linear arrays of vertical geophones, and different stacking folds were used to construct fold-dependent images. Important conclusions provided by comparing trace gathers and images created with these various source, receiver, and fold options are being documented for EGL sponsors.
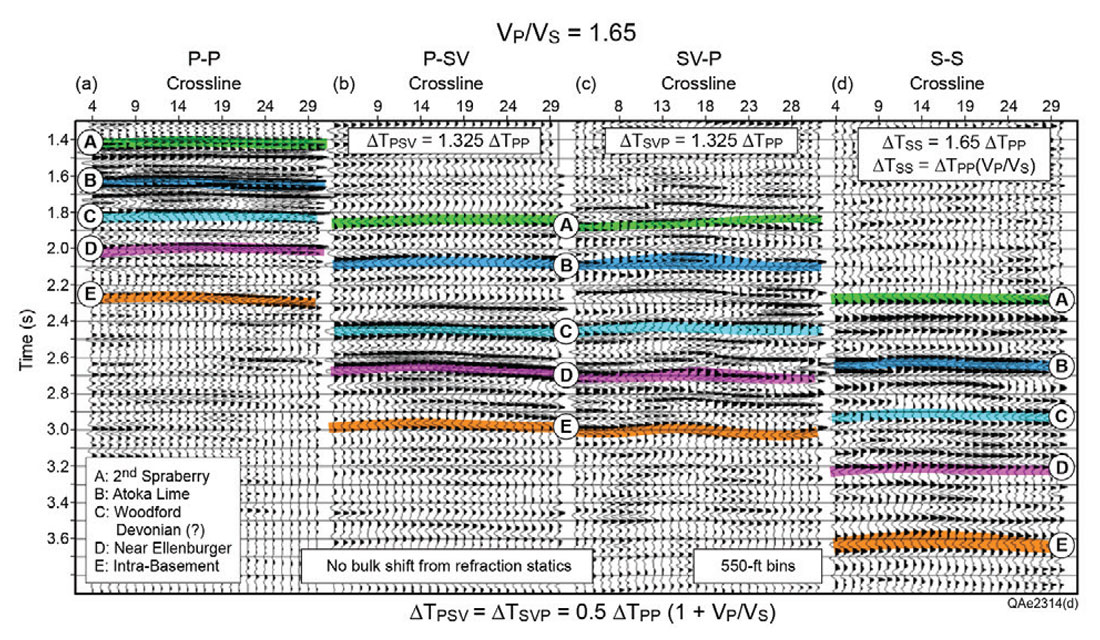
The data in Figure 6 illustrate four Wolfberry images made in this study. Common industry practice is to use only the downgoing direct-P mode as the illuminating wavefield and to make only the two images illustrated in Figures 6a and 6b (P-P and P-SV). However, when the downgoing direct-SV produced by the vertical vibrators is included in the data-processing strategy, the two additional images in Figures 6c and 6d can be made (SV-P and S-S). EGL is particularly attracted to the SV-P mode (Figure 6c) because these data exist in common P-wave data acquired with only vertical geophones. This attractive situation results because the upgoing P of SV-P is recorded by the same vertical geophones that record the upgoing P of P-P data. The SV-P mode provides the same image and the same S-wave attributes as does the P-SV mode that is acquired with horizontal geophones. In our work, we find that SV-P data always have better signal-to-noise and a wider frequency spectrum than do their companion P-SV data. We tentatively conclude this difference in real-data SV-P and P-SV images occurs because: (1) the illuminating SV wavefield produced by a P-wave source is more robust than the illuminating P wavefield (Figure 1), and (2) vertical geophones (which record SV-P) couple to the earth better than do horizontal geophones (which record P-SV).
The Wolfberry unconventional reservoir system consists of a vertical stack of turbidites and debris-flow units that have varying percentage mixtures of matrix minerals and porosities that are commonly in the range of 2 to 3 percent. At our study site, the stack of low-porosity, low-permeability turbidite units spanned a vertical distance of 2000 ft (610 m).
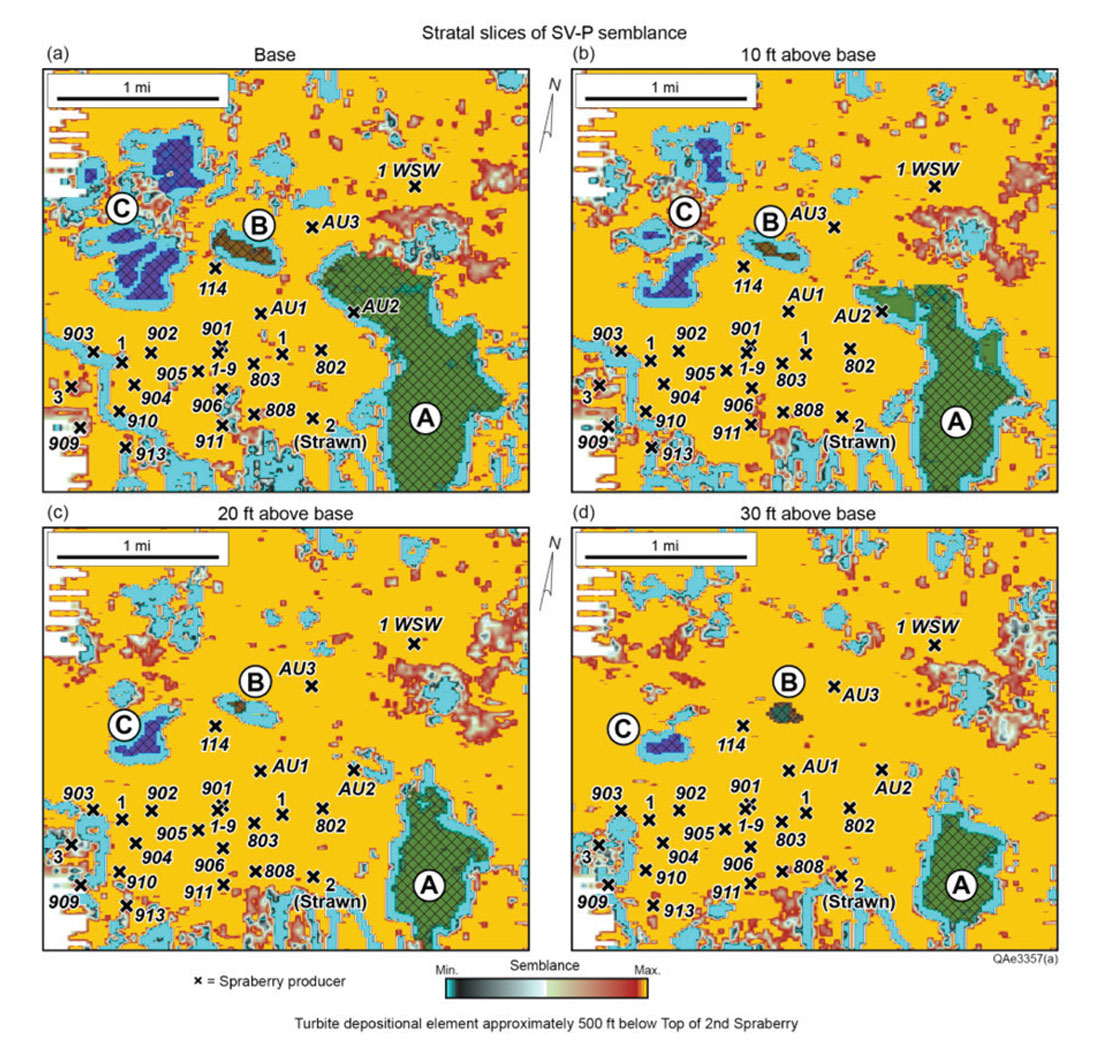
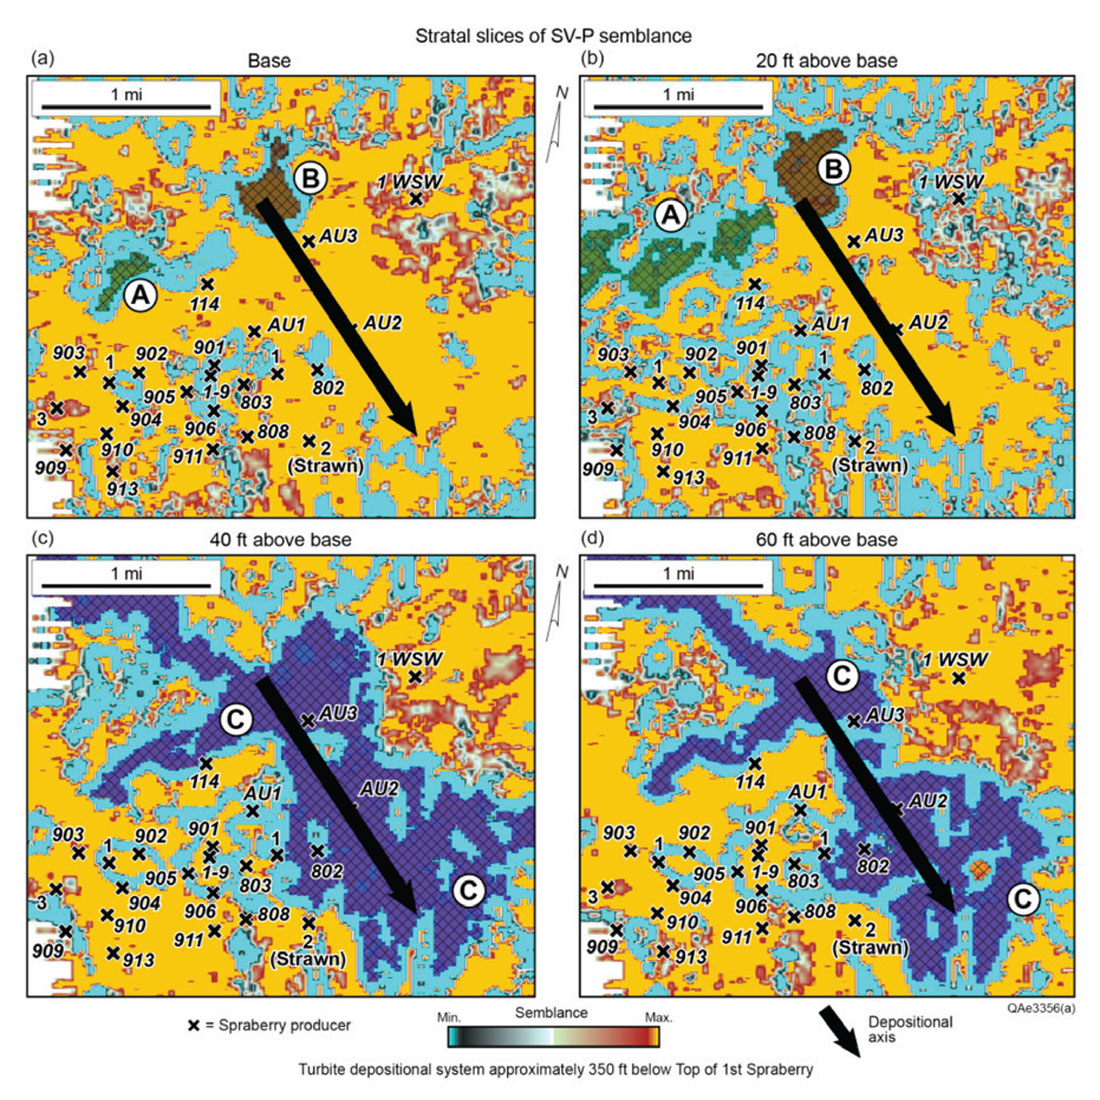
The data in Figure 7 show stratal slices through a semblance volume of SV-P data that relate to one turbidite system. These maps of SV-P semblance behavior show individual depositional units A,B,C at vertical increments of 10 ft (3 m) that start at the base of the system (Figure 7a) and end 30 ft (9 m) above the base (Figure 7d). This map sequence indicates A,B,C are mounded features because their cross-sectional areas decrease as strata slices move upward from the base level of the system. These depositional units have geometries expected for turbidite units. For example, unit A is approximately 1.5 mi (2.4 km) long, 0.5 mi (0.8 km) wide, and 40 ft (12 m) thick. The example in Figure 8 is similar. This succession of SV-P semblance maps shows a second interpreted turbidite system. Unit C is extensive, being approximately 3 mi (5 km) long and 80 ft (24 m) thick. Unit C is also mounded because its cross-sectional area decreases as the unit is examined at higher distances above its base (Figures 8c and 8d). In contrast, units A and B are not mounded, but are fills in depositional lows in the seafloor, because their cross-sectional areas increase (not increase) as they are viewed at higher elevations from their base (Figures 8a and 8b).
Summary Observations
The data in Figures 7 and 8 are extracted from what we at EGL believe is the first public example of a 3D SV-P data volume. The data are unique not only because they are (apparently) the first-ever 3D SV-P data volume, but because they were produced by a P-wave source (vertical vibrators) and recorded with vertical geophones.
S-wave data acquisition with P-wave sources provides attractive advantages. First, the cost of direct-S data acquisition is reduced when S data are acquired with P-wave sources. It is no longer necessary to deploy two orthogonal horizontal-displacement sources to generate direct-S data unless one wishes to do so. The cost of S-S data acquisition is thus reduced by a factor of 3X because the number of deployed sources is reduced from three to one. Second, direct-S seismic programs can be implemented across any area where P-wave seismic programs can be done. Third, the number of direct-S sources is increased by several 100’s literally overnight because P-wave sources are available everywhere. In contrast, horizontal-displacement sources are sparsely distributed around the globe.
Although the source-side of S-S data acquisition is simplified by utilizing P-wave sources, the receiver-side of S-S data acquisition is unchanged. It will still be necessary to deploy 3C sensors to acquire S-S data when P-wave sources are used just as it is when horizontal- force sources are used. However, even the receiver requirement can be simplified in situations where the only direct-S mode that is needed is SV-P because SV-P data are recorded by vertical geophones. When adequate S-wave information can be provided by SV-P data, data acquisition uses exactly the same equipment that is used to acquire P-wave data – a vertical-force source and vertical geophones.
EGL has concluded that SV-P data are an excellent choice for providing lower-cost S-wave information to the global seismic community. The attraction of the SV-P mode is based on the following facts:
- The seismic sources needed to generate SV-P data are common P-wave sources that are widely spread around the globe.
- SV-P data are recorded by vertical geophones. In contrast, P-SV data must be recorded by horizontal geophones, which requires that 3C geophones be deployed. There can be significant cost savings in data-acquisition when data are acquired with vertical geophones rather than with 3C geophones.
- There is a huge amount of untapped SV-P data in legacy P-wave seismic data preserved in seismic-data libraries in many countries. For some prospect areas, operators may be able to produce valuable S-wave images from legacy P-wave data and not even have to acquire new seismic data.
The combination of these facts leads to the conclusion that a focus on SV-P data should be a low cost and widely available way to provide S-wave information to the global seismic community.

Acknowledgements
Fasken Oil and Ranch Ltd provided the data across the Wolfberry unconventional reservoirs we studied. FairfieldNodal processed those data. The author and The University of Texas at Austin are part owners of VertiShear, a company that licenses technology based on the P-wave source concepts discussed here. The terms of this VertiShear ownership have been reviewed and approved by The University of Texas at Austin in accordance with the University’s policy on objective research. Any seismic data-processing company interested in providing this new S-wave imaging technology to clients can contact the author for licensing information. Any company interesting in applying this new S-wave imaging concept can contact the author for advice, expanded information, or recommendations about licensed data-processing shops.
Related Reading


Join the Conversation
Interested in starting, or contributing to a conversation about an article or issue of the RECORDER? Join our CSEG LinkedIn Group.
Share This Article