A dynamite 3D VSP survey, a Vibrator 2D VSP survey and related calibration surveys at the Aquistore CO2 storage site in Saskatchewan served as a technology test for distributed acoustic sensing (DAS). DAS data was acquired as a vertical seismic profile (VSP) on two codeployed fibers, one single-mode (SM) and one multi-mode (MM), simultaneously with a 60-level 3-component wireline geophone array. A 2D grid of explosive shots, used for baseline 4D surface seismic, provided 3D-VSP data from all sensors, while vibrator sources were used for a single 2D VSP line. The DAS fibers were cemented in place on the outside of the well casing during the original well completion and extend to a depth of ~2.8 km. Good quality data was acquired by all systems with comparable SM and MM VSP results. DAS data converted to particle velocity and geophone data have comparable responses. Both explosive and vibroseis source types give good quality DAS data with expected improvement from two versus one vibroseis source. We observe variable coherent borehole noise attributed to variable cement quality. Good quality and comparable migrated images are obtained from DAS and geophone data. Following these tests, we conclude DAS 3D VSP is a viable candidate for time-lapse monitoring.
Introduction
Located in south-eastern Saskatchewan, near Estevan, Aquistore is Canada’s first deep saline carbon dioxide (CO2) storage project. Managed by the Regina-based Petroleum Technology Research Council (PTRC), Aquistore is the storage component of SaskPower’s Boundary Dam Carbon Capture and Storage (CCS) integrated demonstration project, and is one of a handful of active CO2 storage projects in the world. It is designed to be both an important demonstration project and a critical research site and industrial laboratory.
The Aquistore storage site is a 3 x 3 km area of reclaimed pasture located three kilometers west of the Boundary Dam plant (Figure 1a). Two 3.4 km deep wells at the center of the Aquistore site, one for injecting CO2 and the other for monitoring the CO2 plume, were drilled 150 m apart with instrumentation installed behind casing in each well. The target reservoir for Boundary Dam’s industrial CO2 storage is at 3.2 km depth. The reservoir comprises the lower Winnipeg and Deadwood formations which constitute a 150 m thick Cambrian sedimentary layer with briny pore fluid.
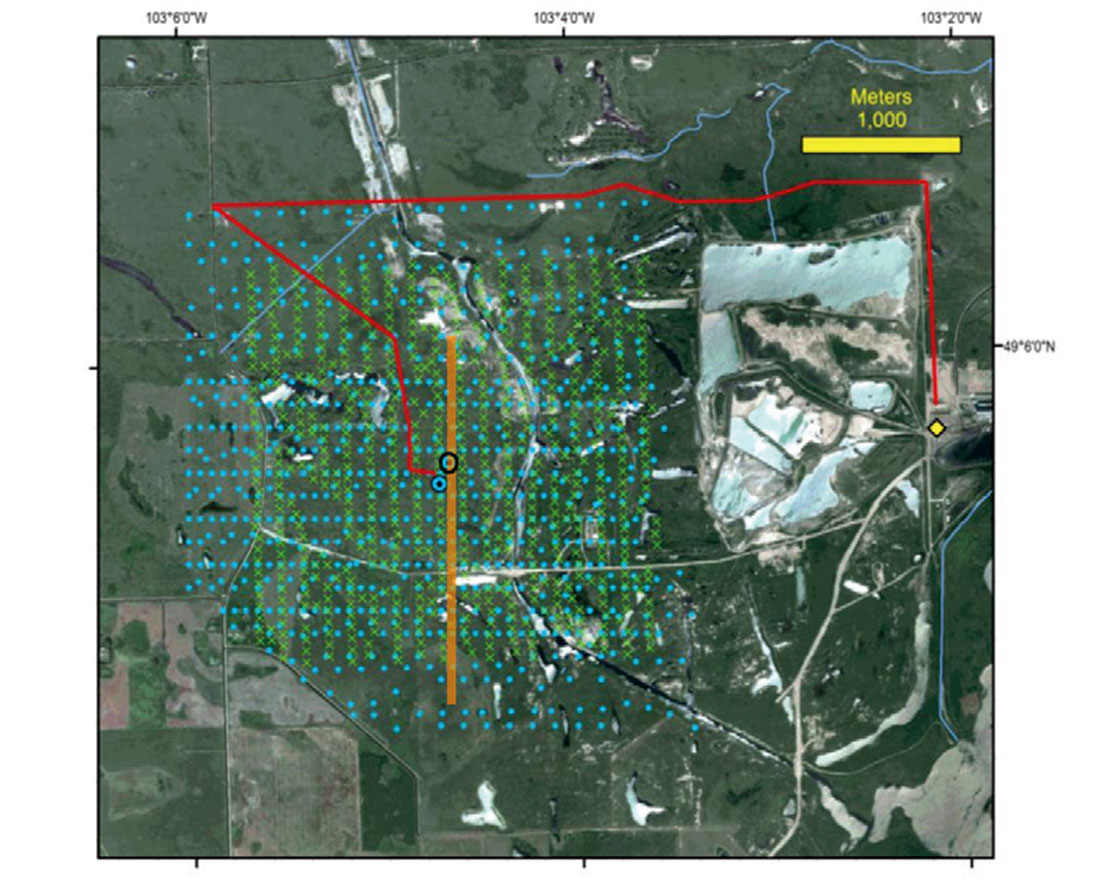
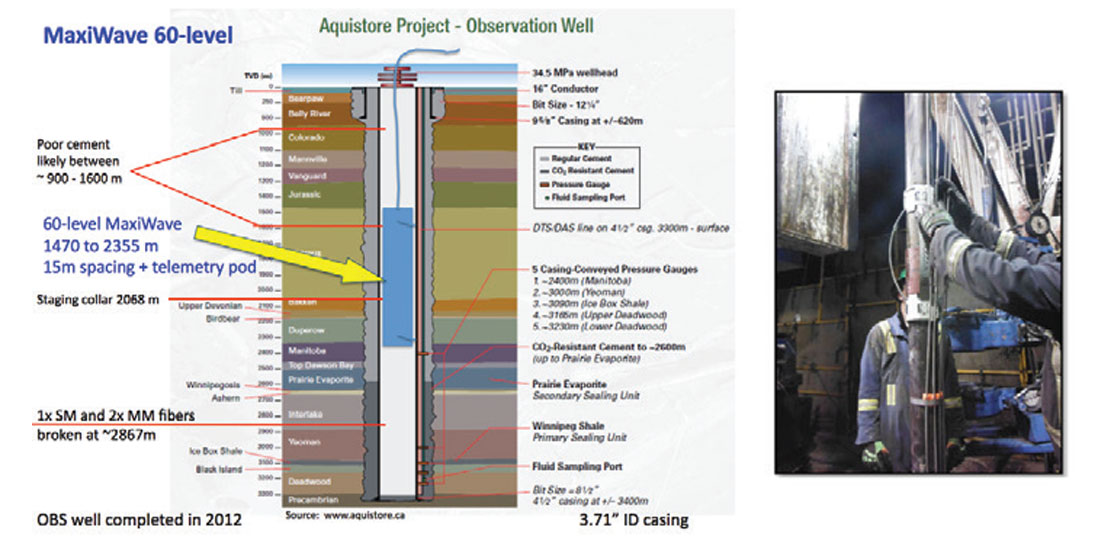
Multiple instrument lines were deployed on casing during the observation well installation in November 2012 including a fiber-optic cable containing one multi-mode (MM ) fiber loop for distributed temperature sensing (DTS) measurements and one single-mode (SM) fiber for telemetry to downhole gauges and for performing distributed acoustic sensing (DAS) measurements. The bottom section of the fiber cable was damaged during the well casing installation, causing overall shortening of both the SM and MM fibers in the cable and the severing of the lower MM fiber loop. Optical time-domain reflectometry (OTDR) tests confirmed that the resulting three single-ended fibers (1x SM and 2x MM) in the observation well are continuous and remain fully functional to a depth of nearly 2.8 km. Figure 1b shows a schematic of the observation well and the local geological formations together with a photo of the casing deployment.
Data Acquisition
An important aspect of the project is the effort to characterize and monitor the injection process using time-lapse 3D seismic. Seismic activities are expected to contribute to geological characterization of the CO2 storage reservoir, demonstrate the safety of the injection process, and provide ongoing verification of the security of the injected CO2. Given the great depth of the Aquistore reservoir and the limited areal extent expected for the CO2 plume, there will be a significant challenge for time-lapse seismic monitoring. However, the increased thickness of the reservoir, its clastic composition (sandstone rather than carbonate), and the presence of a single resident pore fluid (brine) all bode well for application of time-lapse seismic methods for monitoring.
An initial set of VSP recordings with the Silixa intelligent distributed acoustic sensor (iDAS™) system was made during a baseline surface seismic survey conducted in May 2013. Based on the results of the initial survey, a more elaborate set of recordings was made in conjunction with a repeat baseline surface seismic survey in November 2013 (Harris et al, 2015, Harris, et al, 2016). Consistent with Aquistore’s stated goal of functioning both as a demonstration project and a critical research site and industrial laboratory, the November surveys included a wide range of comparison studies. In the sections that follow, we highlight conclusions drawn from some of these comparisons.
The data recorded in November 2014 included simultaneous acquisition of single-mode fiber DAS VSP data for the full 3D surface explosive survey and of multi-mode fiber DAS VSP data for a significant fraction of the survey. Additionally, a subset of recording was dedicated to vibrator source tests. All explosive shot data were recorded by a surface geophone array (providing 3D surface seismic data), a borehole wireline array of 3-component wall-locking geophones, as well as DAS recordings from the optical fibers. The total number of explosive sources was 683 for the SM survey, with shot point (SP) spacing of about 75-100 m within the 3 x 3 km study area (Figure 1a) and loaded with 1 kg of explosive at 15 m depth. 379 of the shots were simultaneously recorded with comparable DAS setup parameters on an interrogator connected to the MM fiber. In addition, Vibrator data were collected using two 45,000 pound-force trucks on one 3 north-south line of 52 vibrosesis points. A 60-level digitally telemetered three-component (3C) geophone array (Sercel Maxiwave) with 15 m vertical spacing was deployed and clamped in the observation well. 54 operational 3C geophones recorded data at levels between 1470 m and 2355 m depth in the observation well.
Data Analysis
iDAS Signal and Noise
Daley, et al (2015) provides a technical description of DAS signal and noise properties, illustrated with data recorded at a CO2 sequestration site near Citronelle, Alabama. Key points of that analysis include the following:
- The Silixa iDAS interrogator uses optical backscattering to monitor, in a moving window, the change per optical pulse in the optical path length (u) difference, between sections of the fiber that are separated by a reference length (the ‘gauge length’). As such, the iDAS output can be equivalently regarded either as an estimate of the fiber strainrate
 or as an estimate of the spatial derivative of fiber particle velocity, as calculated by difference operators applied in time (t) or axial distance (z) respectively.
 - We can obtain a measurement of strain from the iDAS native strainrate since integration with respect to time converts strain-rate to strain (typically followed by a suitable temporal band pass filter). Moreover, for a propagating signal, integration with respect to distance is equivalent to integration with respect to time followed by multiplication by the propagation speed along the fiber cable (apparent velocity) with a sign determined by direction of propagation.
- System noise stems from random quantum effects within the optical system (somewhat analogous to resistor noise in electronic systems). Total noise power is stable but the distribution of noise power is not flat: On any channel, raw noise power increases linearly with temporal frequency; at any time, a few channels are much nosier than others; at any channel, noise power drifts randomly with time.
- An optimal method to maximize signal-to-noise ratio (SNR) and flatten the noise spectrum in the signal band consists of:
- Track noise power while recording multiple independent channels with nearly identical signal
- Form output channels as optimally weighted averages of the independent input channels (i.e. weighted stacking)
- Integrate in time to flatten noise and convert signal to dimensionless strain
Figure 2 illustrates these steps with data recorded at Aquistore using the method of Daley et al (2015). The data came from a single near-offset dynamite shot and were recorded from the SM fiber. In each of these panels a thin-line box identifies a noise window and a thick-line box identifies a signal window. Note that the noise-reduction operator reduces the noise by about 10 dB without affecting the signal. The time-integration flattens the temporal spectrum of the noise and converts the signal from strain-rate to strain (or equivalently, from particle acceleration to particle velocity when scaled by the propagation speed).
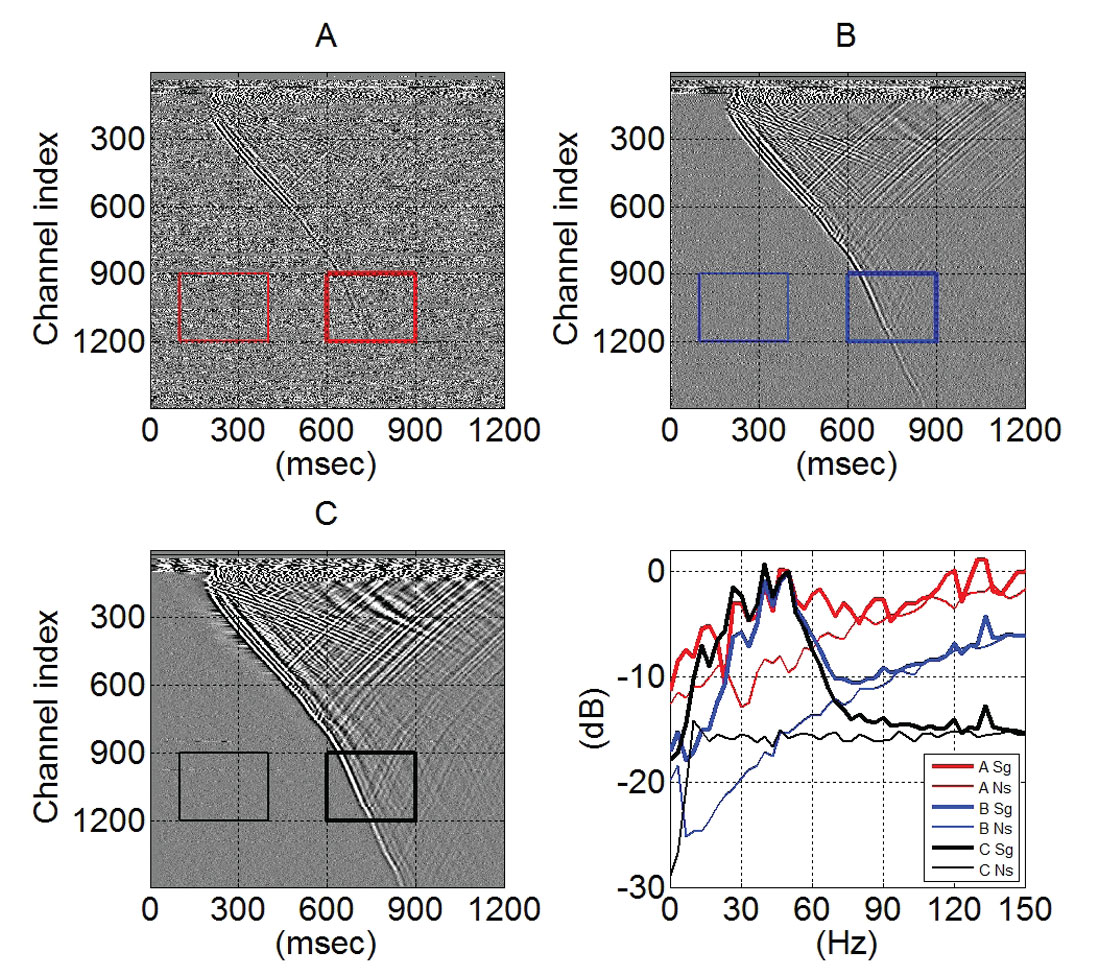
It should be noted that these data were acquired with the best acquisition practice available at the time they were recorded. Largely motivated by the results shown here and in Daley et al (2015), the best acquisition practice has been modified to replace an initial simple average over neighboring channels with an optimally weighted average. This has resulted in a lower noise floor than what is seen here. By sampling at .25m/channel and applying the optimally weighted average to resample at 2m/channel, the current best practice at the time of this writing (January 2015) achieves .03 nanostrain (RMS) in a 10-100 Hz temporal band. The system is subject to a rapid development cycle and improved photonics are likely to reduce the system noise further in the near future.
SM vs. MM Comparison
Figure 3 shows representative comparisons of simultaneous DAS recordings made by interrogators connected to the single-mode fiber (left) and multi-mode fiber (right). The middle panel in each display shows the dynamite shot location. Somewhat to our surprise, no significant difference between the quality of the recordings was seen. The SM data seems to be slightly noisier, but that is likely to be due to a slight difference in interrogator units rather than a difference in fiber type. Evidently, at least for the good-quality fibers in the Aquistore observation well, the acquisition setup procedure adequately tunes the system to compensate for any differences due to fiber type.
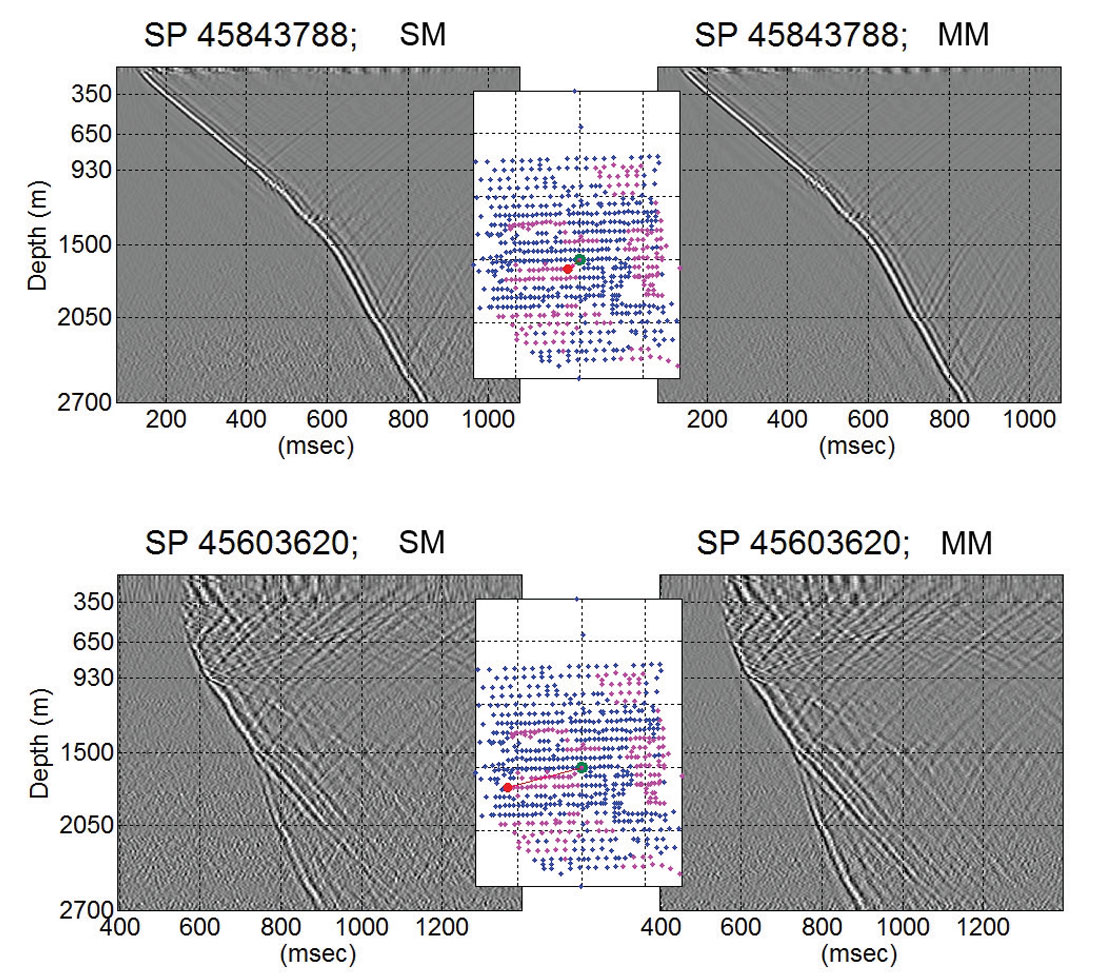
While DAS recording is itself relatively novel, the use of MM fiber for DAS in any field acquisition is quite new. MM fiber DAS is significant because of the large number of borehole MM fibers deployed for distributed temperature sensing (DTS), implying the potential ability to utilize these existing MM deployments for seismic monitoring and imaging.
The Silixa system has subsequently been used with equal success on both multi-mode and single-mode fibers. It should be noted, however, that if fiber types are spliced together in a serial configuration, the optical reflection and signal loss at the splice (due to the mismatch of optical impedance) will significantly reduce the signal-noise ratio from the distal segment regardless of the order in whch the mismatched fibers are combined.
DAS vs. Geophone Comparison
In order to compare DAS signal with geophone or accelerometer signal, one must convert from strain or strain-rate to particle velocity or acceleration and take into account that, like ultrasonic transducers, radar antennas, or spatially distributed groups of geophones or hydrophones, the DAS signal intrinsically represents an integrated array response of conceptual point sensitivities.
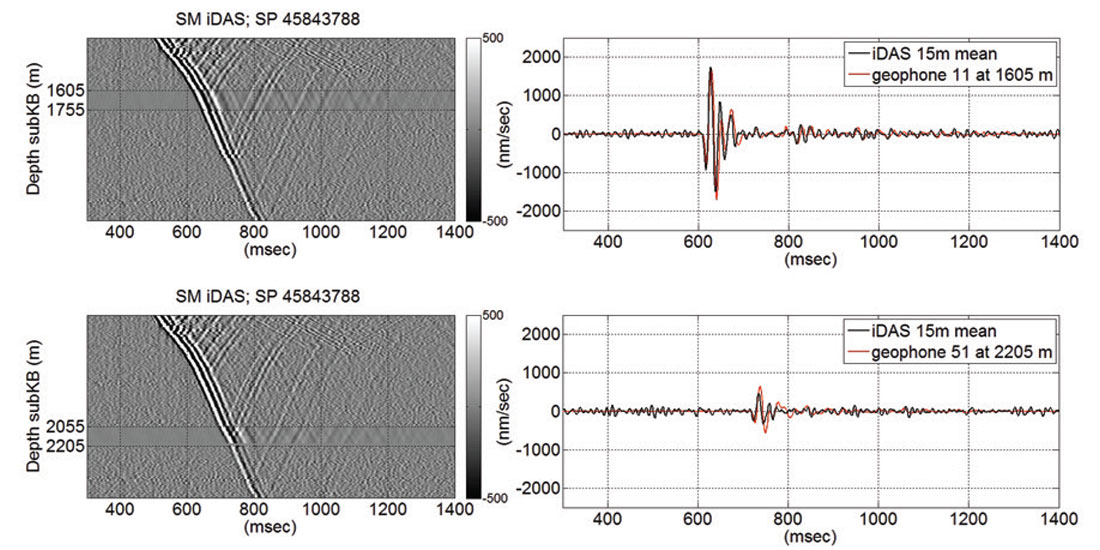
Figure 4 compares DAS and geophone recordings. The left panels show DAS data that has been noise-reduced, time-integrated, and scaled by the apparent velocity (3000 m/sec), overlain by geophone data from a 150 m interval (10 sensors). The panels on the right show single geophone traces (red) overlain with corresponding 15 m averages of DAS data. Up and downgoing DAS signals were separated by the simple up/down filter described in Miller (2012) and Marzetta, et al (1988) and recombined after scaling with the signed velocity to make the left panels. DAS traces in the right-hand panels are simple 15m averages and were not shifted to align up or downgoing signals before averaging. The geophone records were provided as digitized 20 bit integers without information about gain that had been applied, so a single scaling factor to convert geophone data to velocity units was calculated from the match to one of the DAS traces. This single calibration factor is sufficient to match the geophone and DAS signals over all depths and over the large dynamic range of signal amplitudes.
Coupling and Source strength
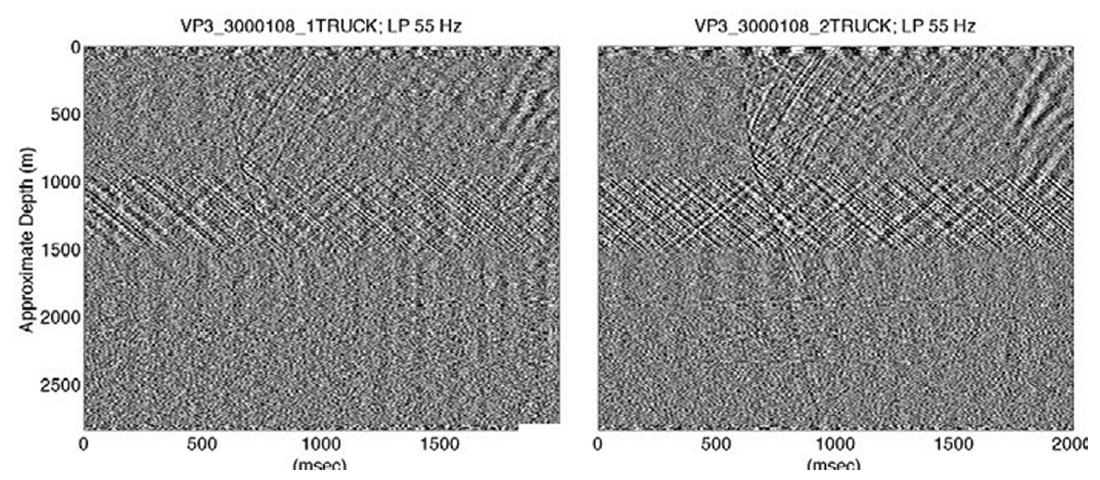
Careful inspection of Figure 5 shows an increased sensitivity to borehole guided waves (tubewaves) above 1500m depth. Recalling that the fiber is in a cemented annulus, this is a sign of a change in coupling between fiber strain and borehole-guided propagation. The cementing of the annulus involved several stages pumping cement slurry. One of those stages was understood to be more problematic than others. Figure 6 shows vibrator data (after correlation with the sweep) that was recorded during a preliminary test. It shows the expected signal gain when two vibrators are used together. It also shows clearly the band of increased coupling to ambient tubewave energy in the borehole that is associated with the relatively poor cement zone between 1000m and 1500m.
Imaging: DAS and Geophone VSP Migration
The continuous spatial sampling over a long extent, and stable reception properties inherent to the use of DAS with fiber in a cemented annulus make it a strong contender for use in time-lapse (4D) applications such as the CO2 injection monitoring planned for Acquistore. Since data was acquired both with a 2D grid of dynamite shots and a line of vibrator points and recorded with both DAS and geophones, there are ample opportunities for comparison. It is particularly interesting to determine whether the added stacking fold for the DAS relative to the geophones is sufficient to compensate for the lower SNR per meter sampled.
For migration of the DAS data we have adapted a processing chain and migration operator that has long been in use for VSP imaging (e.g. Christie, et al, 1995) and that has previously been demonstrated to work well with DAS recordings (Miller, et al, 2012). We have used an integral operator that has been implemented specifically for use with iDAS data.
The processing chain is simple:
- Separate up and downgoing signal
- Derive a deconvolution operator from the downgoing signal and apply it to the upgoing signal
- Migrate the deconvolved upgoing using a weighted diffraction stack
As mentioned above, our up/down separation is a straightforward implementation of a simple equation involving Hilbert transforms applied in both time and channel dimensions. The long spatial array and continuous spatial sampling make this a robust operation.
Our deconvolution method is a data-adaptive Wiener deconvolution (Haldorsen et al, 1994; Chen et al, 2008) in which the noise power at each temporal frequency is derived from the data. It has the property that the result is independent of prior linear operators (such as time integration) that might have been applied before deconvolution.
Our migration method is a precise wave-equation reworking of the diffraction stack (Kirchhoff) method (Miller et al 1987; Burridge et al, 1998). It is particularly well-suited to target-specific applications since image points can be handled independently and contributions from individual sources and receivers can be calculated independently subject only to prior knowledge of the geometry and velocity model. In practice, this means that individual shot gathers (or subgathers using distinct receiver subsets) can be calculated separately and combined to form an image (or, for comparison, several subimages) as a postprocessing step. The method can be implemented very efficiently when the model is translation invariant (1D). Anisotropy and P-S scattering can be incorporated with no significant extra processing cost.
All migrations were made with the same background model and a dip-limited generalized Radon transform (GRT) migration operator, but the preprocessing of the geophone data was done independently. All the DAS data used was from the SM fiber.
Figure 6 shows migrated images made from the entire 2D vibroseis walkaway line. The middle two panels were made with channels covering the same interval in the well for both DAS and geophones. The leftmost migration panel was made using the full extent of the DAS data. Evidently it covers a bigger aperture. In the overlap, the DAS images seem to match each other a bit better than they match the geophone image. We suspect that this difference stems from differences in preprocessing. The rightmost panel is made using only the DAS channels between 350m and 930m.
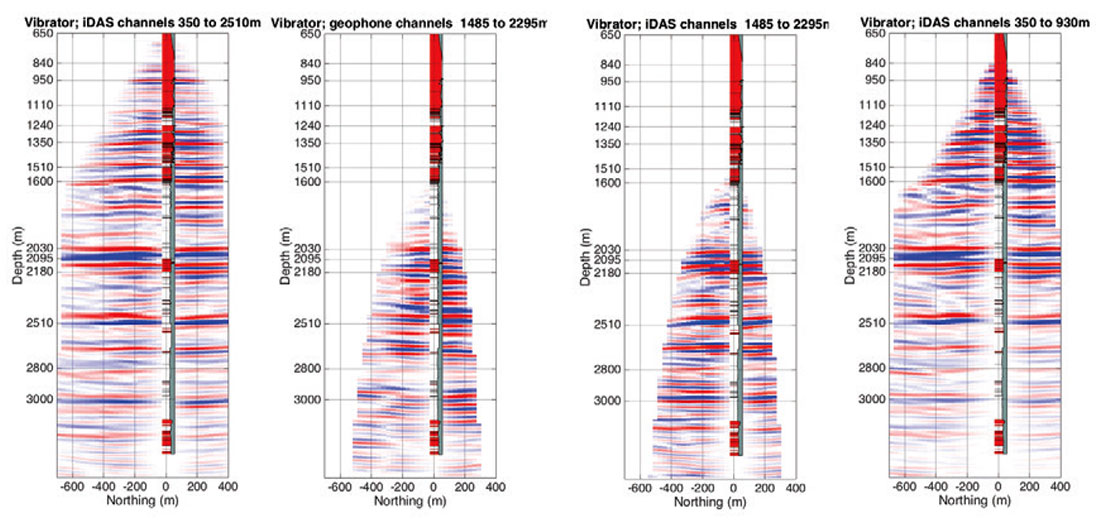
Figure 7 compares DAS images made with dynamite data from the full aperture with data from the upper 27 % of the DAS channels. As seen in Figure 5, the SNR is best in this zone. It has better cement in the annulus and a lower formation impedance.
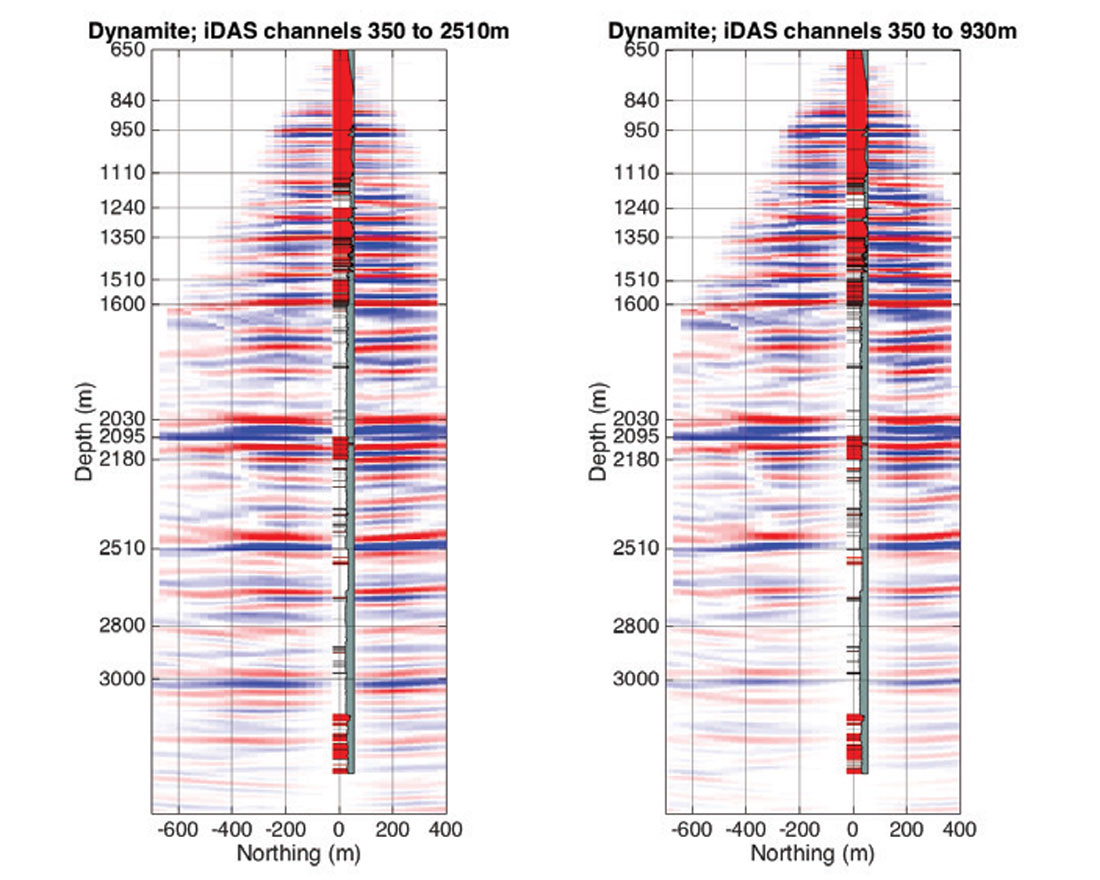
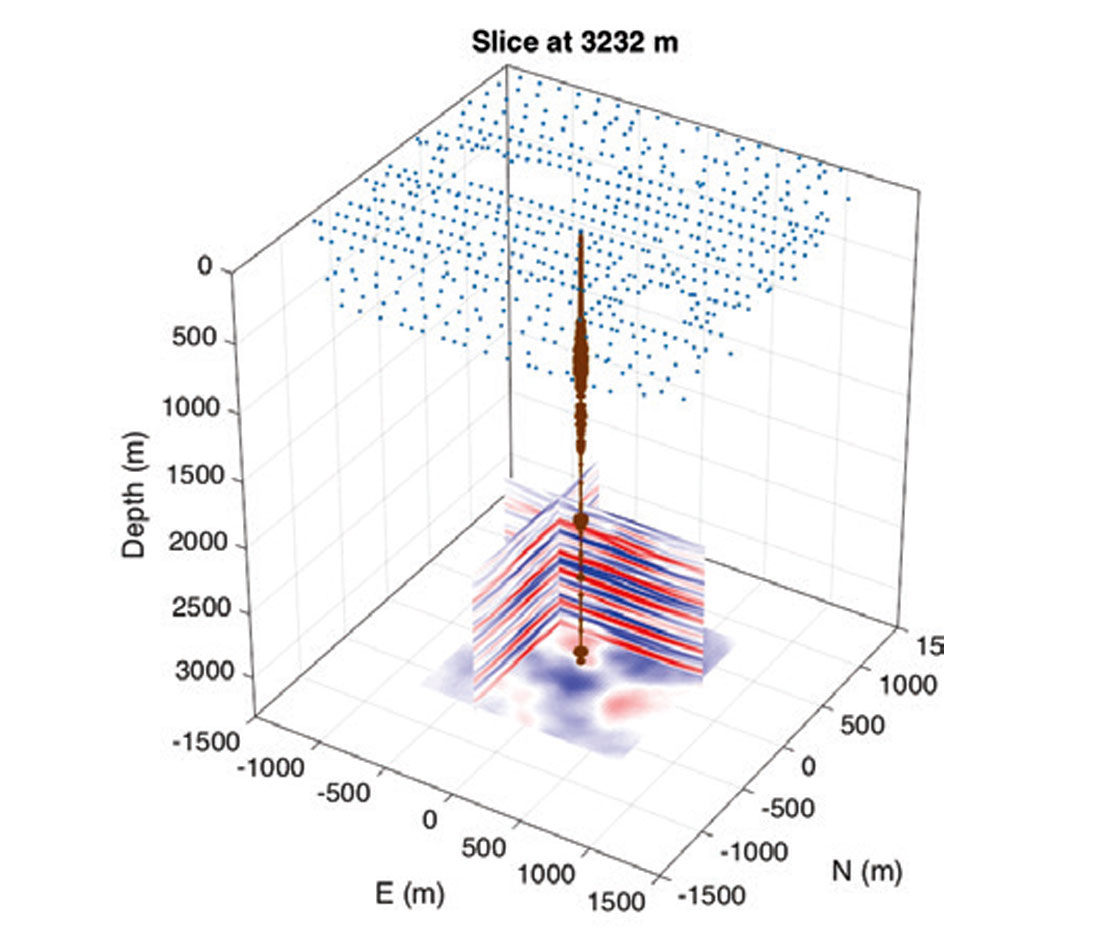
Figure 8 shows 2D slices from a full 3D processing of the SM dynamite survey. It was made using 664 shots and 69 receiver channels at 4m spacing between 650m and 930m. The horizontal depth slice shown is at the level of the planned injection.
Summary and Conclusions
A series of tests of DAS VSP were conducted as part of the Aquistore CCS monitoring project. We demonstrate the improvement in SNR of DAS data from weighted stacking. We show example of data acquired from MM and SM fibers deployed with identical coupling and demonstrate comparable SNR and sensitivity. This is an important conclusion due to the large installed base of borehole MM fibers (used for temperature sensing) which can now be considered for VSP acquisition. A comparison of DAS data (converted from strain-rate to particle velocity) to co-located geophones indicates that the DAS data is consistent with geophone response. A precise quantitative comparison was lacking the geophone analog-to-digital calibration, but a single empirical DAS-geophone calibration factor matched all data. Variability in well cementing was observed to impact DAS data quality. A DAS VSP data migration processing flow is described with results compared to equivalent geophone VSP migration. As expected, the longer DAS array has larger lateral imaging distance. We also show that a subset of DAS channels with better coupling can give results similar to the full channel set. Finally, a 3D migrated image volume for the Aquistore site is presented. The Aquistore project team has decided that the DAS VSP data is sufficient to use for continued monitoring of subsurface CO2 storage.

Acknowledgements
We would like to thank Kyle Worth of the PTRC for management, technical input and support of the Aquistore project. Funding for LBNL was provided through the Carbon Storage Program, U.S. DOE, Assistant Secretary for Fossil Energy, Office of Clean Coal and Carbon Management through the National Energy Technology Laboratory, of the U.S. Department of Energy, under contract No. DE-AC02-05CH11231. Additional funding for LBNL from Chevron.


Join the Conversation
Interested in starting, or contributing to a conversation about an article or issue of the RECORDER? Join our CSEG LinkedIn Group.
Share This Article