Introduction
A number of paths could lead to fundamental advances in seismic exploration. These include: broadening of the recorded frequency band, use of the full 3-D elastic properties of the Earth, and 3-D borehole images. We would like to extend the recorded seismic frequency band (both up and down) to increase resolution and thus see more subsurface detail. In addition, we want to use both P-wave sections and S-wave sections for independent but complementary descriptions of the rocks and their fluids We would also like borehole images to have a section directly tied to depth with known phase and amplitudes.
To investigate these particular possibilities, we designed a set of experiments and performed them over the Blackfoot field in southern Alberta. The surveys have been the result of a very happy and productive collaboration between numerous oil companies, geophysical contractors, the Geological Survey of Canada, Lithoprobe, The CREWES Project, and the University of Calgary. The following discussion overviews some of the survey details and early results.
Geology
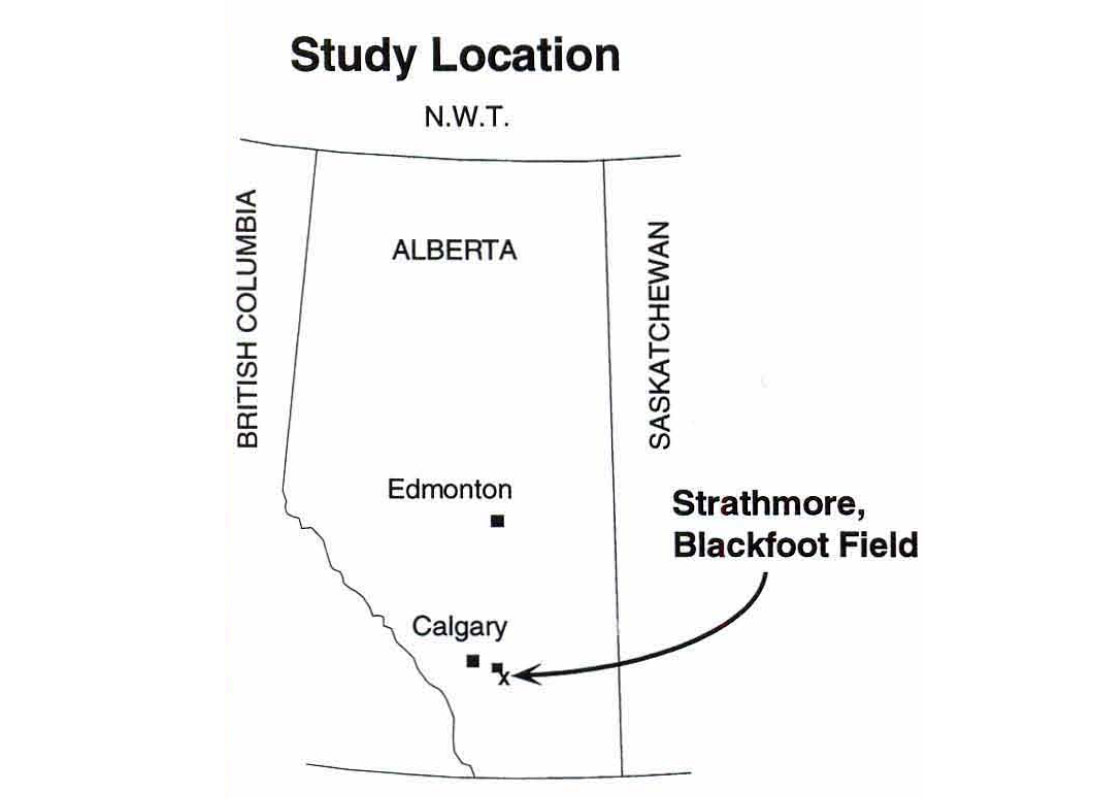
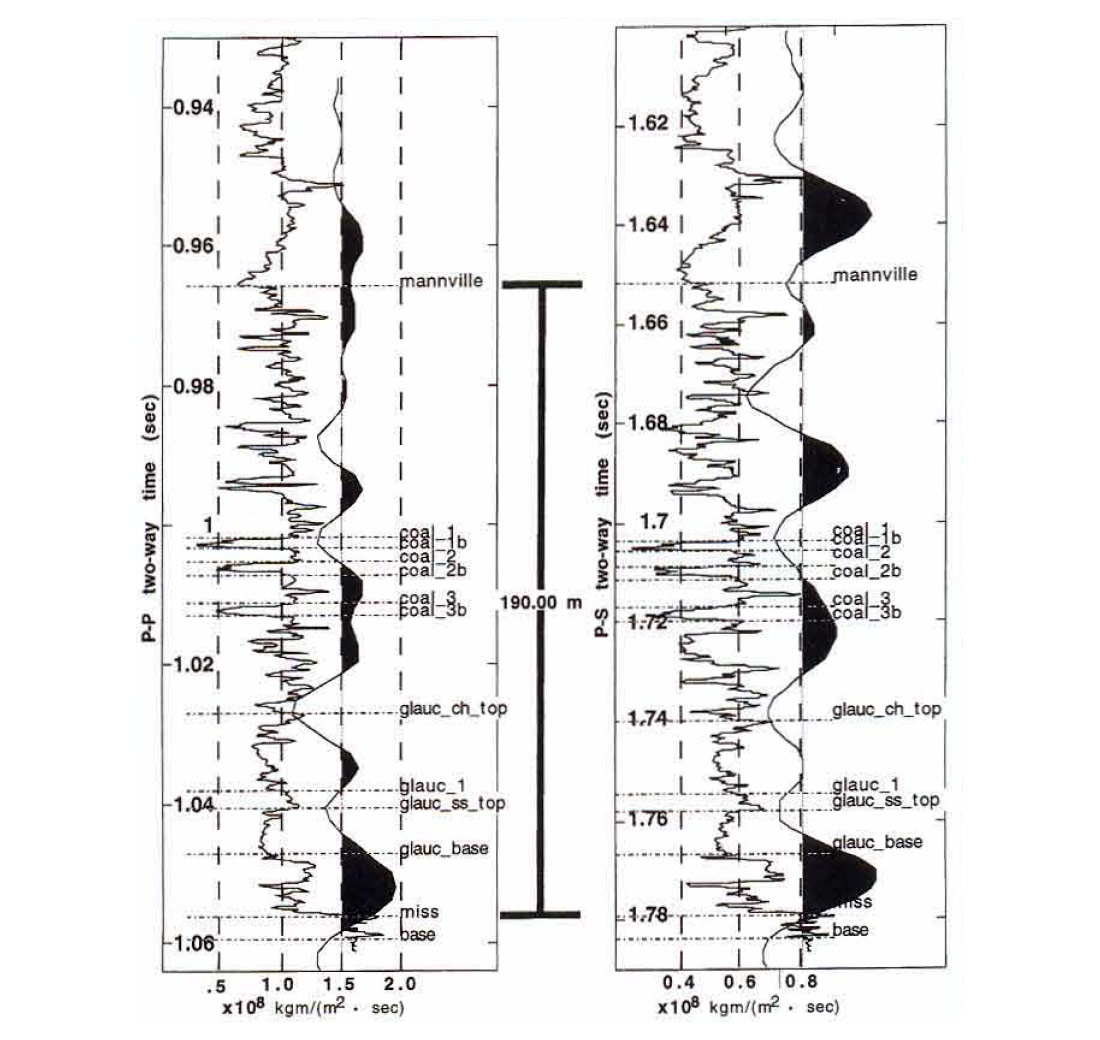
The Blackfoot oil pool is located in Township 23, Range 23W4 about 8 miles SE of Strathmore, Alberta (Figure 1). The reservoir is in a fluvial/estuarine glauconite sand of the Lower Cretaceous (Figure 2). Sands of this type comprise some of the most prolific oil and gas reservoirs in S. Alberta (G. Syhlonyk, pers. comm.). They are at a depth of about 1550 m and can have thicknesses up to 45 m. Their importance and potential (and proximity to Calgary) make them ideal reservoirs for us to study. They also are somewhat difficult to see on conventional P-wave seismic as the neighbouring shales have a P-wave response similar to the productive sands. A P-wave and S-wave well log and associated synthetic seismograms are shown in Figure 3. We note the tuned response of the wavelet to the thin beds. Further synthetic modeling indicated that the converted-wave (P-S) response, as processed from three-component (3-C) recordings, might be significantly different than the P-P response due to changes in the S-wave velocity on and off sand. Thus the promise of using both surveys to achieve a better result. The pool contains a number of wells with suites of well logs. Several VSP surveys also are nearby.
Broad-band 3-C Seismic Survey
The broad-band 3-C seismic survey was acquired July 1 - 10, 1995 by neophyte CREWES jughounds and seasoned industry professionals over the Blackfoot field. The survey had a number of goals. They were to:
- acquire broad-band seismic data from 0.5 Hz to 100 Hz,
- observe any differences between arrays of vertical geophones and single elements,
- analyse whether the low-end frequencies improve the processing, final time sections, or inversions of P-P and P-S data,
- observe whether P-S data can help elucidate the sand channels,
- differentiate seismically between sand, shale, and shale plug lithologies encased in regional silts,
- analyse the elastic response of the Devonian carbonate section,
- acquire data for detailed design of a 3C3D seismic survey over the same area.
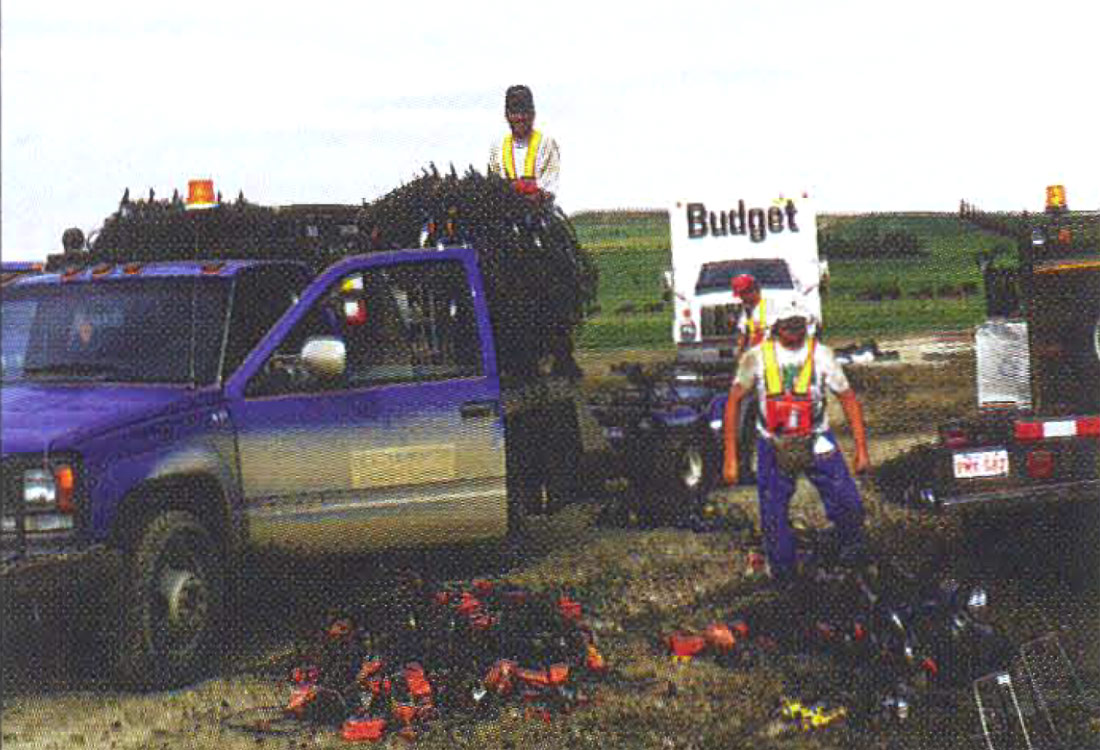
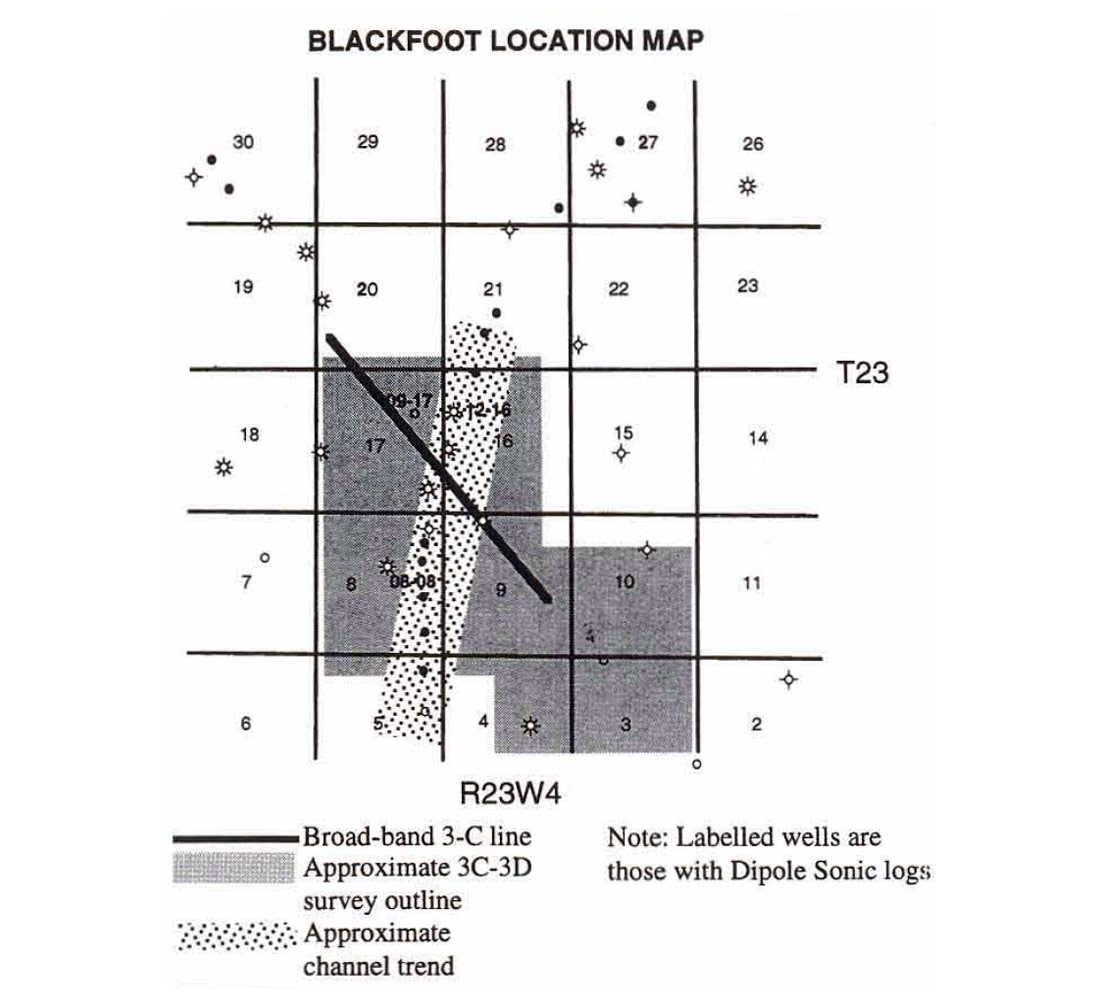
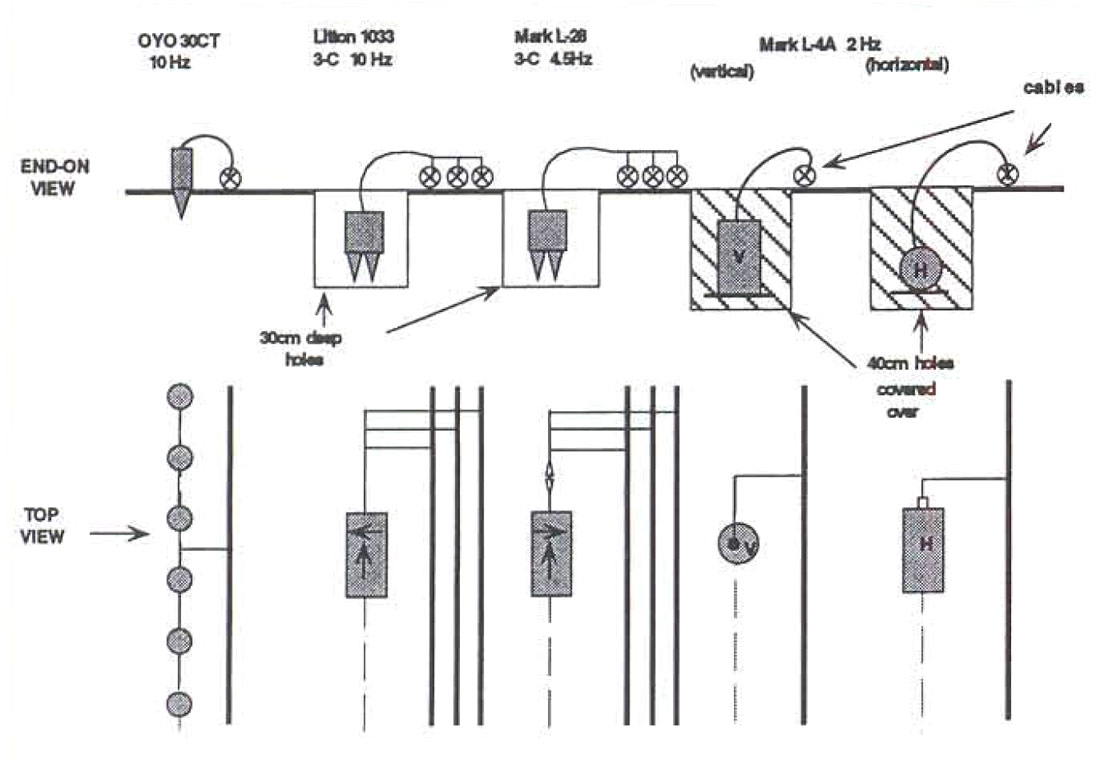
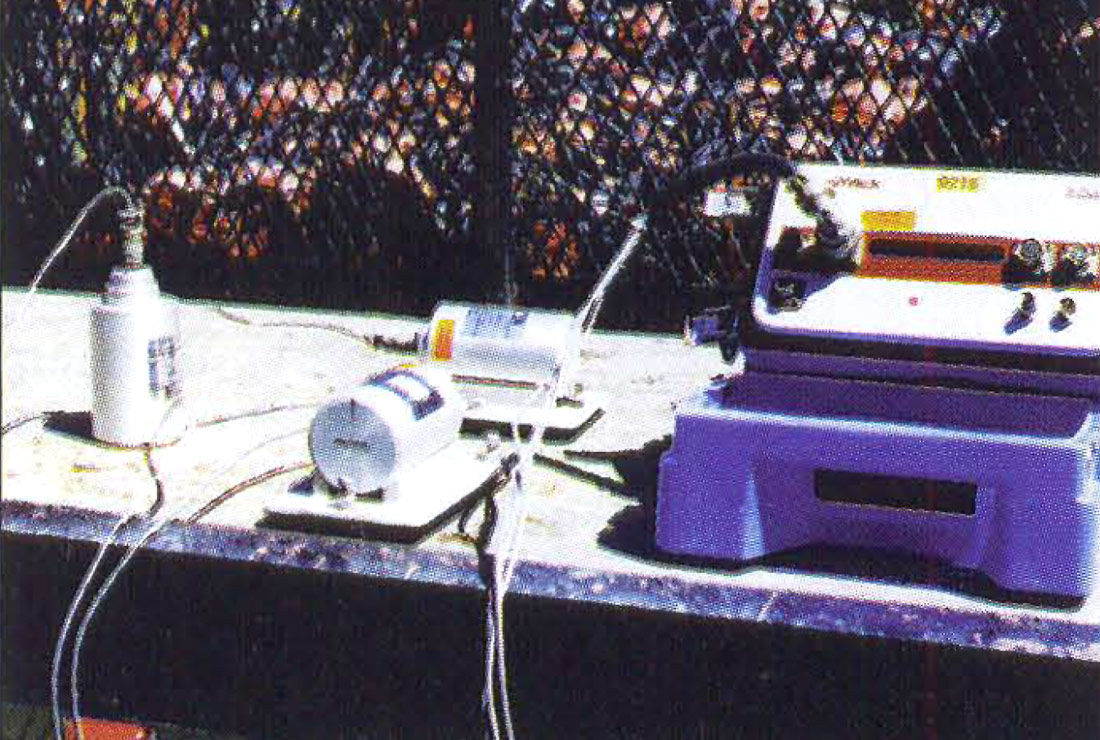
The 2-D three-component seismic lines were acquired by Enertec Geophysical Services Ltd. with support from Geo-X Systems Ltd. (Figure 4). The survey was somewhat complicated but the contractors performed very ably. The ARAM recording system was chosen as it could record to less than I Hz, had a high channel capability, and used 24-bit sampling. Other systems had hard-wired low-cut filters. The seismic lines used a variety of geophones (2-C 2 Hz, 3-C 4.5 Hz, 3-C 10 Hz, vertical 10 Hz strings - see Figure 5) deployed across a line of 4 km. The 2 Hz geophones (Figure 6) were intended to capture the low frequencies, especially in the range of 0.5 - 10 Hz. These 2 Hz geophones are large and heavy cylinders and thus somewhat impractical for production seismic efforts, but workable for this experiment. The 4.5 Hz phones were 3-C phones that could be practically deployed. The 10 Hz 3-C phones are standard industry receivers (Figure 7). A six-geophone string of vertical phones provided comparison and control. The receiver interval was 20m and sources were shot on the half station (every 20m).
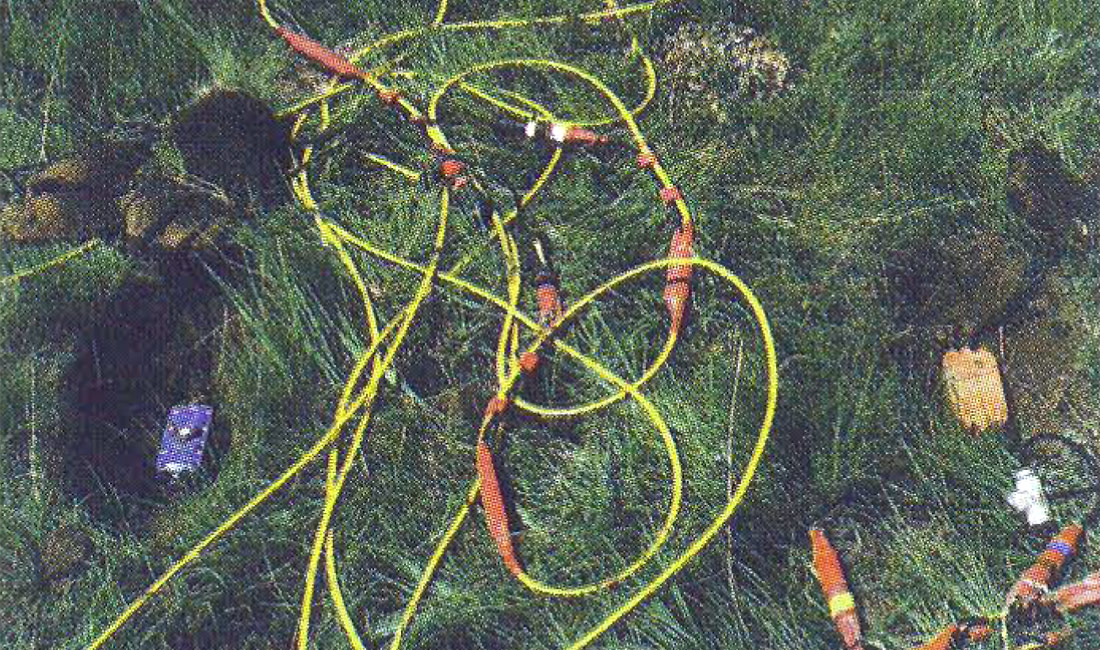
The source was a 6 kg charge of dynamite at 18 m depth. We were using a fairly large shot size to enrich the low-frequency end of the spectrum. Several field and synthetic studies indicated that we would also increase the absolute power in the higher frequencies too, relative to smaller charges. We encountered numerous logistical challenges including cable-eating cattle, crew-eating quicksand, efficacious barb-wire, and ostrich moodiness. We also were inundated with the serious torrential rains of last summer. Nonetheless, nine cables with two 3-C geophones, a six vertical-phone string, and two separate low-frequency geophones at each station were eventually sorted out and recorded. A total of 1670 channels live on the 4.0 km line were recorded for each shot.
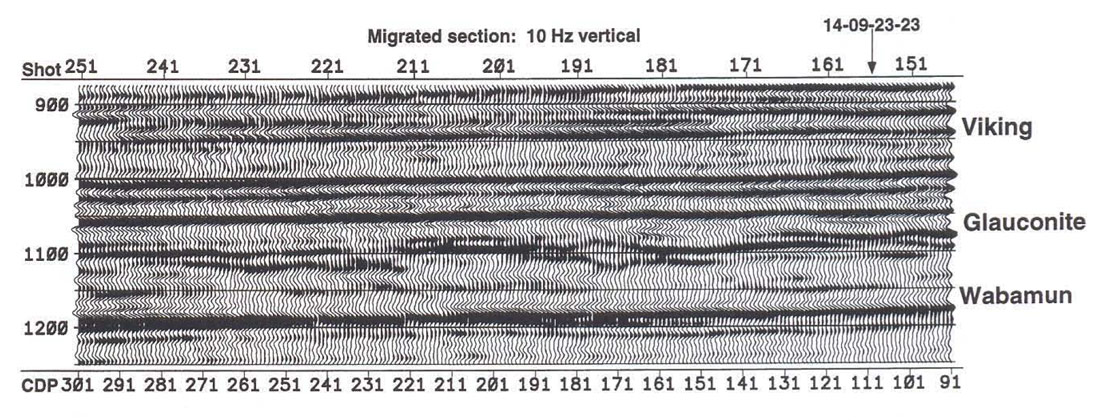
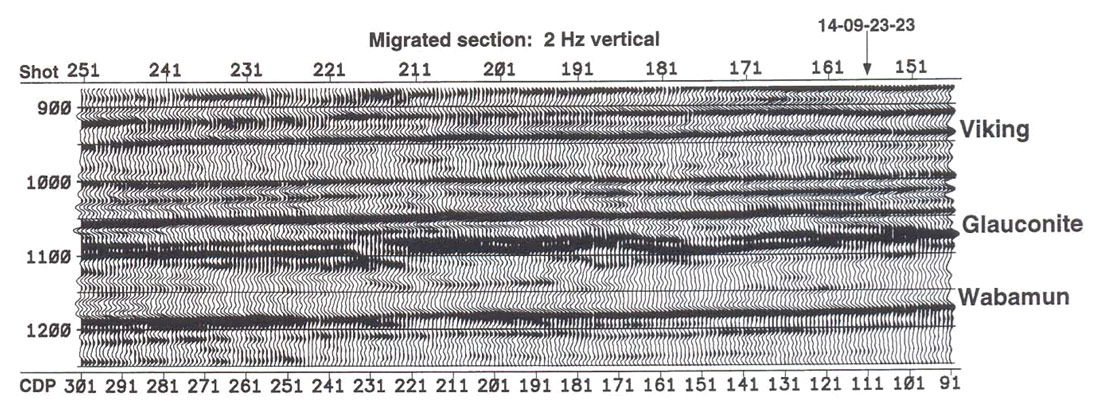
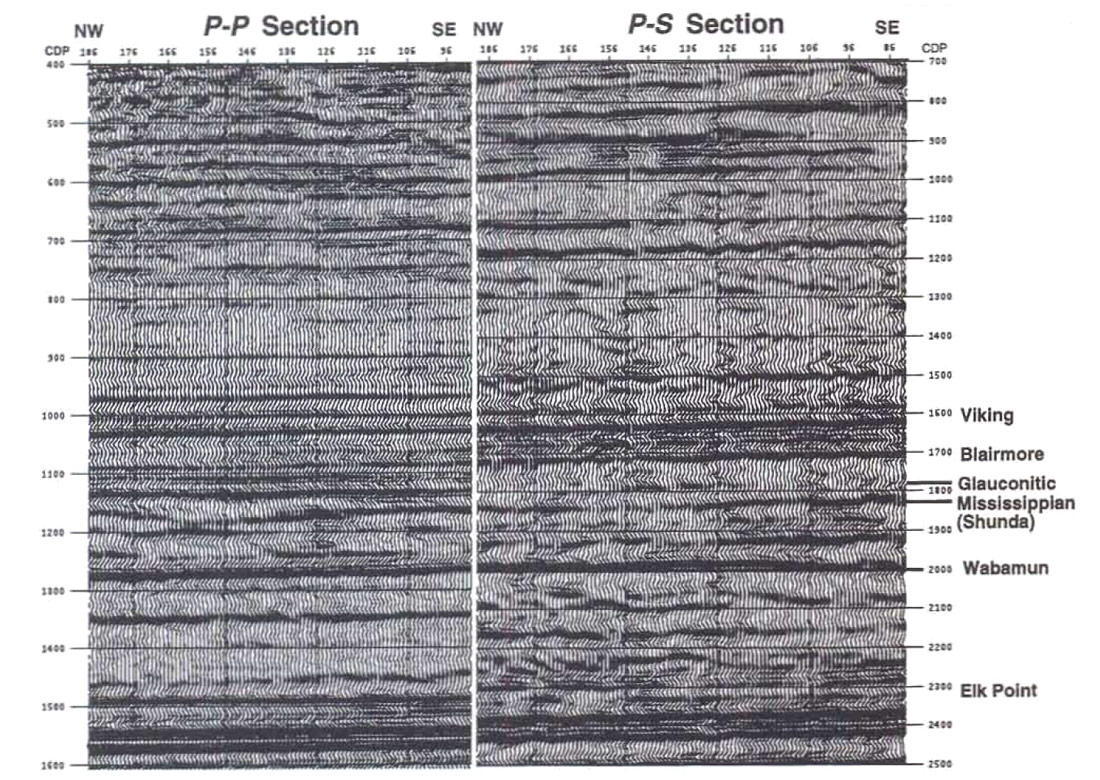
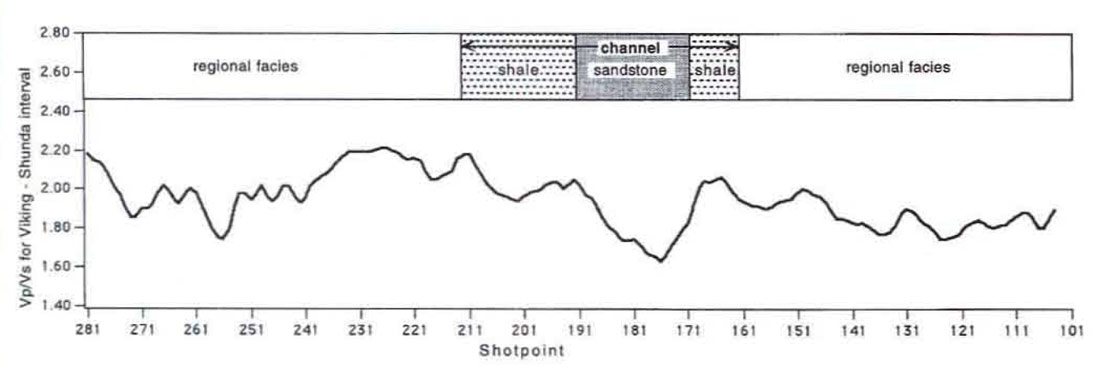
After processing through migration, we found little difference in the resultant sections from the string of geophones and a single geophone. This has been observed by others such as Graham Pye and his survey at Willesden Green. The 10 Hz reflectivity section (Figure 8) looks quite similar to the 2 Hz section (Figure 9) with just a few tantalizing differences. However, the inversion results are more disparate - as discussed later. The P-S section and the P-P section correlate reasonably well (Figure 10). The major reflectors of the Cretaceous and deeper strata are evident on both sections. From the correlation, we can pick isochrons from both sections over a given interval and, by their ratio, find Vp/Vs values along the line. We used a number of intervals, but show the results of the Viking to Shunda isochrons. A significantly lower Vp/Vs value is seen in the region interpreted to be the sand part of the channel (Figure 11).
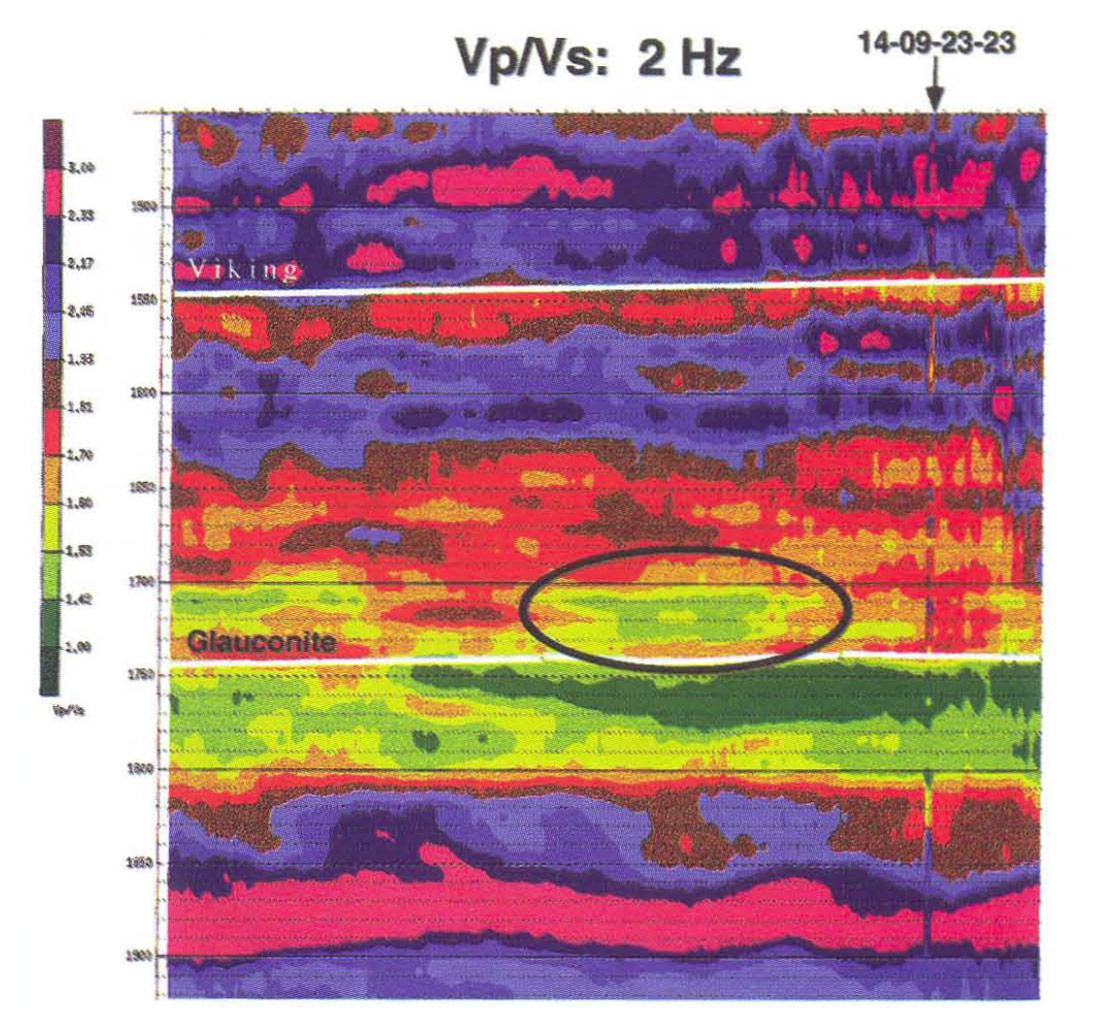
Both the P-wave section and the P-S section are inverted to produce P- and S-velocity sections respectively. These sections are then divided to provide a Vp/Vs section in time. A strong Vp/Vs decrease is again found to coincide with the interpreted channel sand (Figure 12). This decrease had been predicted prior to processing by inversion of synthetic data, and we expected to see it on all sections. However, the 2 Hz data was able to resolve the anomaly with much less ambiguity, compared to the other higher-frequency sections. We also found that inversion of the P-P data alone provided almost no P-wave velocity change over the channel on the 4.5 and 10 Hz data and very little change on the 2 Hz data, whereas inversion of the PS data provided an S-wave velocity signature on all three frequency ranges - the 2 Hz data showing the most distinct signature. Supporting these observations is the dipole sonic log which shows Vp/Vs decreases from off sand to on sand. Our preliminary interpretation is that the S-wave velocity has a relative increase from shale to sand.
3C-3D Surface Seismic and 3-D VSP Surveys
A consortium of companies (The Blackfoot Seismic Project BSP) joined together to shoot a full 3-D survey using three-component geophones. The survey was managed by Boyd Exploration Consultants Ltd. and a group from the participating companies and the CREWES Project (the Technical Advisory Group - TAG Team). Veritas Geophysical Ltd. acquired the data in the Fall of 1995.
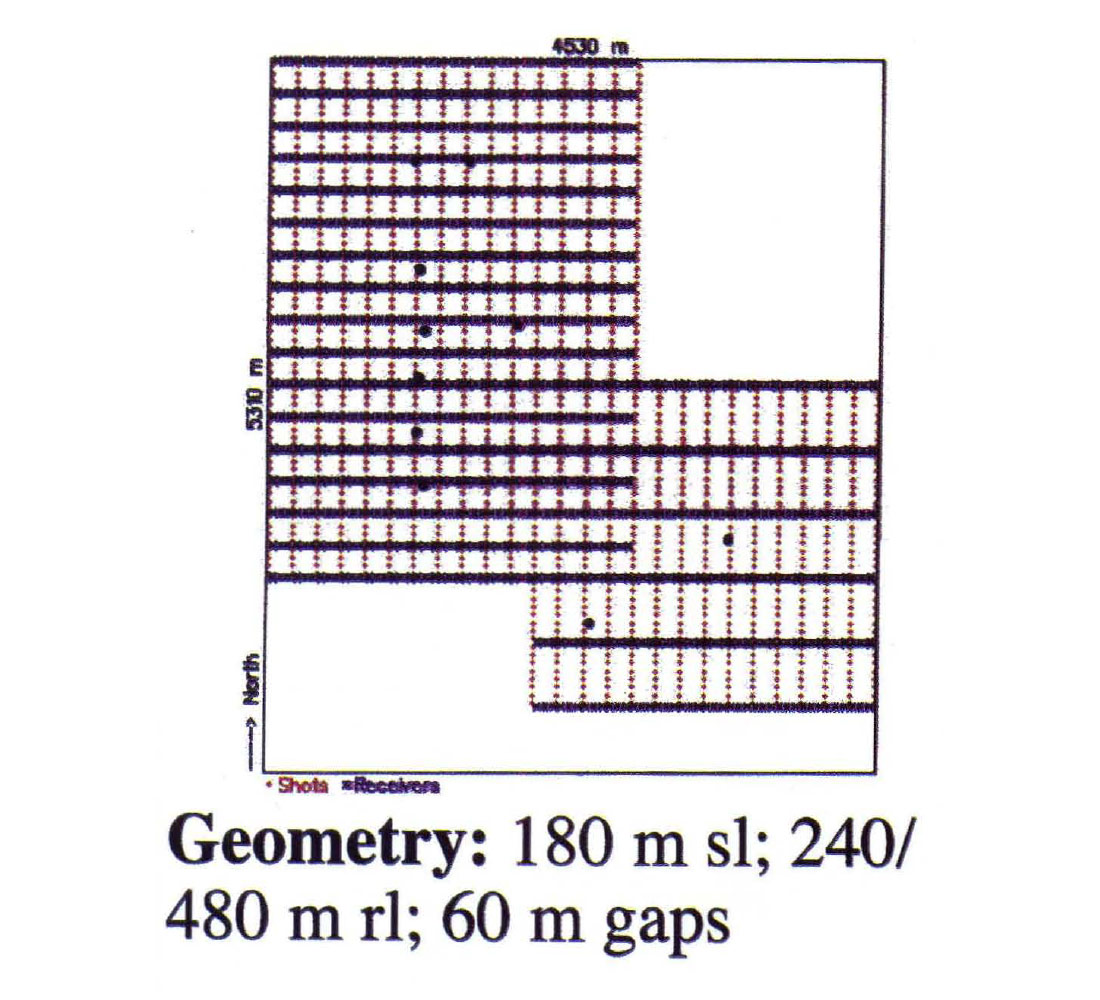
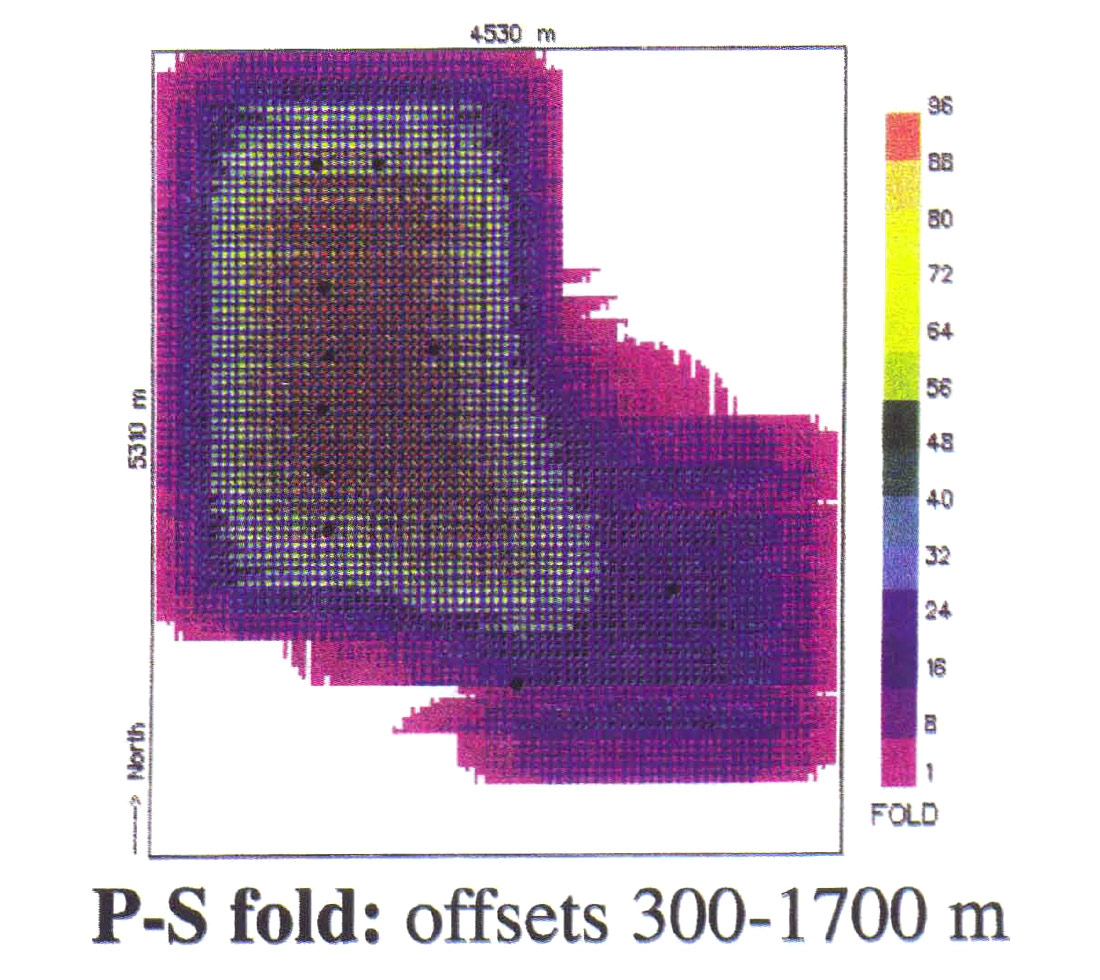
Dynamite sources (4 kg) were used. The approximate geometry and P-S fold of the survey are shown in Figures 13 and 14. Common offset gathers from the broadband survey were quite useful in the 3C-3D survey design. Pulsonic Geophysical Ltd. and Sensor Geophysical Ltd. both processed the surface data and have achieved very fine results. The preliminary time slices look quite encouraging as the PS, 3-D slices appear to provide an outline of the sand channel.
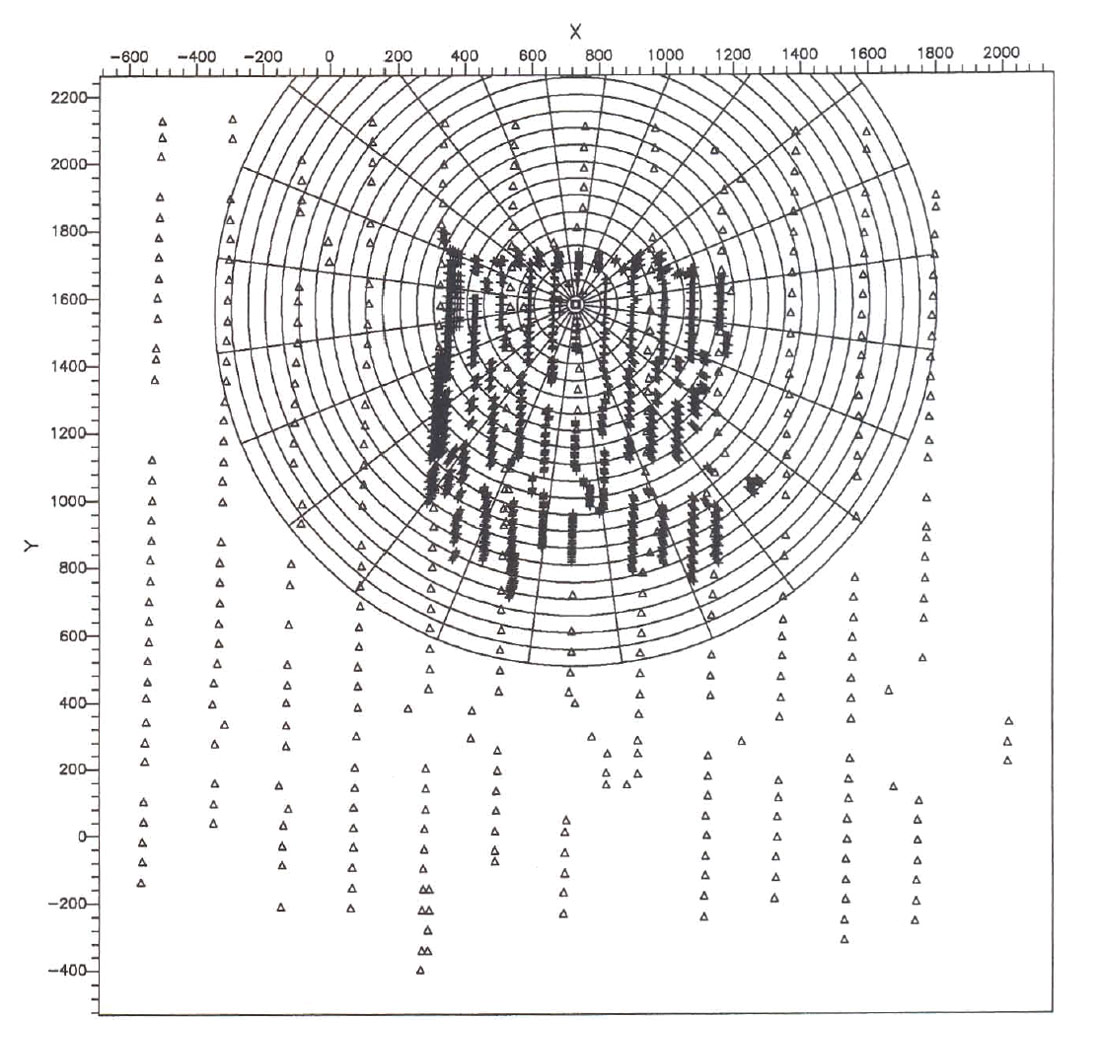
Also simultaneously acquired was a 3-D VSP survey. In this case, Western Atlas Logging Services used their 5-level, three-component tool in the 12-16 well to receive data from the 3-D surface shots. In all, 431 sources were recorded by the downhole tool. The depth levels of the tool were altered to provide greater offset coverage depending on shot location. We also attempted to simulate longer vertical arrays by moving the receiver string up and down the hole. The reflection points near the Glauconite level are shown in Figure 15. The data have been gathered into radial bins as shown and processed as offset 2-D VSPs. Initial results show continuous reflectors which are nicely correlatable to the surface seismic sections. The overall results of the Pop and P-S surface seismic and VSP are excellent and will be given in late July to BSP participants, shown in November to CREWES sponsors, and after December to the public.
Conclusions
There remains yet a great deal of improvement to be made in seismic imaging and analysis. By broadening the recorded frequency band, using 3-C receivers to create pop and P-S sections, and listening with downhole receivers, we have the potential to create much more detailed interpretations of the subsurface. The Blackfoot surveys were undertaken to test some of these ideas. The 2 Hz and 4.5 Hz sections show some differences from the conventional 10 Hz sections and lead to improved inversion results. Vp/Vs values from the joint interpretation of pop and P-S sections appear to delineate the channel sands in this case. Preliminary PP and P-S slices from the 3C-3D survey show very good results with a fascinating description of the sand channel on the P-S slices. The 3-D VSP looks promising as an inexpensive add-on to create depth images. Further processing and interpretation of the data is underway and presentation will follow in the next months.

Acknowledgements
The Blackfoot seismic surveys and analysis are the result of a large effort by numerous individuals. From the CREWES Project, Mssrs. Malcolm Bertram, Darren Foltinek, Henry Bland, Ms. Qi Zhang, and Dr. Don Lawton, have been especially involved in the surveys, their analysis and presentation. PanCanadian Petroleum Ltd. has provided a great deal of support for these surveys and we're especially appreciative to Mssrs. Dave Cooper, Bill Goodway, Garth Syhlonyk, Ian Shook, Brent Ragan, and Andre Politylo. In the broad-band surveys, Mssrs. Richard Habiack and Terry Powell of Enertec and Tim Hladik of Geo-X were extremely diligent in helping acquire good data. Mr. Marty Sommerville of Mark Products Ltd. helped us out considerably in assembling the geophone adapters. The IRIS/PASSCAL Instrument Centre lent us their 3-C 4.5 Hz geophones (Thanks Mark Alveraz and Jim Fowler). Mssrs. Isa Asudeh and Tim Cartwright of the Geological Survey of Canada provided support for usage of the GSC's 2 Hz geophones. Dr. Ron Clowes of Lithoprobe kindly assisted in the coordination of the low-frequency geophones. Mr. Al Yasinko of Ace Explosives ETI Ltd. generously supported the project. In the 3C-3D survey, the Veritas group too did an excellent and very safety conscious job. It bas been rewarding to work with Dr. Mark Harrison of Sensor and Dr. Peter Cary and Mr. Gary Lorentz of Pulsonic on the processing of these data. Western Atlas quickly put together a slaved recording system for the VSP, which to our knowledge was one of the first land 3-D VSPs ever conducted. We appreciate the efforts of Mssrs. Dan Quinn and John Parkin of Western. Mr. John Boyd of Boyd Exploration Consultants has been a constant source of support and expertise. Thanks folks.


Join the Conversation
Interested in starting, or contributing to a conversation about an article or issue of the RECORDER? Join our CSEG LinkedIn Group.
Share This Article