Introduction
Despite their generally positive reputation as sources of clean, safe energy, Industrial Wind Turbines (IWTs) do have their critics. For years, residents living in the vicinity of IWT clusters have reported a variety of physical ailments which they attribute to the sounds and vibrations emanating from wind turbines (Kelley, 1985; CBC.ca, 2011). Noise bylaws, setback distances and other regulations applied to IWTs appear to be based on analysis methods used historically with industrial applications, where noise tends to be constant or semi-constant and in the audible range. The noise generated by IWTs is quite different - spiky and high amplitude - like an exploration seismic source pulse, and mainly found in low frequencies not detectable by human hearing (i.e. infrasound or “below hearing”). This article looks at the signals generated by IWTs from a geophysicist’s perspective.
Methodology
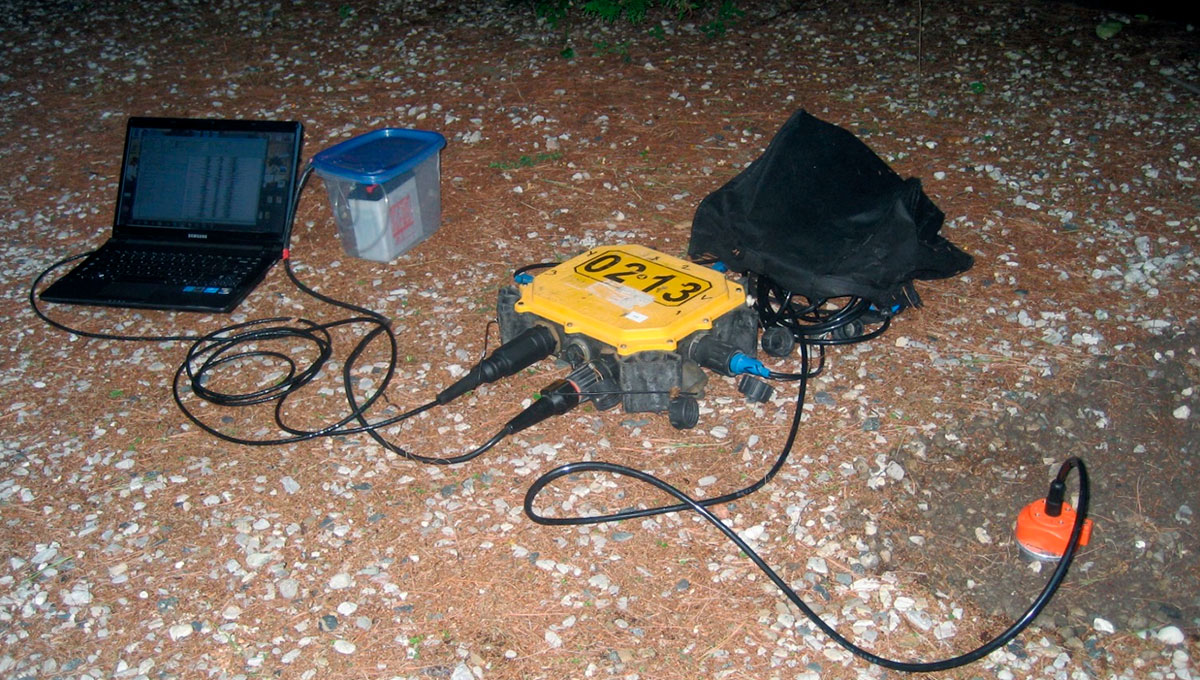
During the summer of 2018, the seismic and air waves and pulses generated by large Industrial Wind Turbines (IWTs) were recorded in several test scenarios at various locations in Ontario. These recordings were made using state-of-the-art nodal seismic recorders as well as geophones used in 3D seismic imaging and microseismic monitoring. Air pulses and waves were also recorded using professional audio microphones. These data were frequency-equalized during signal processing to produce sensor frequency responses that are flat from 0.7 to 250 Hz. The data were displayed using fixed gain displays for all locations.
Purpose
The recordings were made with the following objectives:
- To view the seismic pulse and wave recordings in the time domain and view their amplitude spectra to determine the frequency range of the highest amplitude event.
- To compare seismic amplitudes generated from IWTs to seismic amplitudes generated from other seismic sources (for receivers not at pulse-constructive nodes).
- To discuss the highly variable amplitude of the air pulses due to constructive and destructive interference from the clustering of turbines.
- To analyze and present the information in a manner appropriate for an impulsive noise source, as opposed to “traditional” noise analysis methods which employ various types of averaging.
Current Situation in Ontario
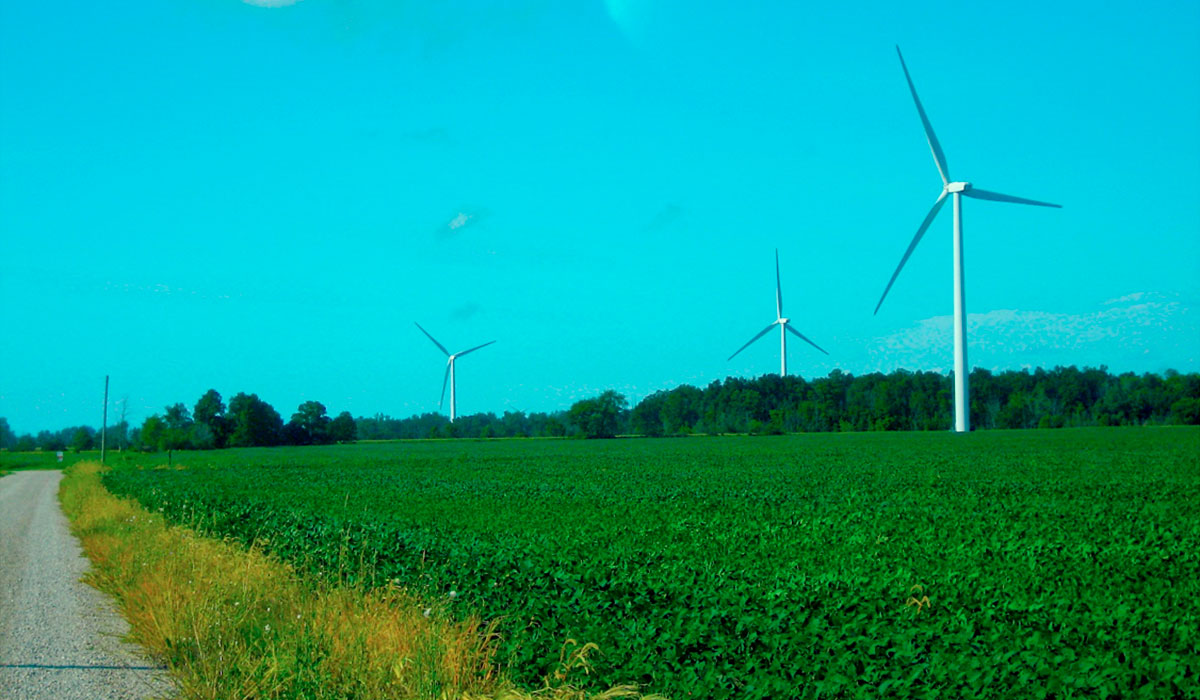
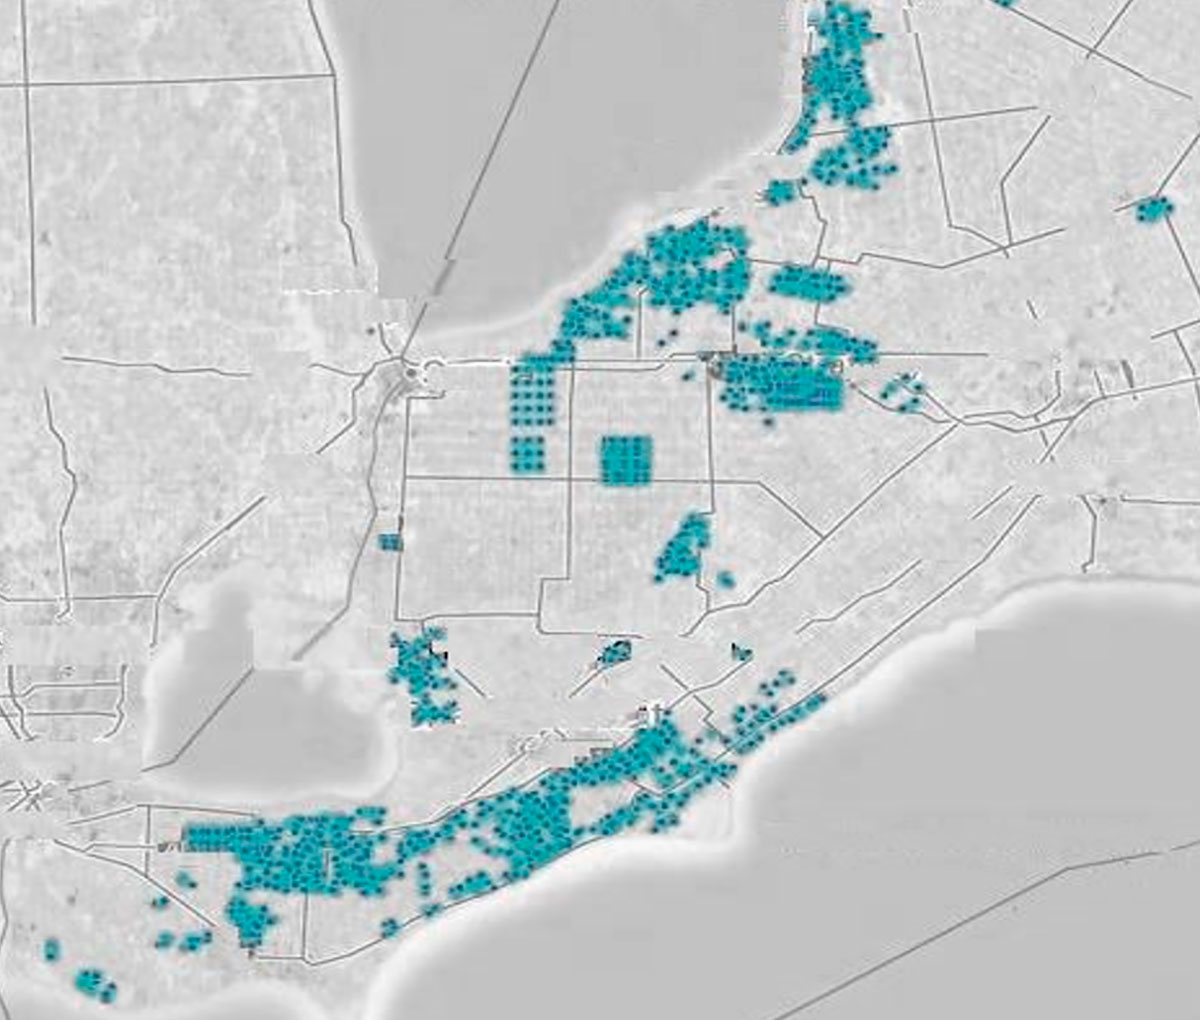
There are approximately 2550 IWTs installed in Ontario according to the Canadian Wind Energy Association, providing 7.5% of the electricity used (CANWEA, 2019). These are all Horizontal Axis Wind Turbines and are situated in clusters of various numbers concentrated in Southern Ontario on small patches of land leased from agricultural land owners (see www.ontario-wind-turbines.org). There is currently a setback distance regulation of 550 meters from homes. A cluster of wind turbines is usually 10 to 50 turbines in an area of 100 square kilometers or more, comprising a “wind project” or “wind farm”, owned by a wind company.
Sometimes a few wind turbines are owned by the land owners. Consequently, there are many homes now within the wind farm boundaries.
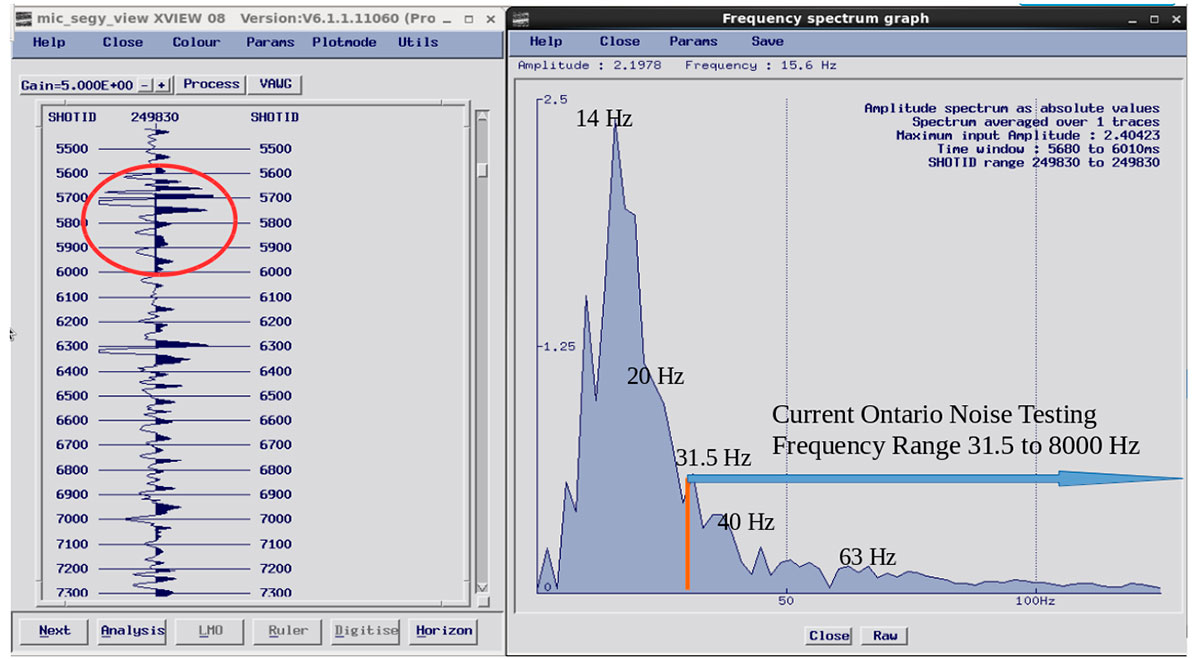
The current government regulations for IWT noise in Ontario require turbine owners to maintain “noise” levels below the Sound Pressure Level (SPL) limits in the range of 31.5 to 8000 Hz while ignoring the lower frequencies completely (Ontario.ca-1, 2019). The SPL limit set by the regulators for rural areas is 40 dBA (decibels, A-weighted), unless the wind speed is over 22 kph (at 10 m height) in which case the limit increases in a sliding scale to 51 dBA with winds above 36 kph.
The SPL limit increases as the wind speed and air-pulse amplitude increase. This assumes that increased background noise (wind noise) masks the effects of the air pulses from the IWTs, for a receiver. This is unlikely since the pulses have much higher amplitude than most audible noise from the wind which is also in a higher frequency range. These are inappropriate regulation specifications for an impulsive IWT noise source, for several reasons. The frequencies below 31.5 Hz have much higher amplitudes than the frequencies above 31.5 Hz and would likely fail if included in “noise” testing using current regulations. The air pulse amplitude increases naturally with increased wind speed, so it makes no sense to also increase the SPL limits. The A-weighting of the frequency analysis further minimizes the effects of the low frequencies in the “noise” analyses by basically ignoring the lower and upper frequencies that the average person cannot hear (Noisemeters.com, 2019).
Alberta also uses A-weighted noise specifications for IWTs, starting with a basic daytime A-weighted SPL noise limit of 50 dBA for a low density of homes, more than 500 m from a highway (1 home per quarter section land). The limit ranges up to 66 dBA for areas with more than 160 homes per quarter section, less than 30 meters from a highway (AUC.ab.ca, 2019). The Alberta IWT noise specification also assumes that increased background noise should result in higher noise limits for IWTs as discussed above. Alberta does allow for additional C-weighted (flatter frequency weighting) measurements to be made if low-frequency events between 20 Hz and 250 Hz are suspected or claimed by a complainant, but this still does not adequately address the very low frequency, infrasound (inaudible) high amplitude events.
Noise testing should use Z-weighting, which is basically a flat response from 10 Hz to 20,000 Hz, in order to be accurate.
Pulse Generation
Pulses are created by an IWT when the turbine blade interacts with the turbulent air around the support column, creating a repetitive “block and release” of the air column (Van den Berg, 2006). The resulting pulse is similar to that created by a seismic airgun but with a more limited frequency range – the energy envelope is shifted toward the low frequencies. The pulse can be considered the source wavelet (see Figure 6) for the wavefield that is being created by each wind turbine in a cluster. The seismic pulses and waves from a single IWT or a cluster of IWTs can travel several kilometers along the earth's surface in the same way that ground roll and air-waves can roll across the entire 4 kilometers of a seismic line when recording reflection seismic data (see Test 1).
The wind turbine hub and shaft rotate at about 1/3 Hz and the pulses are generated at the Blade Pass Frequency (BPF) of approximately 1 Hz. The IWTs create seismic and air pulse wavelets with frequency spectra that peak between 4 and 16 Hz (Shepherd, 1989). The highest amplitude components of the air pulse are below 20 Hz and are inaudible. The barely audible low frequencies in the 20 to 60 Hz range create a “whump” sound which might be heard a few hundred meters away or even further, depending on weather conditions. Other low amplitude mid-range components of “broadband noise” like 500 Hz (“scrunch”) to 1000 Hz (“swish”) may also be included in the noise wavelet package.
Most of the noise and wave generation of the IWT is associated with the blade passing the support column at the blade pass interval of 0.77 to 1.5 seconds at normal operating wind conditions (also BPF of 0.67 to 1.3 Hz). The resulting pulses and waves are produced at the BPF (also the pulse occurrence rate) carrying the waveform of the pulse (or wavelet) which is the highest amplitude portion of the waves creating the most displacement when encountered by an object, diaphragm or other sensor. The peak of a single pulse spectrum is about 25 times higher than the amplitude at 63 Hz for the seismic data recorded and about 22 times higher than at 63 Hz for the air pulse data recorded (see Figures 6 and 9).
The amplitudes of the pulses and waves generally decay with increased distance traveled to a receiver due to geometric spreading. However, the low frequencies, like 5 to 16 Hz in the air pulse, demonstrate less decay in the downwind direction (Shepherd, 1985). The pulses and waves from several turbines within a cluster create a web of crossing spherical waves interfering with each other, often diminishing the amplitude of the low frequencies in the pulse at a receiver point due to destructive interference by the variable pulse-firing times of the many turbines. However, at certain locations and times, when several air pulses arrive at the receiver nearly or exactly in phase, the amplitude of the pulse can be several times greater than that of the usual arrivals, due to constructive interference. These pulses come in sets of 2 or 3 pulses, possibly every 30 seconds.
If you can hear the “whump” within several hundred meters from an IWT, then there are much lower inaudible frequencies associated with this sound. The inaudible frequencies have 2 to 10 times higher amplitude than the part of the noise you can hear around 40 Hz, which, for reference, is the low E-string on a bass guitar (see Figure 9). Depending on weather conditions and ambient noise levels, a person can sometimes hear the higher frequency noises several hundred meters away. Many complaints are received by government agencies concerning the audible noises from IWTs that are received at homes, in addition to complaints about encountering high amplitude pulses from time to time, so these also cannot be dismissed.
Noise Testing by Traditional Acoustics Methods
Publications of recordings of IWT air pulses and waves using micro-barometers display power spectra (in SPL) including frequencies to the 0.1 Hz range that are created from very long accumulations of time data recordings (James, 2015). These recordings can be many hours long and the time data itself is apparently not scrutinized. This method of analysis and other averaging such as using RMS amplitudes and traditional 1/3 octave bands, reduces the effects of all short-period, high amplitude events or pulses in the data (see Figures 9 and 10). For example, analysis that starts at the low frequency 1/3 octave band of 63 Hz does not include frequencies below 44 Hz. Additionally, data recorded with micro-barometers or microphones are analyzed using the A-weighted frequency spectrum. When all of the above averaging and weighting methods are employed, there is little information remaining about the amplitude and spectral shape of the very low frequency (infrasound) pulses and waves emanating from a cluster of IWTs (Alves-Pereira, 2018).
The 63 Hz band is the most commonly used “lowest frequency band” for testing by the wind industry and government regulators. The Ontario Government Ministry of Environment and Climate Change recently commissioned a summary of methods involved in “Sound Propagation Modelling for Offshore Wind Farms” which goes into detail about attenuation of various kinds while ignoring constructive wave effects and omitting frequencies lower than 63 Hz, where the highest amplitude events from IWTs are found (Doran, 2016). It seems that the decision to omit the range of frequencies during testing that would most likely cause issues with human and animal ears is ill-informed.
IWT-related Ailments
The main symptoms reported by people, associated with pulses and waves from IWTs that are relevant to this research, are similar to symptoms of barotitis where parts of the ear are disturbed or possibly damaged by the low frequency air pulses (Safran 201; Mayoclinic.org, 2019). In Ontario and many other parts of the world, people report varying degrees of stomach nausea and dizziness (some vertigo), ear pain, plugged ears, nervousness and sleep loss (Hill, 2013; CBC.ca, 2011; Wilson, 2013). These problems appear to occur intermittently depending on several atmospheric conditions, topography, and position and distance of the receiver from the cluster of IWTs. (Kelley, 1985).
"It was just like the whole room was spinning," recalled one woman from Thamesville, ON who brought a lawsuit against a wind company for inflicting a long list of serious health issues on her family at home (CBC.ca, 2011). A couple from Goderich, ON said they have, “been unable to sleep and exposed to prolonged periods of annoying noise,” after installation of a large wind farm near their farm (Hill, 2013).
Of course, there are three variables involved here: the sensitivity of the person, the amplitude of the pulses and the likelihood of being in a place to encounter the pulses when they are amplified. It is likely that the ear-related ill-effects are from several instantaneous encounters with air pulses and not necessarily a long-term accumulation effect, although the 24-hour operation of wind turbine clusters exacerbates the problems of disturbance.
It is recommended that seismic or audio time and frequency analysis be done on short time windows (less than 1 second) rather than accumulations of many minutes to several hours, as is being currently employed for monitoring wind turbine noise. The data analyses should also be performed during the atmospheric conditions (wind speed, humidity, wind direction) that create the ill-effects in people. One must remember that the IWTs are often operating both day and night and thus there can be sleep disturbance issues complicating matters. It is not currently known if the seismic disturbances transmitted through the near-surface can also amplify to create ill-effects to a person’s balance system. More research and calibration need to be done with respect to this issue.
“Noise” testing procedures should be revised to include all low frequencies created by the IWTs because the low frequency events contain the most power and highest amplitudes. The “threshold of pain” for mid and high frequencies is generally considered to be about 120 dB SPL. Conversion of peak pulse amplitudes from the microphone recording shown in Figure 9, at 550 meters offset in 20 kph winds including the full frequency range to 1 Hz, revealed peak Sound Pressure Levels of 65 dB or more using non-weighted peak amplitude levels. Weighting with the A-curve should not be required since the low-frequencies are already weighted down by the wave transmission mechanisms in the middle ear (Cochlea.eu, 2019)
Near-surface Travel-time Model for Seismic
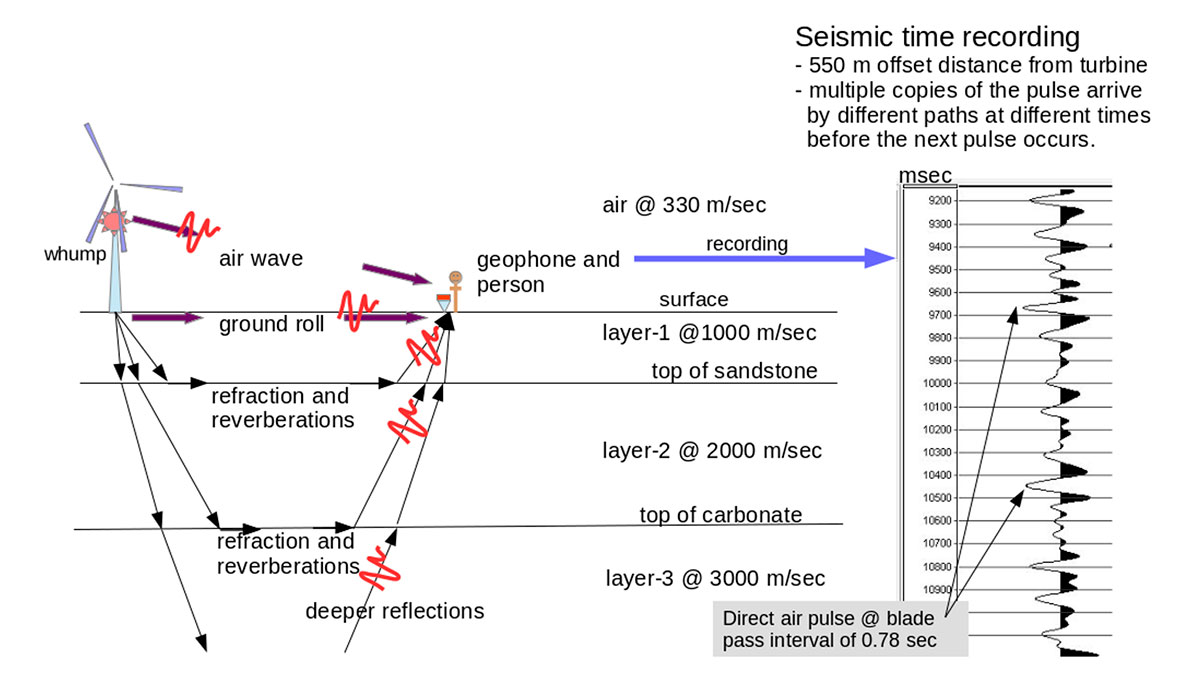
The pulse from an IWT seismic source arrives at a geophone receiver coupled to the ground at a source-to-receiver distance (offset) of 550 meters (for example) following the same travel paths as the first few pulse arrivals from a single vibrator or airgun (surface) source on a reflection seismic survey. A variation of the 2 or 3 layer “near-surface model” (Dobrin, 1976) of the earth describes the first few pulse arrivals at seismic receivers, in most of the areas of the world where seismic exploration has taken place.
Tests
Table 1 contains a summary of the tests conducted. Of particular interest are Tests 1 and 6, and these are discussed in further detail below.
| Tests | Date, wind speed | Results | |
|---|---|---|---|
| Table 1: Summary of recorded tests completed. | |||
| Test 1- Walkaway test from a single IWT (Details and data shown in next section) |
|
|
|
| Test 2- Walkaway test from cluster of IWTs |
|
|
|
| Test 3 – Walkaway test from dense cluster of IWTs |
|
|
|
| Test 4 – Compare seismic amplitude to 5 kg hammer drop from 1 m height, from a distance of 15 m. |
|
|
|
| Test 5 – Compare seismic amplitudes recorded 250 m from 3 x 12-lane highways in Toronto. |
|
|
|
| Test 6 – Microphone recordings. (Details and data shown in next section) |
|
|
|
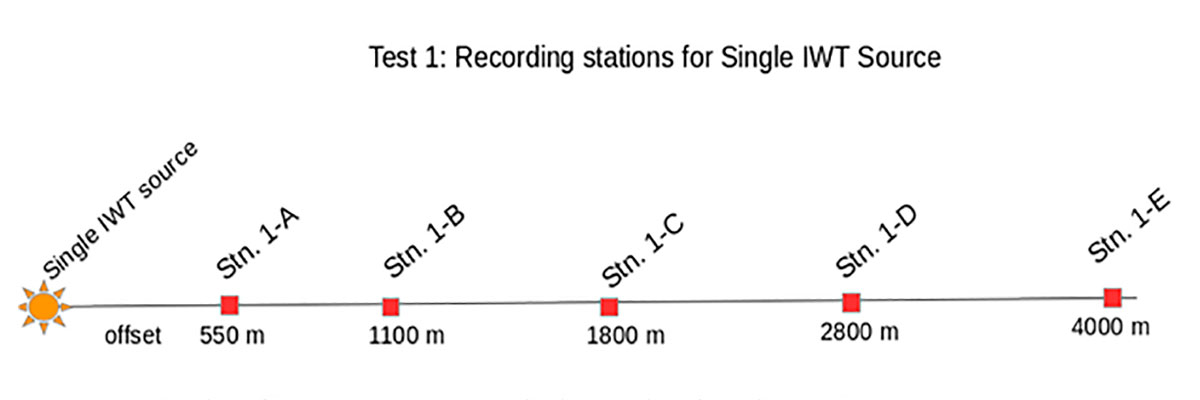
Test 1 – Walk-away test from a single IWT (no others within 7 km)
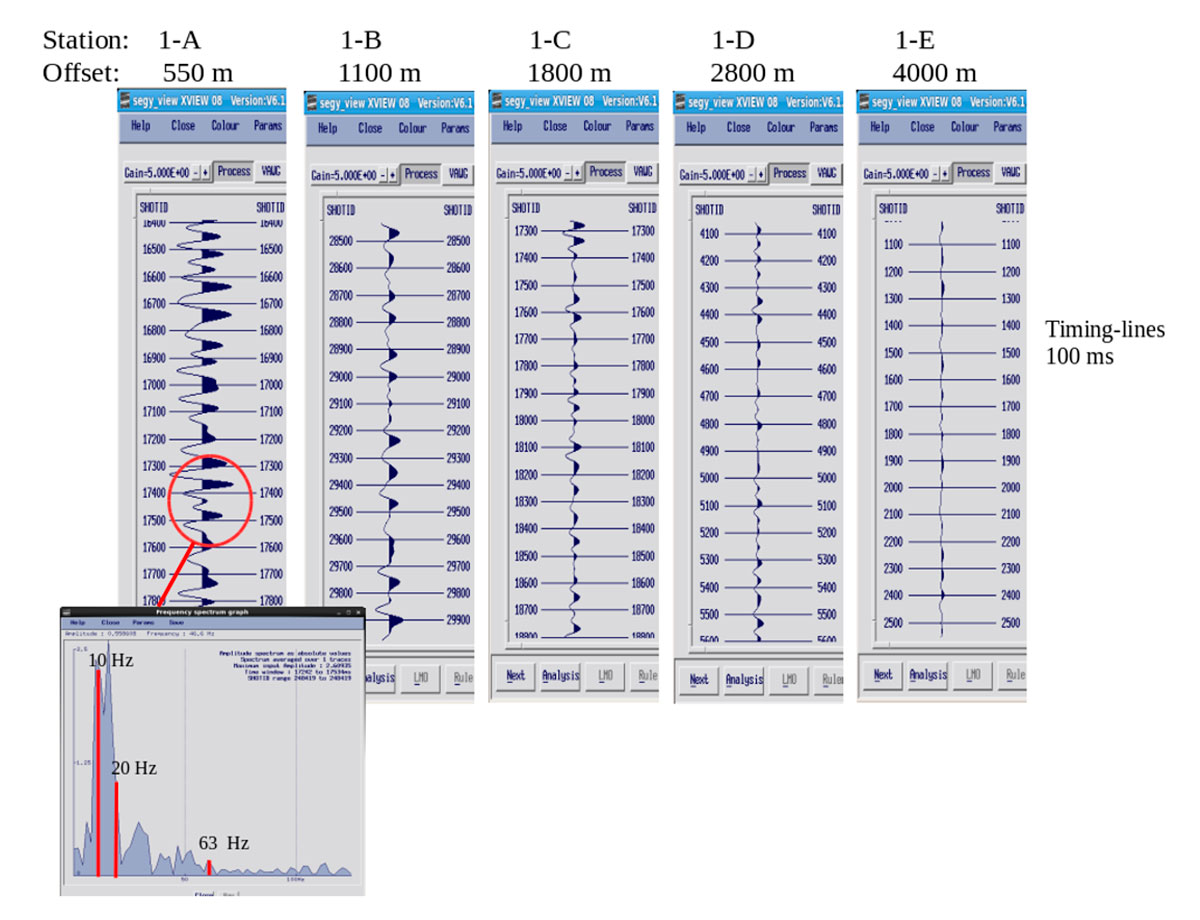
Test 1 was conducted on August 29, 2018, and the reported wind was 18 kph from the west. The IWT blade-pass interval was measured to be 0.8 seconds. Figure 5 shows a map view of the test configuration, and Figure 6 shows time series from each of the five stations with fixed gain, bandpass filter 0.1, 0.4, 15, 25 Hz, plus the amplitude spectrum of a pulse recorded at the station located 550 m from the IWT.
The seismic recordings from this single IWT source are considered free of interference from other turbines because there are no other IWTs within a 7- kilometer distance. The recording at 550 m offset has an event that is a good estimate of the source wavelet (see red ellipse). The recording at 1800 m offset has about 1/3 the amplitude of the recording at 550 m. The recording at 4000 m offset still includes a small amount of seismic energy from the IWT source visible at this fixed scale.
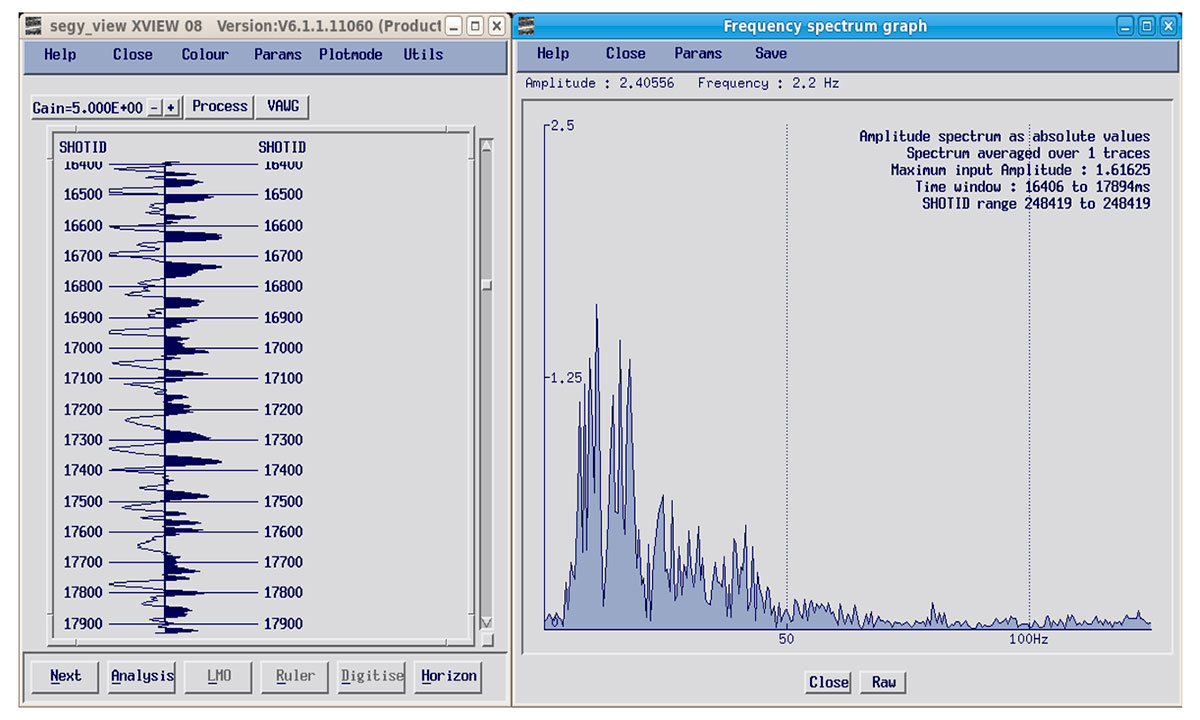
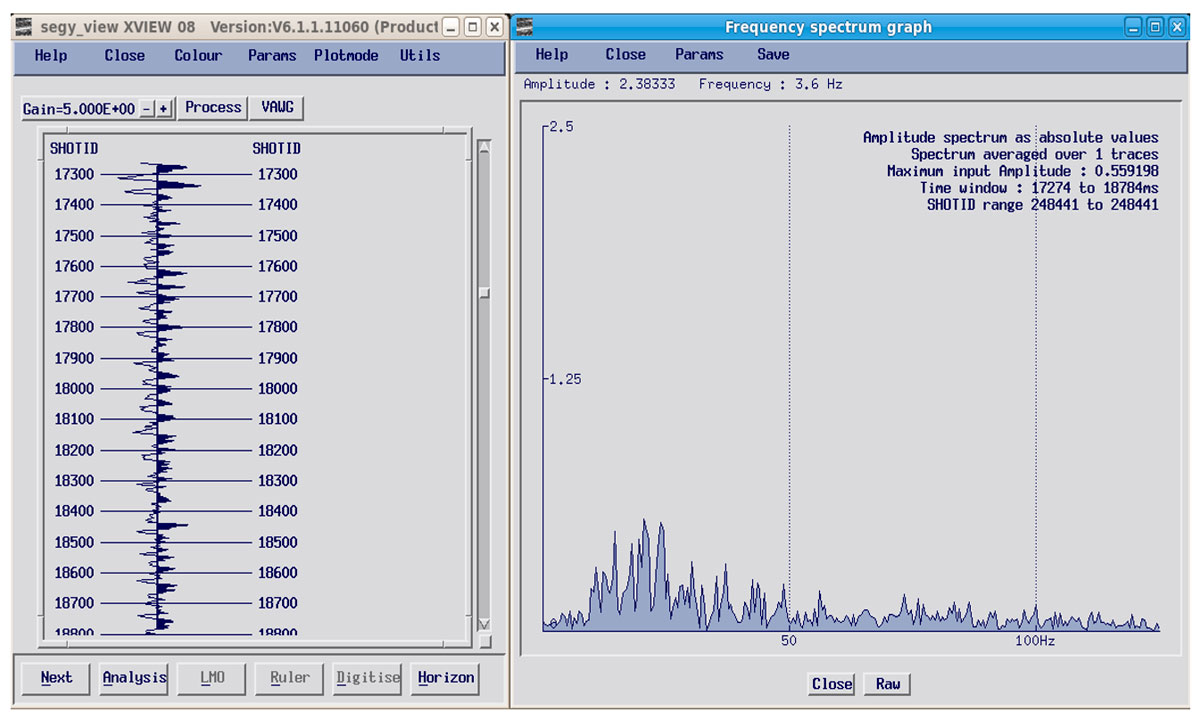
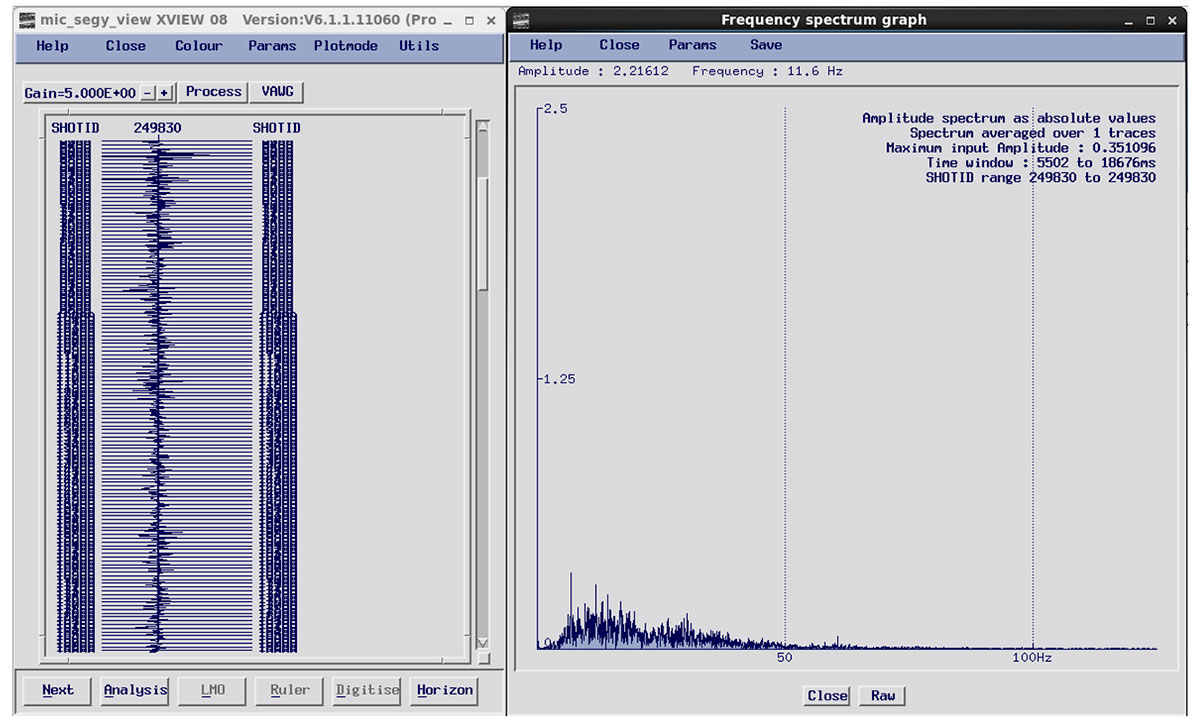
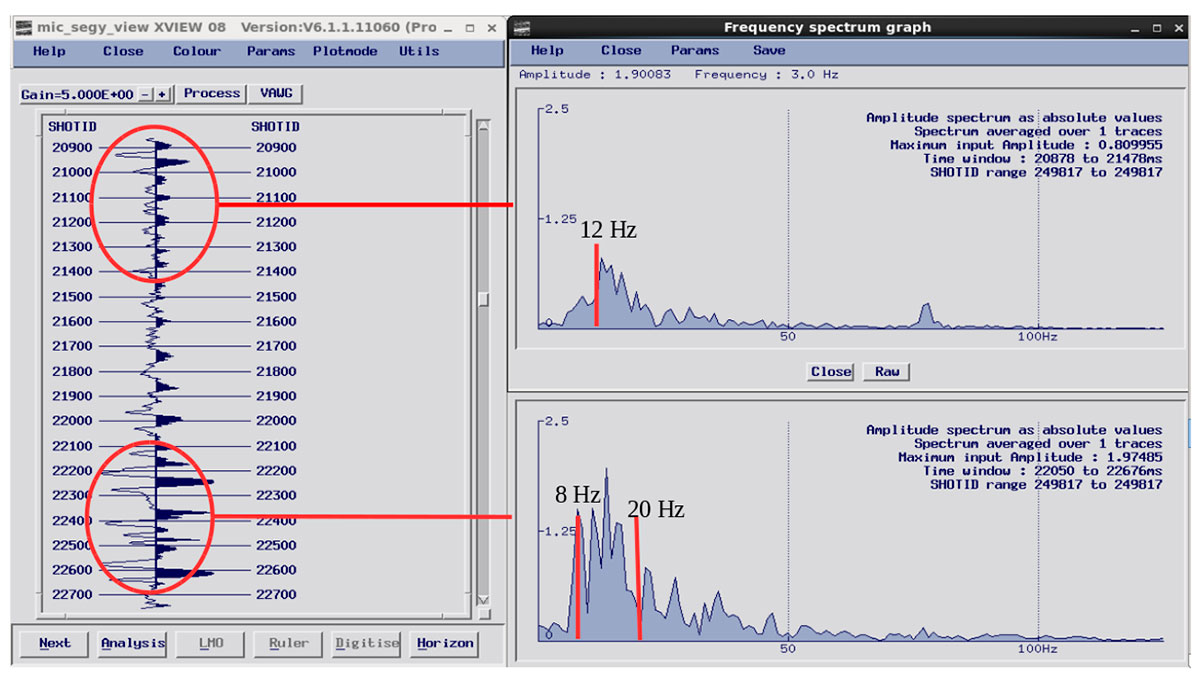
Figures 7 and 8 show examples of frequency spectra from Test 1, calculated from the 1.9 seconds of data shown, with fixed gain and no filter.
Test 6 - Microphone Recordings of the Air Pulses
Test 6 was conducted on October 9, 2018, and the reported wind was 20 kph from the south. The IWT blade-pass interval was measured to be 1.3 seconds.
The pulses and waves emanating from a group of 3 turbines were recorded using a microphone at a height of 1.5 meters from the ground for approximately 2 minutes. The recorded data were equalized to a flat response according to the frequency response of the microphone. It is interesting to look at a few of the air pulses because they are direct arrivals through the air and involve less interference and cancellation effect than the seismic waveforms that arrive at the geophone through several near-surface travel paths.
Long analysis time windows minimize the amplitude of frequencies involved in pulses or “transients” that are of interest to an observer during frequency analysis. One must peruse the time data to determine which small, relevant portions of time are of interest since the problem of air pulses affecting the ear parts is an instantaneous problem and not necessarily an accumulative effect, compared to machines that make continuous whirring rotation noise.
The amplitudes of the air pulses and waves are affected by the following physical and atmospheric conditions (Kelley, 1985; Shepherd, 1989):
- High winds: higher amplitude, pulses travel farther for air and seismic.
- High humidity: air pulses travel farther.
- Wind direction: air pulses are attenuated less in the down-wind direction; air pulses travel farther.
- Multiple turbine constructive interference effects: higher amplitudes for both air and seismic.
- Position relative to a turbine or to a cluster of turbines: creation of nodes or positions of high amplitude, 3 times more for seismic due to 3 velocities in near-surface.
- Distance of the turbines from the receiver: higher amplitudes closer to the turbines.
- Reflections from terrain and refraction downwards of air pulses and waves.
Conclusions
The analysis of the operating IWTs on the ground and the seismic and air-pulse recordings confirms that large horizontal axis Industrial Wind Turbines act like airgun seismic sources that create low frequency pulses approximately once per second. The audible part of the air pulse makes a sound like “whump” so, as per geophysical industry tradition, we should name the IWT a “whumper” seismic source (as opposed to a thumper or puffer which would require a faster rise-time on the pulse). Most of the amplitude of the pulse exists at frequencies below the audible range, so a person stopping by the roadside to listen to an IWT may not hear anything and is likely to think that they make no significant “noise” at all.
Two aspects of IWT-generated noise do not appear to have been adequately accounted for in the creation of regulations for the IWT industry: that the noise contains many spurious, high amplitude spikes, and that it is mainly found in the low, infrasonic frequencies. An impulsive noise source such as an IWT requires amplitude measurements over short time windows like 1 second and little or no averaging of data during analysis. Long analysis time windows and averaging amplitude over 1/3 octave band frequency ranges is an acoustics industry testing method appropriate only for higher frequency “whirring” machines like diesel generators or milling machines. Current Ontario Government regulations do not include testing frequencies lower than 31.5 Hz. “Noise” testing procedures for regulation of IWTs should be revised to include all low frequencies created by the IWTs because the low frequency events contain the most power and highest amplitudes.
Conversion of non-weighted peak pulse amplitudes from the microphone recording in Figure 9, at 550 meters offset in 20 kph winds including the full frequency range to 1 Hz, revealed peak Sound Pressure Levels of 65 dB or more. Additionally, the SPL noise limit specification should not be increased with increased wind speed as this makes no sense. Governments and agencies tasked with the regulation of IWT installations should review and revise their testing protocols, so that regulations that reliably protect the health of people and animals living in the vicinity of IWTs can be implemented.
Suggestions for Further Research
More testing and design work should be done on the IWT blade geometry and dynamics to eliminate the large, very low frequency air pulse (infrasound pulse) that is created when the IWT blade passes the supporting column.
To gain a better understanding of the complex wavefield created by a cluster of IWTs, several seismic and microphone datasets should be recorded under different wind and atmospheric conditions, using many receiver stations on a grid similar to a 3D seismic survey. This would allow real-time movies of the time-slices to be viewed, highlighting when high amplitude nodes appear across the area for both the microphone and seismic data.

Related Reading


Join the Conversation
Interested in starting, or contributing to a conversation about an article or issue of the RECORDER? Join our CSEG LinkedIn Group.
Share This Article