Summary
This paper presents a short history – and extended future – of the multicomponent (full-wave/vector/elastic) seismic method. The goal of the method is to more fully generate and record complete vibrations in the earth; then, use these recordings to enhance traditional P-wave arrivals and create complementary shear- and surface-wave pictures. Of the additional wavetypes recorded, the converted wave (P-to-S on reflection) has found the most use in resource exploration (including imaging through gas volumes, sand-shale discrimination, and fracture assessment). Acquisition has progressed with many new land (e.g., MEMS) and marine systems (cables and nodes). Processing has also improved, with novel migration and anisotropy procedures making much better images. Commercial software for multicomponent analysis and interpretation has helped create a cascade of innovative uses and case histories. As the demand for more crisp and informative subsurface imaging grows, so does the need for multicomponent seismic application.
Some multicomponent background
Let’s go way back. Since ancient times, seismology has been multicomponent. The earliest known seismic instrument (Figure 1), from the Han dynasty in 132 A.D. (Dewey and Byerly, 1969; Xinhua, 2005), relied on detecting horizontal motion.
When the earth shook laterally, a mechanism internal to the copper urn was likely activated inline with the incoming vibration and released a ball from the dragon’s jaws into the frog’s mouth. This indicated the direction from which the disturbance came – toward the earthquake’s epicenter – and its approximate time (from the loud sound of the ball’s drop). What a fine example of hodogram use! Note also that the instrument does not appear to have a vertical channel. To this day, much of the analysis of earthquakes (and hydraulic-fracture microseisms) as well as understandings of the deep Earth are based on multicomponent seismic recordings (Kennett, 2001).

What does resource E & D need?
The seismic method for resource exploration has been profoundly successful in transforming vibrations, induced in the earth from various sources, into interpretable subsurface pictures. However, the pressing need for sharper and more informative geologic images requires continuous improvement in our measurements and their analyses. Seismic technology has risen to these challenges by developing, for example, full-azimuth 3D acquisition with detailed amplitude, attribute, anisotropy, and attenuation processing (the “A” list); and time-lapse imaging. Nonetheless, a host of grand challenges for applied seismology remains. In exploring and developing the subsurface, we continue to need:
- a better structural picture
- further stratigraphic details
- indications of rock type
- petrophysical properties
- a description of faults/fractures/cracks
- a notion of the stress regime
- an estimate of the fluid content
- an idea of rock & fluid changes with production.
Using compressional or P waves is unlikely to satisfy all of these requirements. Certainly in well logging, where there is a choice of physical techniques, many types of measurements are made to extract this information. Multicomponent seismic imaging can be expected to help in all of these challenges.
Multicomponent SEISMIC definitions
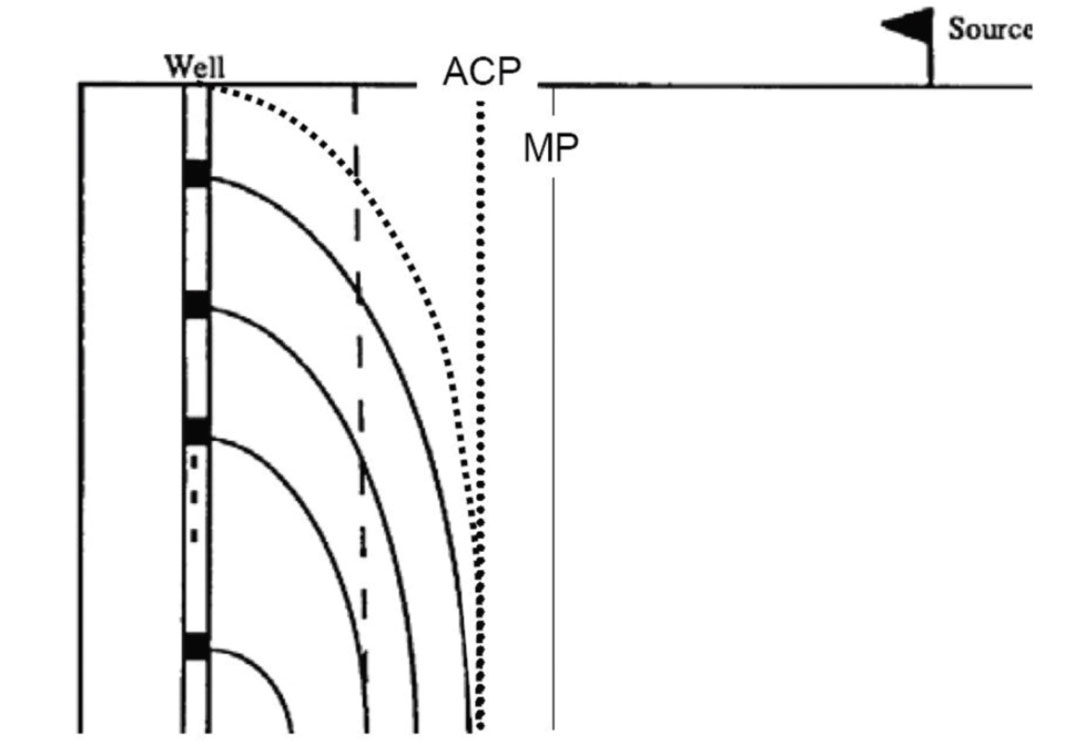
By multicomponent seismic, we usually mean that there is more than one element or type of motion sensor at the recording location. For example, there could be three orthogonal (three–component or 3C) geophones receiving vibrations from a dynamite shot or three seafloor accelerometers and a hydrophone (4C) monitoring an airgun. Less commonly, we could have oriented sources (e.g., vertical and horizontal vibrators). A 3C source being recorded by a 3C set of receivers would give nine gathers of data per shot (9C). There was considerable hope in the 1960s to use pure S-wave reflections to extract shear properties of the subsurface (e.g., Barkved et al., 2004). The SS event (S wave down and reflected as an S wave), like the PP event, has the simplicity of a symmetric ray path. This allows CMP gathering and stacking. SS analysis has been useful in some VSP, near-surface, and anisotropy studies. However, the near surface is generally unfriendly to S waves. Cary (2001) noted that, “The much lower cost of acquisition and processing, the far simpler logistics involved with using P-wave sources, and the higher-quality final products are all reasons why 3-C recording is winning out over 9-C.” Simmons and Backus (2003) concurred, “Nine-component 3D acquisition has not gained wide acceptance within industry…”. Gaiser and Strudley (2004) also observed, “the PS-wave section generally has a broader bandwidth and better signal to noise ratio (S/N) than the S-wave section”. So for S-wave or elastic information, attention shifted to the converted wave. The “converted-wave” terminology usually refers to a P-to-S conversion upon reflection or, equivalently, a P wave down and S wave back up. This PS mode (or C-wave from Thomsen, 1999) caught the imagination of investigators and a flurry of work was reported in 1985 on its gathering, positioning, and stacking (Behle and Dohr, 1985; Chung and Corrigan, 1985; Garotta et al., 1985). The asymmetry of the PS raypath (as described by Snell’s Law) was a complication in creating a PS section (Figure 2), but various procedures were developed to resolve it. The late 1980s and onward also saw the formation of academic and governmental consortia undertaking research in converted waves (including the Edinburgh Anisotropy Project, EDGER Forum at UT-Austin, the CREWES Project at the University of Calgary, CWP at the Colorado School of Mines, and the Dephi Project at Delft). Similarly, a number of seismic contractors developed expertise in multicomponent acquisition (including BGP, CGGVeritas, Geofizyka Torun, GeoKinetics, ION, PGS, RXT, and WesternGeco) and analysis (including the previous list plus Sensor Geophysical). And various energy companies (e.g., Apache, BP, ChevronTexaco, EnCana, ExxonMobil, Shell, and StatoilHydro) presented cases of the application of PS images. Marine multicomponent measurement received a huge boost in the ‘90s with the publication of remarkable images from the North Sea (Berg et al., 1994). To many, this was a revolution in seismic imaging. Converted waves were able to make a reflectivity section in gas-obscured sediments where P-wave imaging had largely failed. This, and subsequent “gas-chimney” examples, provided unambiguous demonstration of the value of the converted wave. While the PS conversion is the elastic wave that has found the most application in subsurface exploration, other interesting modes (such as the S-to-P on reflection or P-S-S and P-S-P events with a transmitted conversion) have specific applications too. In terms of enhancing P-wave data, the horizontal channels can be used to, for example, better characterize ground roll (which will then be suppressed on the vertical channel), thus allowing enhanced conventional P-wave images to be constructed (e.g., Kendall et al., 2005; Maxwell and Criss, 2006).
Recent Summaries
The 2000 SEG/EAGE Summer Research Workshop in Boise, Idaho drew many participants, from around the world and across geophysical sectors, who were interested in multicomponent seismic technology (Gaiser et al., 2001). While a number of geophysical problems were said to be effectively addressed by converted waves (imaging below gas clouds, imaging targets of poor PP reflectivity, delineation of clastic lithologies, and increasing shallow resolution), it was noted that, “Although the potential for this technology is great, much work remains before it becomes financially viable for both contractors and oil companies.” Gaiser and Strudley (2004) and Stewart et al. (2002; ibid, 2003) provided mid-term summaries of the converted-wave seismic method and its applications. Fast-forwarding to the next major SEG/EAGE Workshop on Multicomponent Seismic Methods in Pau, France, we found that some things had changed (Lynn and Spitz, 2006). There were many more case histories of converted-wave use and the SEG/EAGE 2000 list of geophysical problems successfully addressed was further established. In addition, 3-or 4-C recording was making a significant impact in improving P-wave imaging via multiple attenuation, wideazimuth illumination, and ground roll filtering. Participants were more convinced of the PS value in density estimation, stress characterization, and reservoir monitoring, but less inclined to be positive about deep imaging and permeability estimation. Interestingly, the most critical areas for improvement, indicated in the Workshop’s summary, were in the processing and interpretation of multicomponent data. In 2006, the RECORDER of the Canadian SEG published a forward-looking overview of seismic methodologies including multicomponent (see Gaiser et al., (2006), Kendall (2006), and Moldoveanu (2006).
Where are we now?
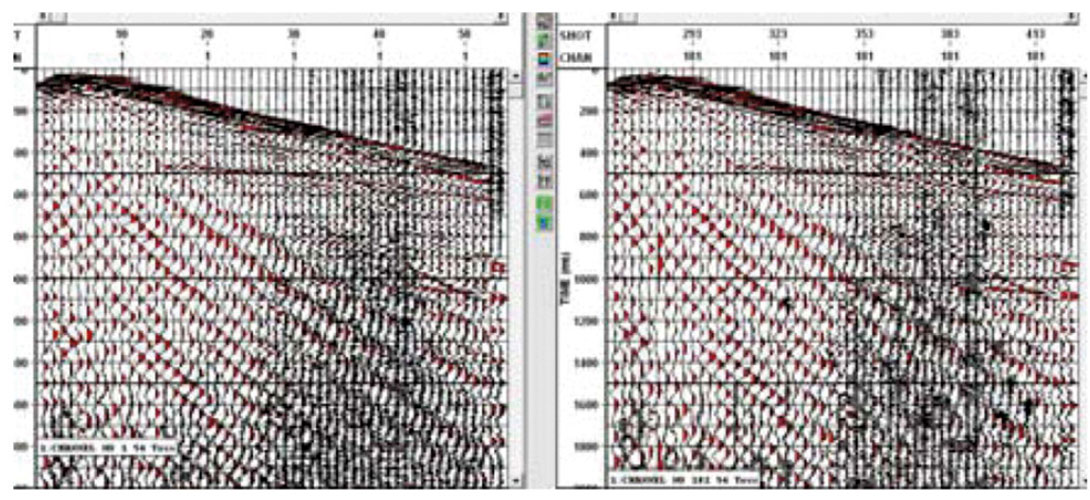
In the seismic acquisition world, a major change has been the introduction of micro-electromechanical systems (MEMS) sensors. They have the ultimate promise of providing broaderband, lower-power, reduced-weight motion sensing systems than those based on analogue geophones. Although, at this stage, side-by-side recording of the two sensors provides quite similar results (Figure 3). We will stay tuned for improvements. Adding an air-pressure sensor may provide some benefit in reducing air-coupled noise on the ground-motion measurements (Alcudia and Stewart, 2008). In addition, use of land streamers (draggable geophone strings) can enhance the economics of some seismic surveys and give a high-resolution near-surface picture (Suarez and Stewart, 2008; Pugin et al., 2009).
Development of further ocean-floor bottom capabilities also has some advantages over conventional acquisition – towed streamers – including the ability to operate in congested areas, avoid currents, provide greater repeatability, and complete azimuthal coverage (Durham, 2009a; ibid, 2009b). Fiber-optic marine cables for permanent reservoir monitoring may be another enhancement (Bett, 2008). Rønholt (2008) and Walker (2008) show further applications of ocean-bottom seismic data.
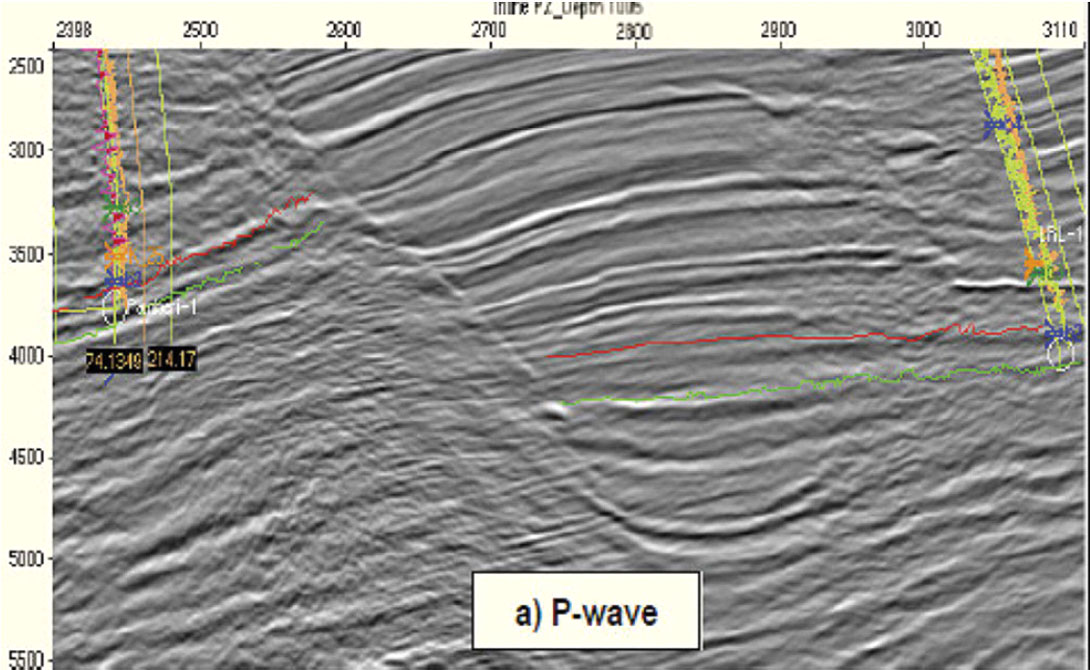
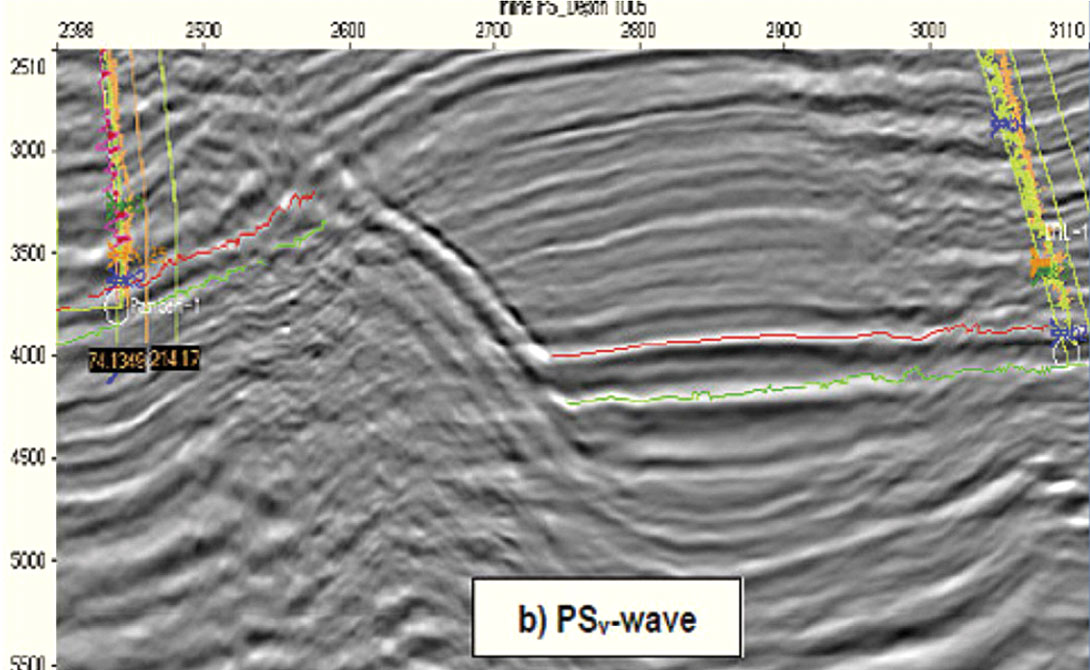
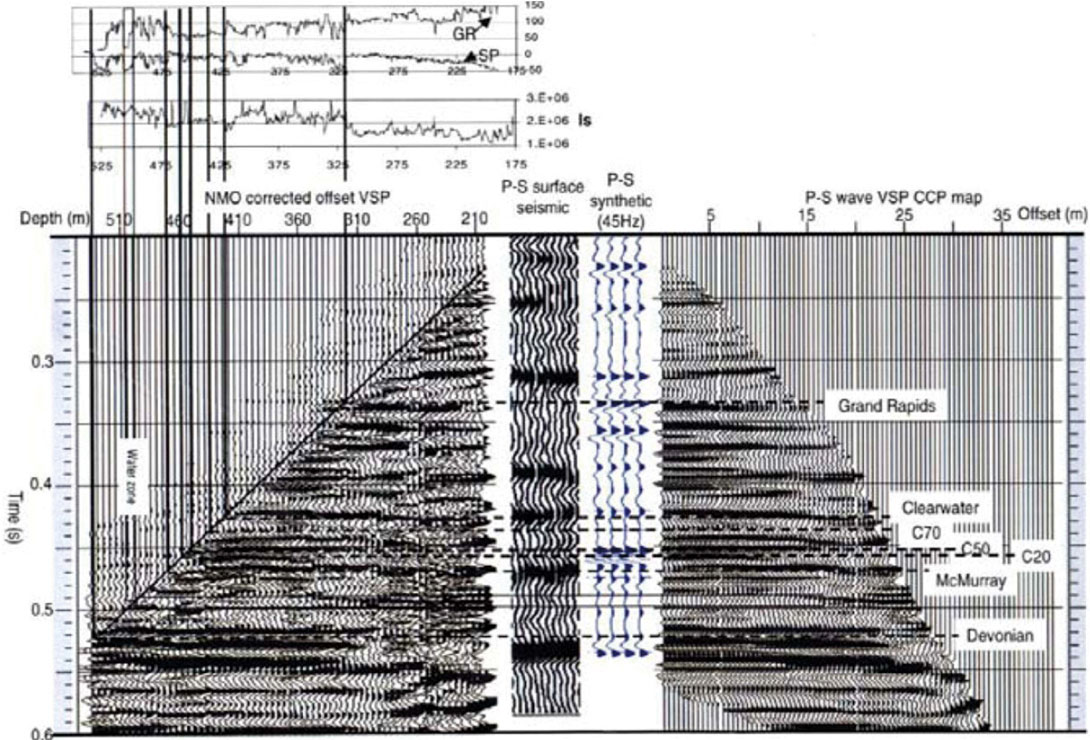
PS analysis has also improved considerably from the simple depth-variant mapping and DMO days. An excellent example, from offshore Trinidad which used an OBC 4C system, is given by Johns and Sarmiento (2007). They used a Kirchhoff-type anisotropic prestack depth migration to produce PP and PS images that highlight different aspects of the subsurface (Figure 4) – see the bright PSv events around 4000m depth. The authors indicate that this PSv image may provide further drilling leads.
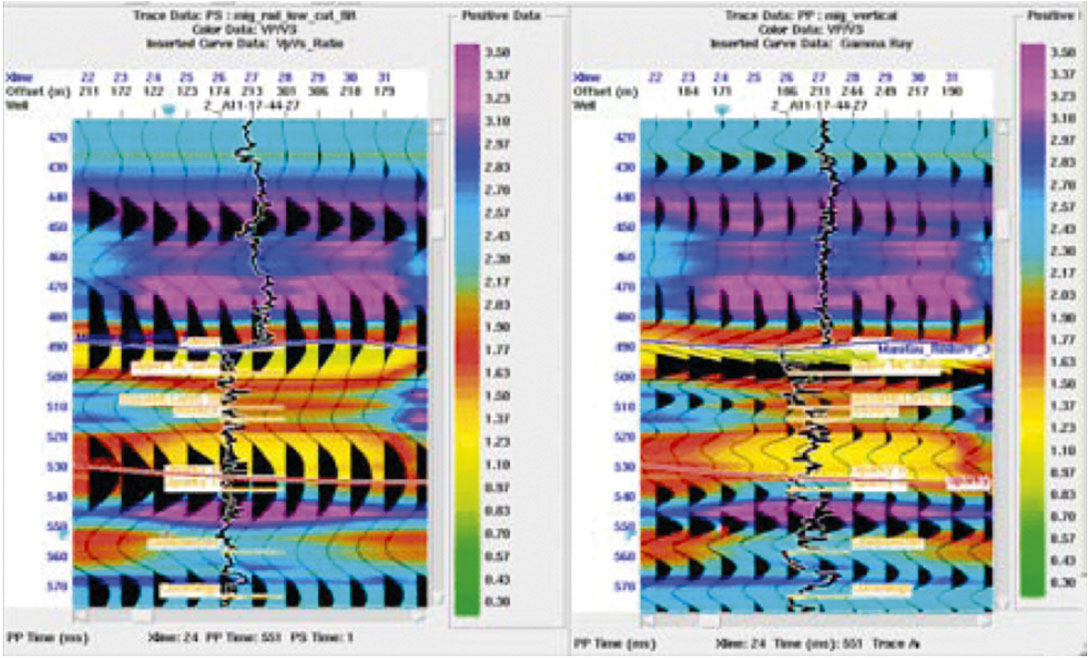
In addition to improved data processing, interpretation software packages are creating more detailed and useful results. Varga and Stewart (2009) show an example of searching for heavy oil sandstone reservoirs by correlating and time squeezing the PS data to match that of the PP (Figure 5).
How can we advance?
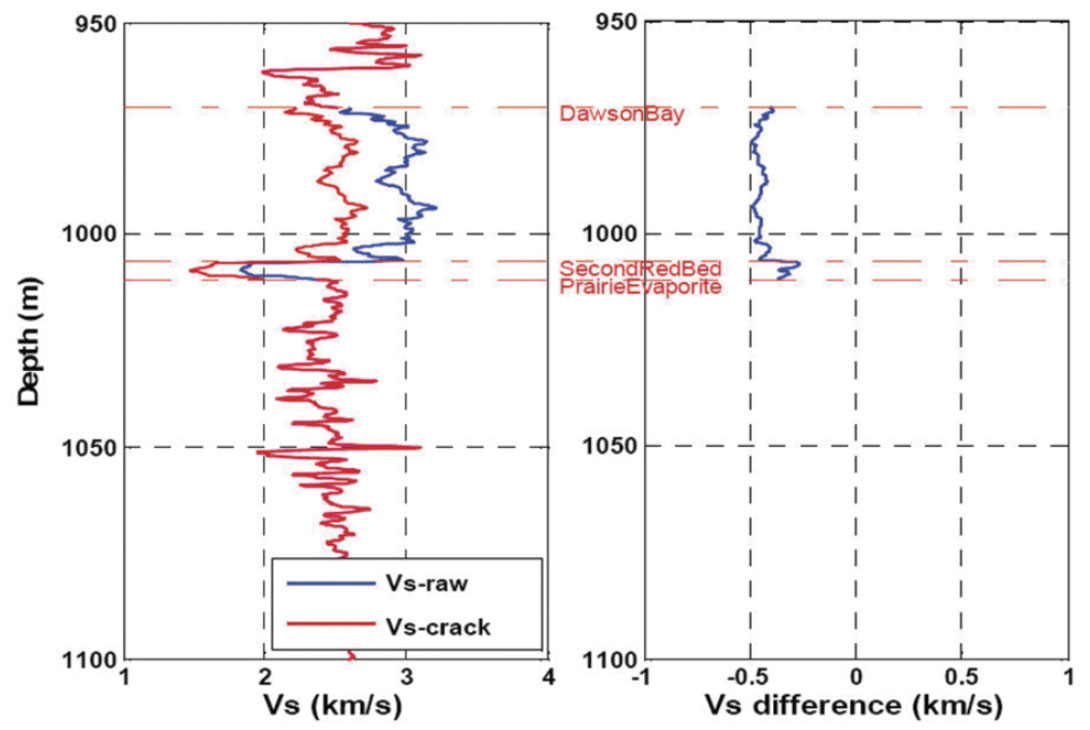
There is much work to be done in attaching rock properties to their multicomponent seismic expression and vice versa. Storvall and Brevik (2008) show the strong empirical relationship between porosity and shear modulus (as well as Vp/Vs) for shales from the North Sea. Mechanical and chemical compaction regimes can be inferred from shear modulus as might a temperature- depth profile. Elastic anisotropy may also be an indicator of shale composition and maturity (Vanorio et al., 2008). Goodway (2009) suggests that shear rigidity (μ) is a key factor in understanding resource-play shales; in particular, high μ correlates with desirable brittleness (silica content) in hydraulic fracturing. Natural, as well as induced, cracks may alter seismic velocities significantly (Figure 6). There is a strong Vs response in sands in the North Sea (Avseth et al., 2008) and many other sandstones around the world.
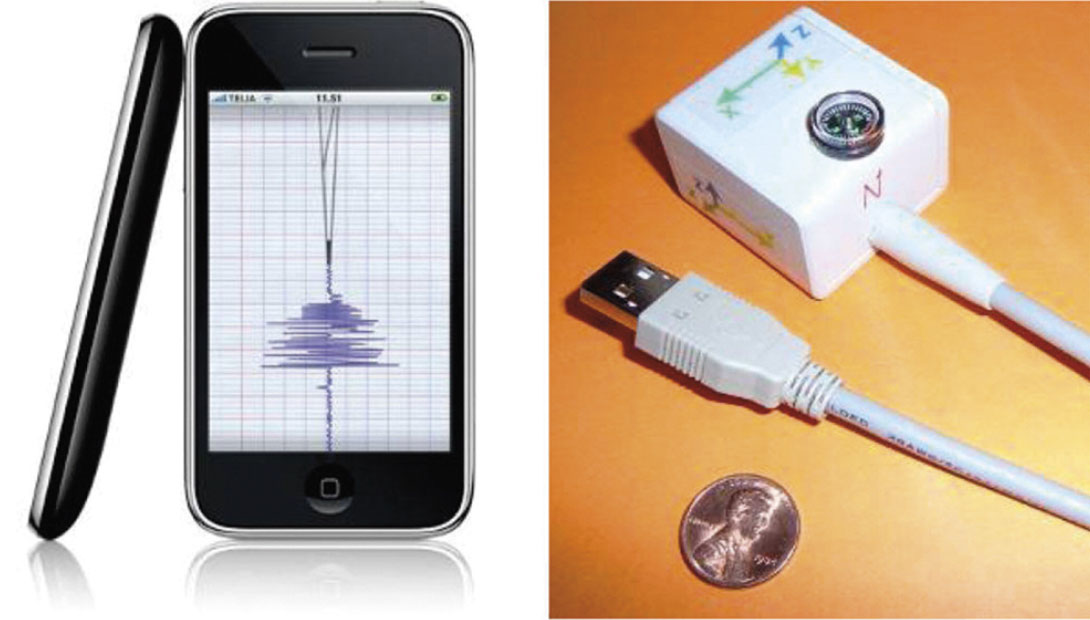
Technologies such as the iPhone (Figure 7), with its 3C accelerometer, microphone, data processor, large memory, GPS, and wireless and networking capabilities, may have much to offer seismology (at least in concept). Plus, the juggernaut of consumer electronics will continuously drive down costs – it’s projected that there will be some 30 million iPhones (90 million accelerometers) sold in 2010. Another system to watch is the Quake-catcher network from Stanford University. Inexpensive 3C accelerometers ($49), attached to a PC or Mac and networked to other users and analysis around the world, can sense and process strong-motion earthquakes. Jack (2009), in reviewing the remarkable progress in seismic recording systems over the last decade and imagining their future, gently suggested a forwardlooking target of $50/seismic recording channel. We may be there already!
A converted wave starts out in life so well – it has the same temporal frequency as its generating P wave (Geis et al., 1996) and higher resolution with its shorter wavelength. However, this happy situation doesn’t last long (Figure 8).
There will be attenuation, birefringence, multipathing, multimoding (Figure 9), and the effects of extreme velocity heterogeneity. In accounting for these effects, we can imagine improvements in almost every step of PS analysis including: better statics estimates (perhaps from ground roll inversion or multipathing refractions or Swave receiver functions) and downward continuations, enhanced treatment of anisotropy (Tsvankin and Grechka, 2006), improved Q compensation, further noise reduction, and suppression or use of multipaths and multimodes, and more general anisotropic prestack depth migrations.
As indicated before, the advent of horizontal drilling with multi-stage completions (via hydraulic fracturing) has transformed huge volumes of previously uneconomic rock into productive hydrocarbon reservoirs. Microseismic monitoring methods have rapidly developed to assist in assessing the extent of reservoir enhancement. These methods have generally been multicomponent (e.g., De Meersman et al., 2009). While only direct arriving P and S events are now usually processed, converted-wave events will undoubtedly be present and ultimately useful.
The goal of our exploration strivings is to find and produce resources. Gaiser and Strudley (2004) indicate that well over 200 multicomponent surveys had been acquired and processed from 1999-2004. There may have been a similar number in the last five years. Does the multicomponent seismic method economically help find resources? Certainly “yes” in some cases. What is the technique’s overall value at this stage is more difficult to assess. But, anecdotally, some of the service companies are finding multicomponent seismic acquisition and processing to be profitable. And we’re undoubtedly learning much more about the subsurface.
Conclusions
The multicomponent seismic method, in particular that of converted waves, has been developing for about the last 25 years. Kendall (2006) wrote that multicomponent seismic is quickly repositioning from, “unmanageable to indispensable.” Some groups have used PS events for considerable benefit. The development of traditional (P-wave) seismic imaging has inspired and required hundreds of research papers per year for many decades. We expect that the superset of acoustics (that is, elastics) will occupy us for many more years with enriching results.

Acknowledgements
I would like to acknowledge the efforts of the CREWES Project (and its sponsors) at the University of Calgary for their many contributions to multicomponent seismology.
Related Reading


Join the Conversation
Interested in starting, or contributing to a conversation about an article or issue of the RECORDER? Join our CSEG LinkedIn Group.
Share This Article