Introduction
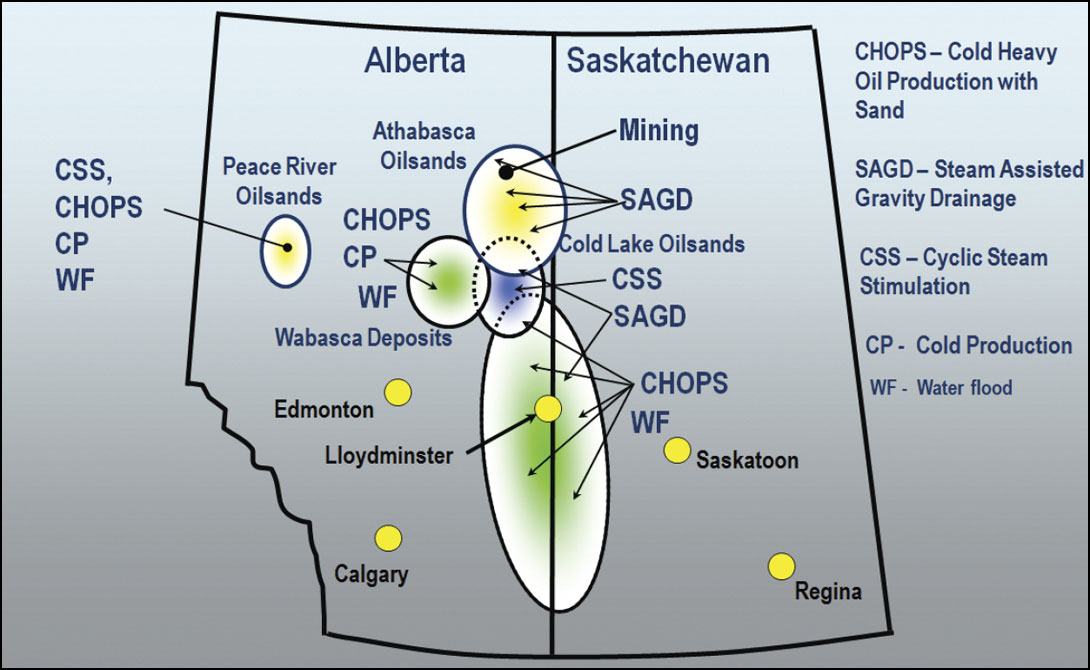
A number of papers have been published that show seismic amplitude anomalies in CHOPS (Cold Heavy Oil Production with Sand) fields correlated with production (e.g. Hedlin & Chan, 2009; Chen et al, 2004 and Mayo, 1996). Modeling and 2D seismic experiments conducted in 2002 by Husky Energy suggested that drainage in areas caused by production in their heavy oil fields near Lloydminster (see Figure 1) would produce seismic anomalies that would be mappable in 3D. In-fill drilling locations targeting virgin un-drained reservoir could then be identified.
Accordingly, a 3D seismic survey was designed, acquired, processed and interpreted in the winter of 2003/4 and a number of new infill locations were subsequently drilled during the next five years. In order to study the time lapse nature of the seismic anomalies, another seismic survey was acquired in winter 2008/9 and co-processed with the 2003 survey (a portion of a 2006 survey was merged with the 2003 survey in order to duplicate the areal coverage of the 2008/9 survey).
This paper summarizes the results of co-interpreting these two seismic surveys.
Seismic Anomalies
Both vintages of 3D seismic data were processed using a 4D AVO friendly workflow to ensure they were suitable for simultaneous prestack inversion and interpretation. There were no trace by trace processes applied; only surface consistent algorithms were used. At each stage in the processing, repeatability metrics were computed in order to evaluate the effectiveness of the process.
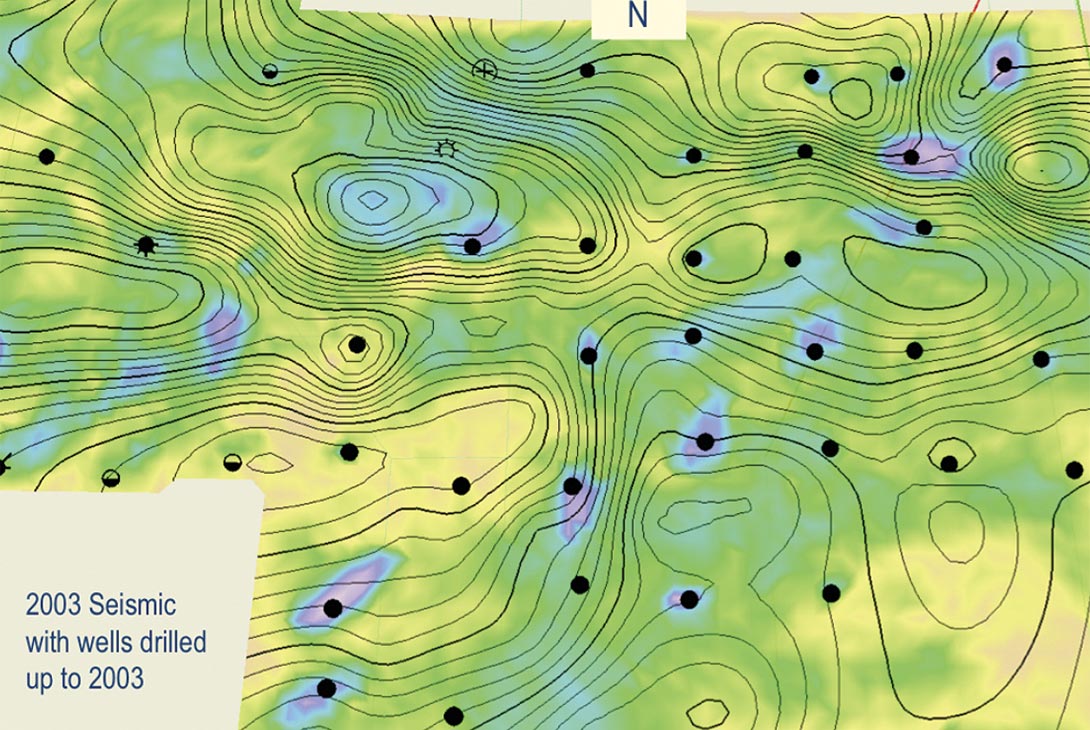
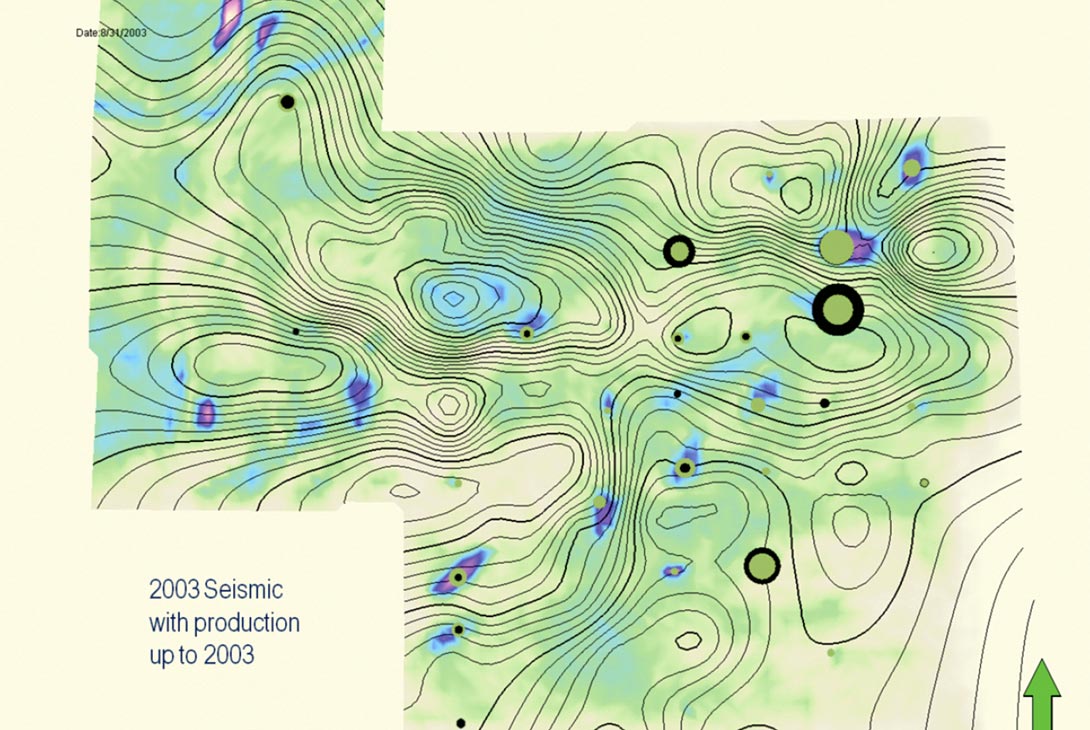
Figure 2 shows an envelope attribute extracted from the 2003 survey. The attribute shown is the maximum amplitude from top reservoir to base reservoir with pink colors representing high amplitude anomalies and yellow colors depicting low amplitude anomalies. The black dots are the locations of wells drilled up to 2003. Note that most of the anomalies are concentrated at the well locations.
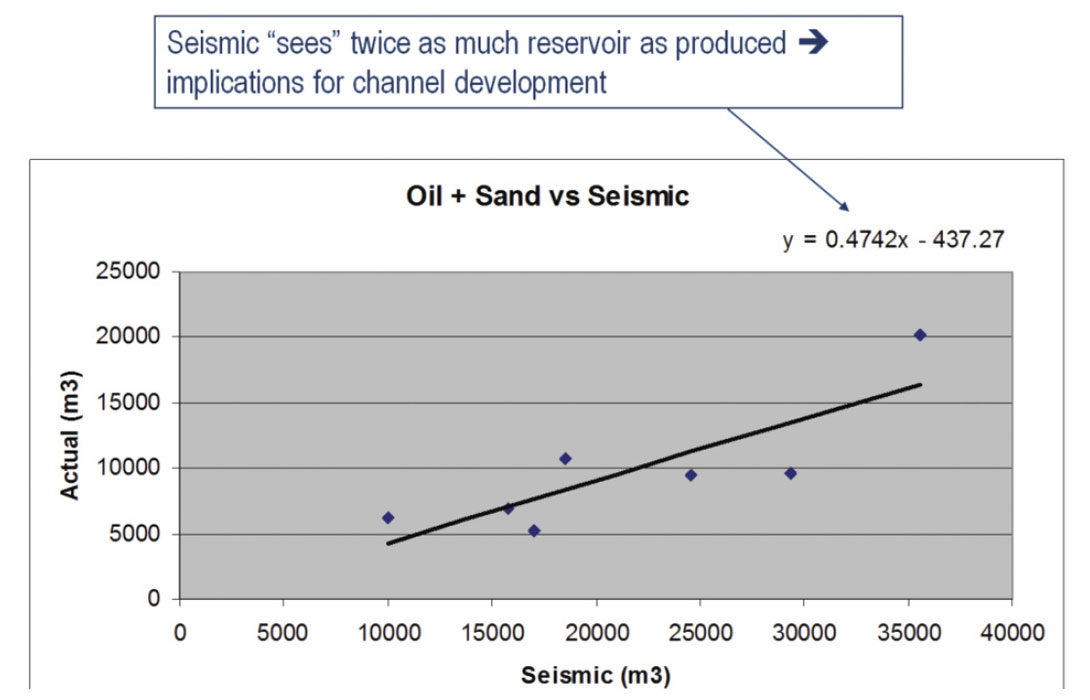
The seven largest anomalies in Figure 2 were extracted as geobodies and the volume (m3) was cross plotted against actual sand and oil production (Figure 3). The seismic volumes were downscaled using 34% porosity and 15% water saturation. The agreement is reasonable with the seismic over predicting actual production by a factor of 2.
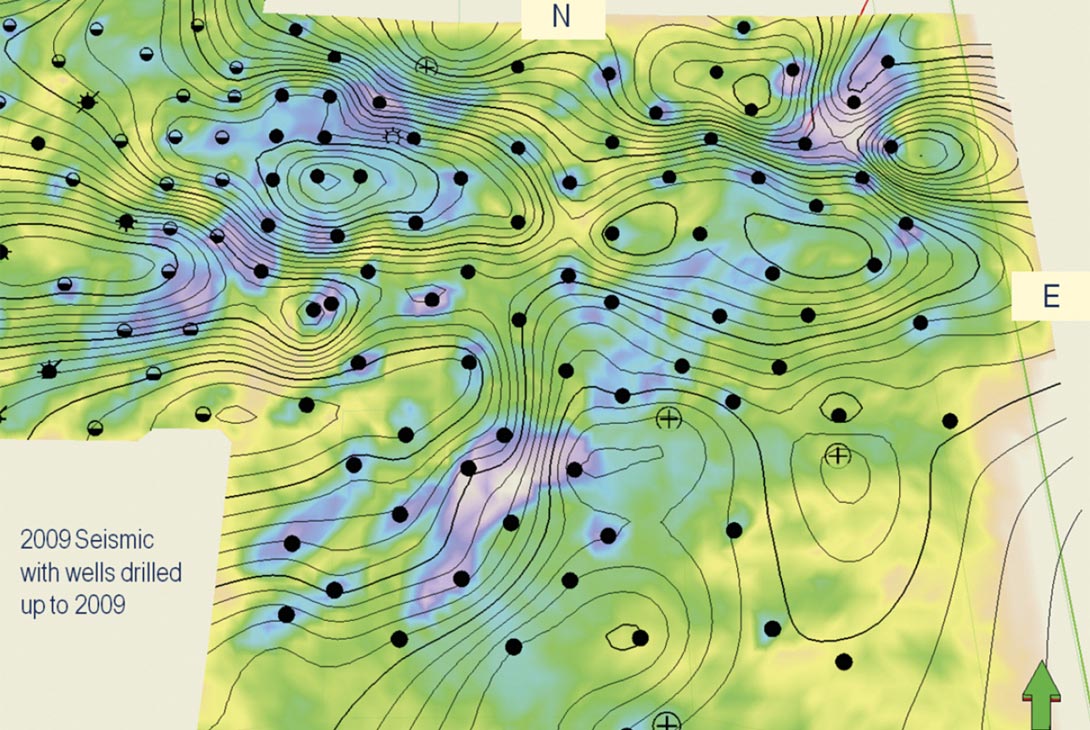
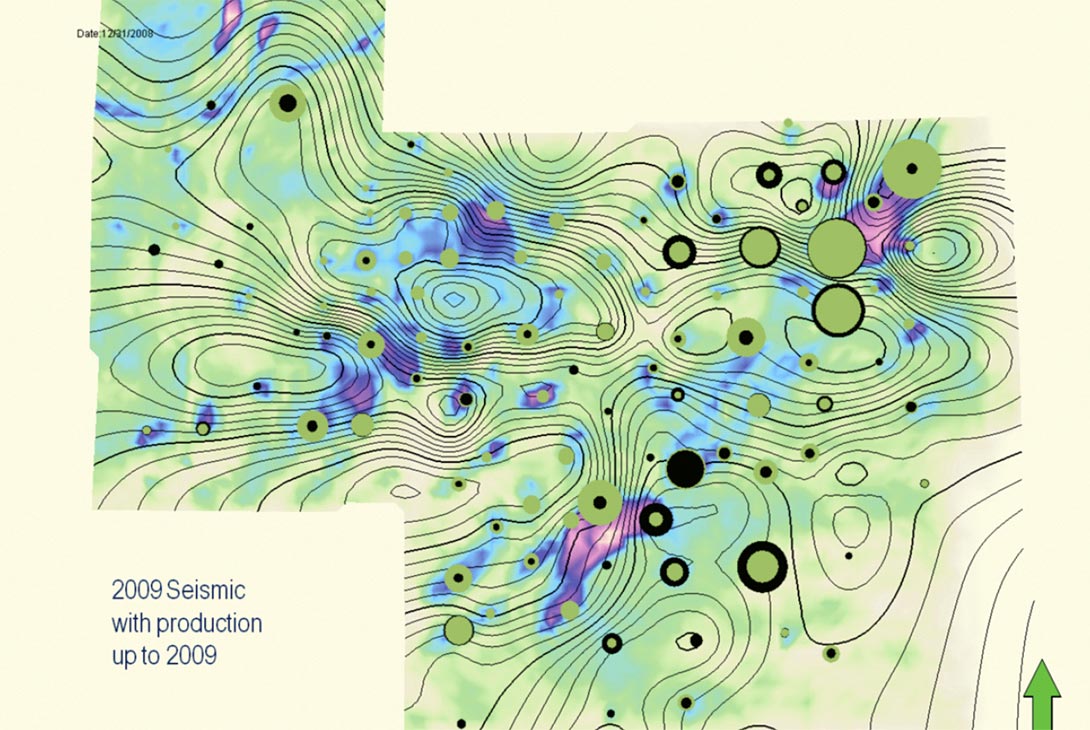
The envelope attribute for the 2009 survey is shown in Figure 4. Note that most of the 2003 anomalies have increased in spatial extent but in some cases appear to be lower in amplitude. Also, a number of new anomalies appear due to the 2003-9 in-fill drilling program. As with the 2003 seismic survey, the correlation between seismic anomaly and drilling location is obvious.
Time Lapse Interpretation
Subtracting the 2009 seismic envelope from the 2003 envelope and extracting the same type of attribute as displayed previously results in Figures 5. The attribute plotted in each figure is identical, however, in Figure 5a we highlight zones which have brightened between 2003 and 2009 as a result of in-fill drilling whereas and in Figure 5b we highlight 2003 zones that have dimmed. One hypothesis is that those wells that produce dominantly foamy oil brighten whereas those that have high water cut dim – this becomes more obvious when we post production discs onto the attribute displays.

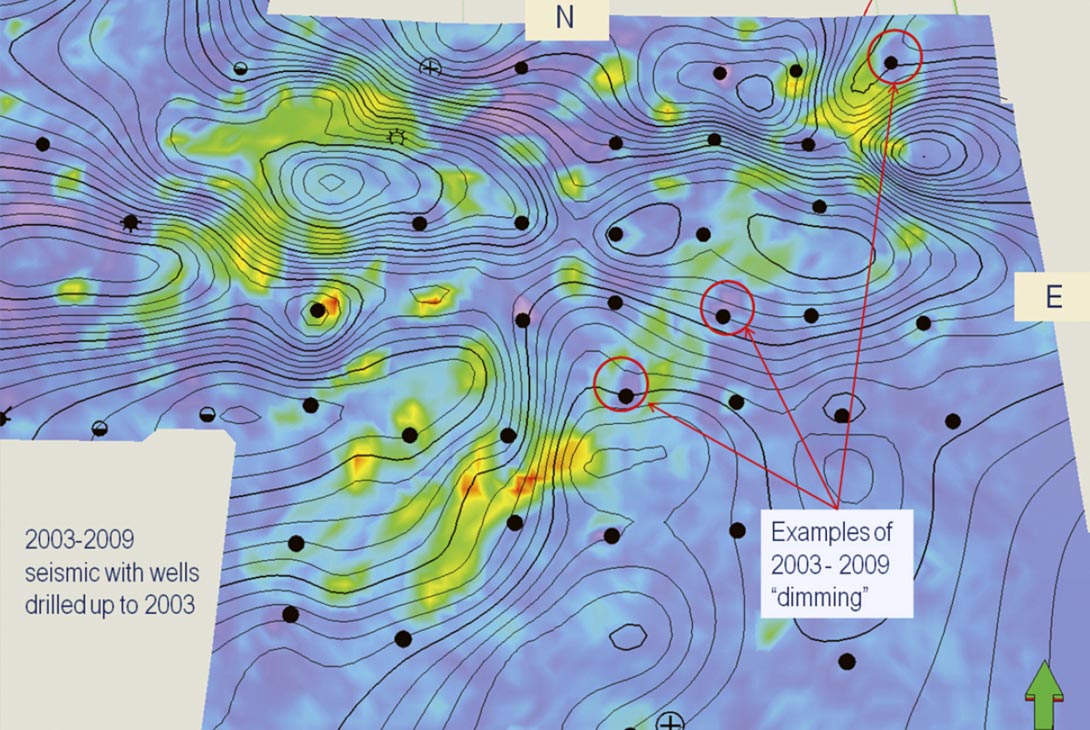
Figure 6 shows an enlarged attribute display for both 2003 and 2009 seismic surveys and the corresponding production data at the well locations. The production discs are superposed – when you see either a narrow water rim around an oil circle or a narrow oil rim around a water circle, the corresponding water cut is approximately 50%. There is evidence from these types of plots that when the water cut becomes large, the seismic anomaly becomes less pronounced, whereas, with dominant oil production, a strong seismic anomaly exists.
Model for channel development
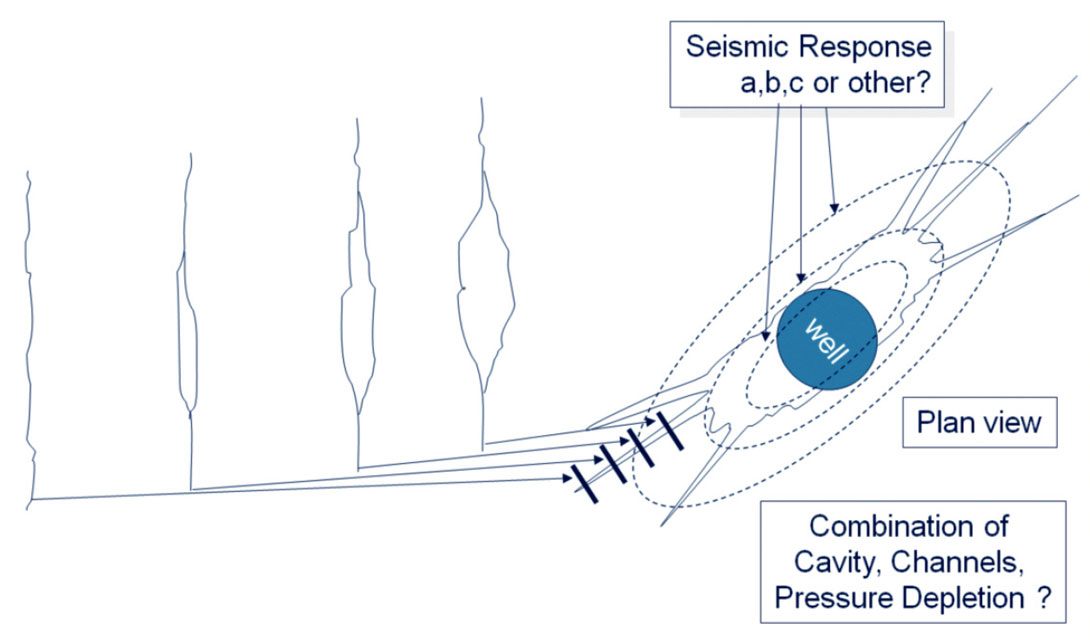
A potential model of channel development and associated seismic response is shown in Figure 7. We hypothesize that the seismic is “seeing” both the cavity and the channel like wormholes thus overestimating the production volume – this is consistent with the crossplot data shown previously. Obviously, this conjecture would have to be supported by field observations of channel growth. In addition, it has been noted that the NE-SW trend of the anomalies correlates with the regional stress anisotropy. This, may however, be a particular feature of this field and not generally observed in CHOPS production in Alberta/Saskatchewan.
Conclusions
A fundamental result of the study showed that seismic anomalies can indeed be mapped and correlated to production effects. This leads to the conclusion that the drainage area of CHOPS fields can be effectively monitored by 3D seismic data.

Acknowledgements
We would like to thank our colleagues at Husky Energy (Scott Emmond, Larry Mewhort) and Schlumberger (Frederik Horn, Jon Ingham, Jose Rivero, John Zhao) for many discussions involving ideas presented in this paper.
Related Reading


Join the Conversation
Interested in starting, or contributing to a conversation about an article or issue of the RECORDER? Join our CSEG LinkedIn Group.
Share This Article