Truth to say, for most of the three decades that we’ve been involved, tsunami research has been a fairly sleepy field. There happened the occasional tsunami in Japan or Central America and the odd Pacific warning issued for never-materialized waves [“tsu-NO-mi” broadcast the next day’s headlines], but not much grabbed people’s attention for long. The past few years however have noticed a change of tide (sorry about that) in tsunami perceptions. Certainly this year’s events in the Indian Ocean forged the change, but the turn began earlier primarily due to massing information about “exotic” tsunami sources like submarine landslides. With accelerating increases in sonar technologies, scientists began spotting undersea landslides everywhere — in submarine canyons, on continental slopes, adjacent to seamounts, and off the flanks of oceanic volcanoes. Like terrestrial slides, the submarine slides spanned a vast range of volume from <0.01 km3 to >1000 km3 [Figures 1, and 2]. With the recognition of abundant landslides underwater, recognition of their tsunami hazard followed. Folks living near shorelines that never faced risk of quake-generated waves suddenly found themselves exposed. Moreover, the largest landslides of the bunch were predicted to parent tsunami that dwarf any quake-generate one. Fueled initially by BBCs television presentation “Megatsunami, Waves of Destruction” and given second wind by “Yes it will”, “No it won’t” arguments among tsunami researchers, mega-tsunami captured public imagination. Whether megatsunami science, or mega-tsunami hype, interest in natural hazards of all types blossomed along with the boutique television networks: The Discovery Channel, The Nature Channel, The Weather Channel, and surely soon “The Catastrophe Channel”.
The Canadian Society of Exploration Geophysicists has asked us to contribute a piece about recent tsunami developments and we’ve chosen to lightly touch on a wide suite. The format is unusual in that each case illustrated below is accompanied by one or more Quicktime movie links (Table 1) that readers can click to view the figures in action.
I. La Palma: Year 550,000bp and Soon Again
Like its fellows in the Canary Island chain, the volcanic island of La Palma, has experienced cycles of growth and partial collapse. Its flank last failed 550 thousand years ago. Since then, new Cumbre Vieja volcano has filled the vacant scar. For the last 125 thousand years this volcano grew steadily but in the last 7000, its structure changed. It now mainly erupts along a north–south trending rift that splits the mountain in half. Moreover, during an eruption in 1949 a fault broke surface along the crest of the volcano and part of its western side slid 5m down and toward the ocean. The volcano again may be showing initial stages of instability. While certainly collapse is not imminent and it may take many eruptive cycles over the next few thousand years to give it that final shove, the volcano will collapse so it is sensible to consider the consequences.
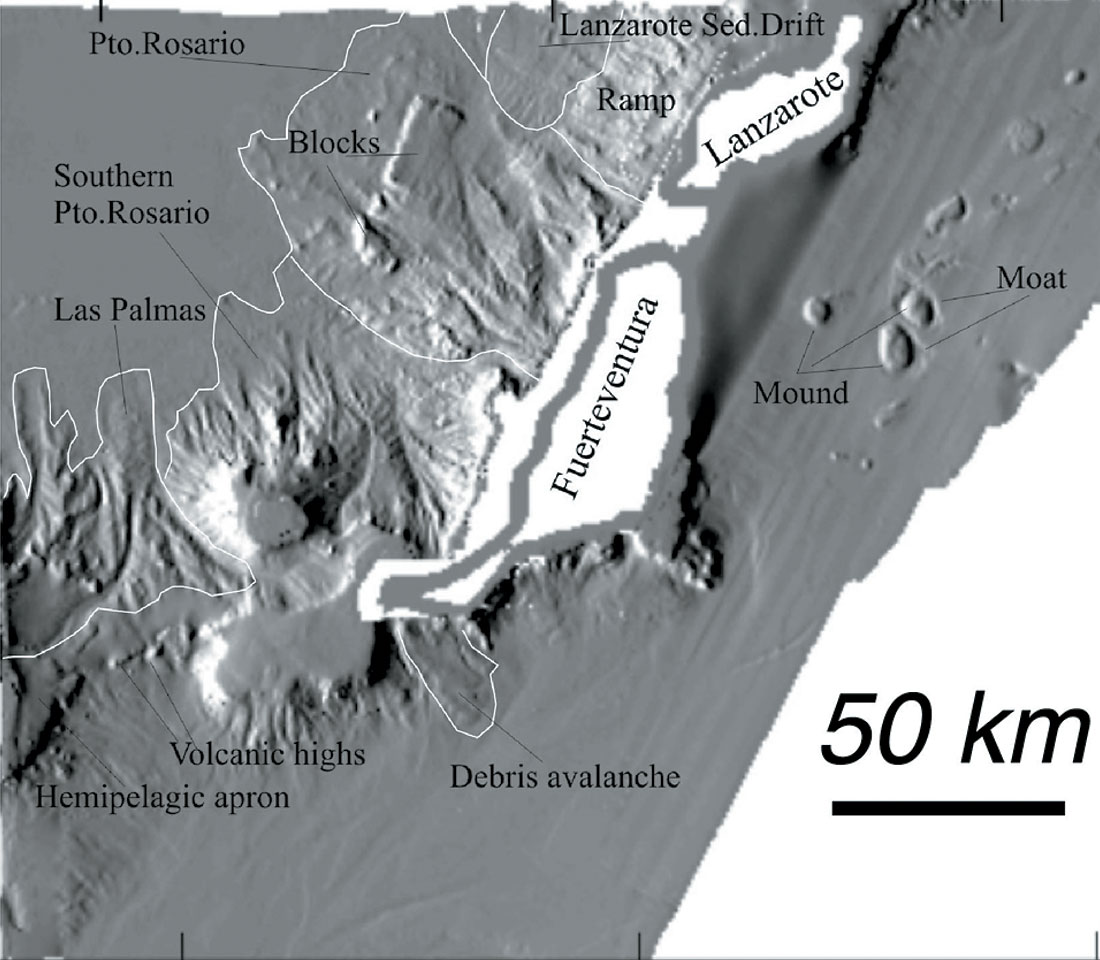
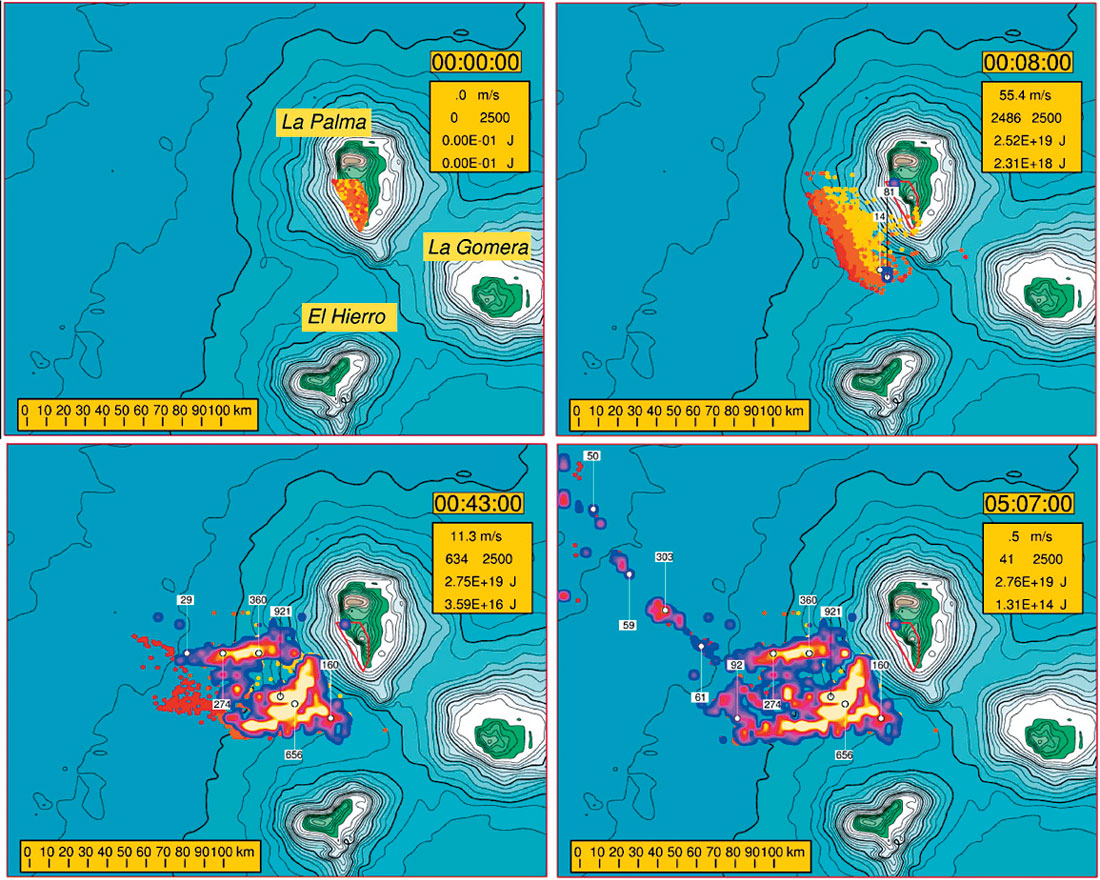
The granular landslide mass in Figure 3 visualizes the next Cumbre Vieja collapse when – 500km3 of material sluffs off toward the west (Ward and Day, 2001, 2005). Before and afterwards, minor slides might occur, but because the bulk of the mass is interconnected and self supporting – like a house of cards — when it goes it goes. Sonar images of neighboring slide debris fields suggest as much (Figure 2). Topography west of La Palma plunges from +2000m to –4000m in 60 km. Riding this slope, the slide accelerates to 100 m/s in 4 minutes. On its dive to the seafloor, the mass deforms but remains “clump like” for at least ten minutes before the higher-friction components begin to grind to a halt. Within an hour, 3/4 of the slide mass has stopped. A tiny fraction of material pulses out in braided streams of low friction turbidites that run on the nearly flat seabed for several hours and hundreds of km more. Attempts have been made (Masson, 1996) to interpret the chronology of distant turbidite cores directly as the chronology of Canary Island landslides. This is dicey business in our mind, like standing at the finish line of a marathon and inferring the configuration of the runners at the starting gun. Mega slides have lots of power. This La Palma model frees 3x10¹⁹ J [7000 mega ton TNT] of gravitational energy — roughly equivalent to the energy of all the world’s nuclear weapons combined.
http://es.ucsc.edu/~ward/LP_slide_small.mov
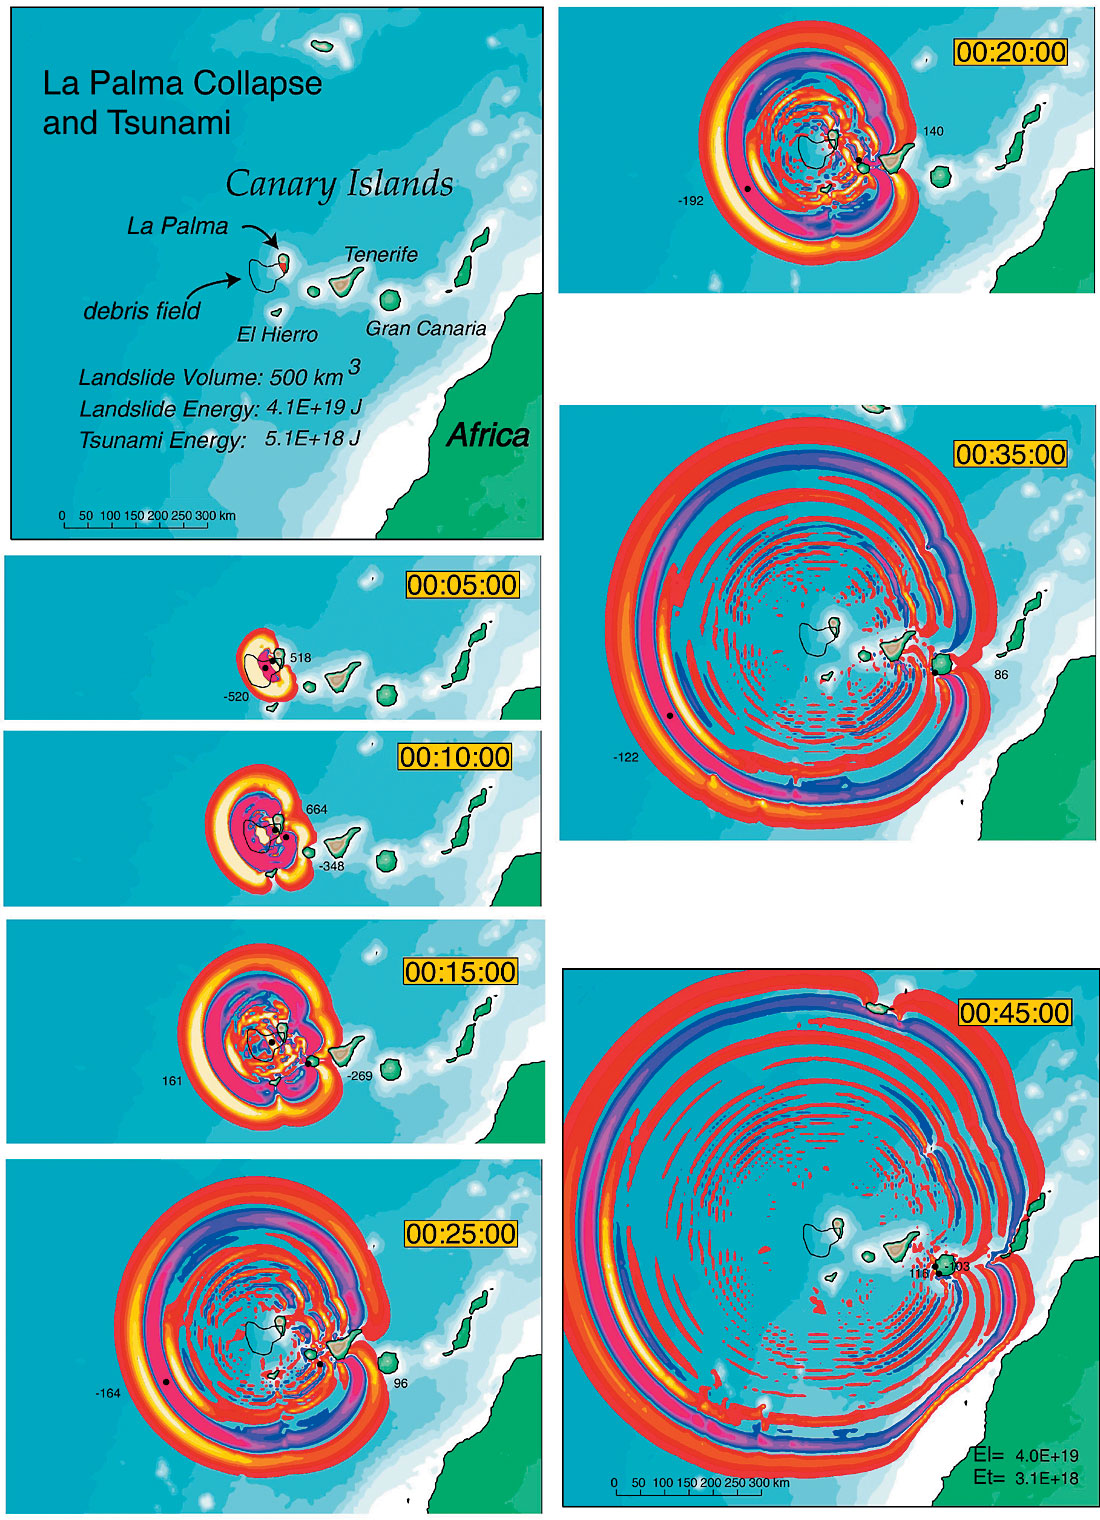
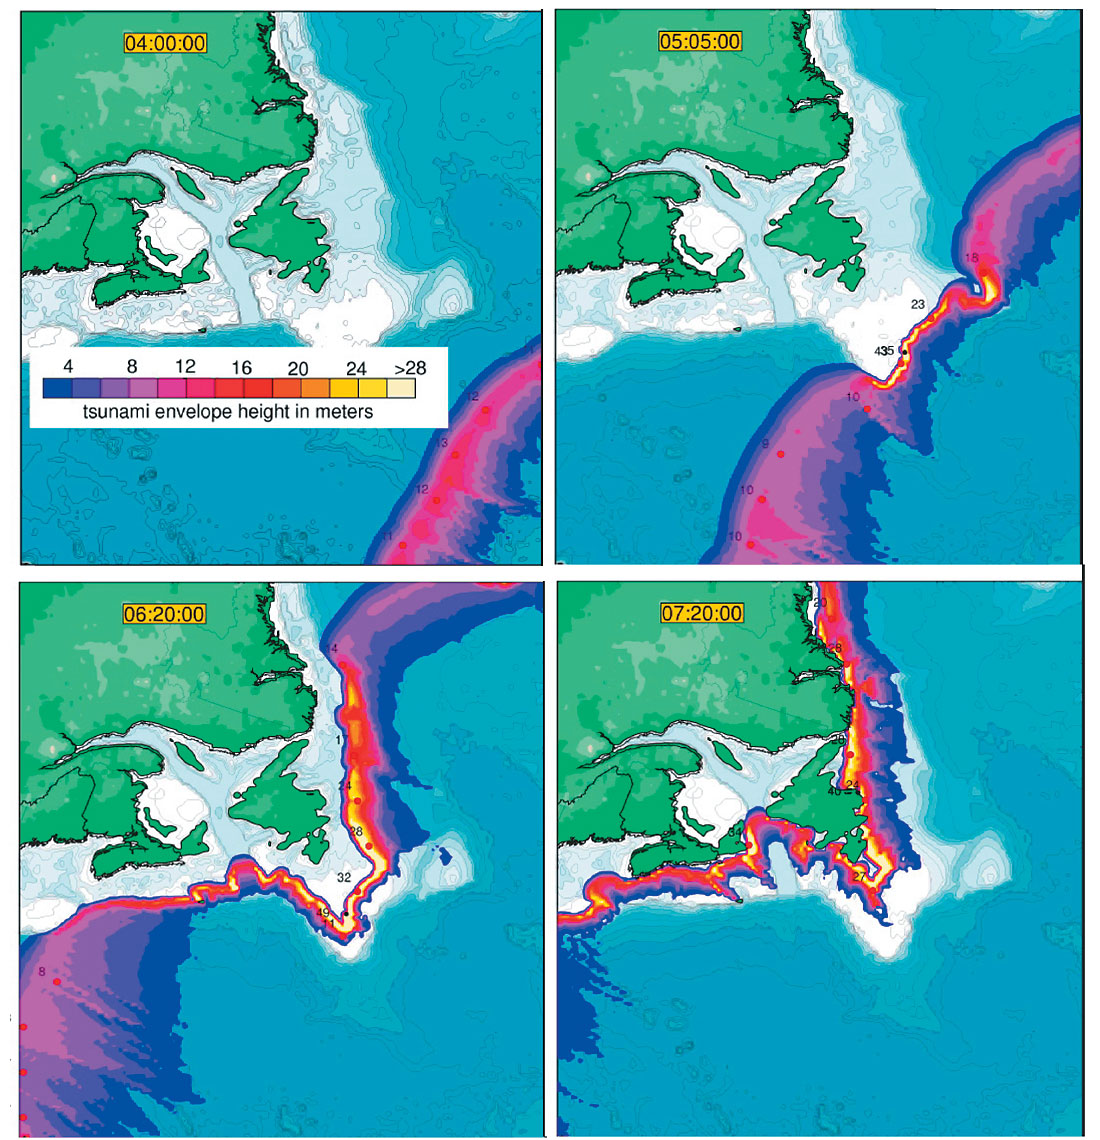
The mechanism of landslide tsunami generation is a no-brainer. Anyone who has swished a hand in a tub of water has got the concept. Water must move up, over, or around the moving mass. The process excites surface water waves of all frequencies that exit in all directions. Landslide tsunami efficiency is not strong. Depending on the thickness and speed of the slide, from <1% to about 15% of the gravitational energy released goes into water waves. Even so, volcanic collapses can involve huge landslide masses, move huge masses of water, and make waves worthy of Hollywood fiction. Figure 4 shows the initial 45 minutes of the La Palma tsunami powered by 12% of the slide’s energy. At the start, the water domes nearly as tall as the slide block is thick. Geometrical spreading and frequency dispersion however take a heavy toll on the amplitude of the tsunami as it runs across the Atlantic toward Canada. Waves towering 900 m at birth drop to ~10 m before they reach the North American continental slope. That is, about 99% of the initial tsunami amplitude vanishes in transit. Figure 5 shows the La Palma tsunami arriving at eastern Canada. This figure colors the size of the tsunami envelope. Under the envelope lie many wave cycles of roughly ten minute period. As tsunami slow upon reaching the shallow shelf, they grow by a factor of two or three relative to their deep water height. Runups of 25-35 meters at Newfoundland and Nova Scotia mimic those predicted for most of North America. ALa Palma tsunami would not be the end of the world but it would make for quite a day.
http://es.ucsc.edu/~ward/landslide(1_big).mov
http://es.ucsc.edu/~ward/LP_tsu_very_close_small.mov
http://es.ucsc.edu/~ward/LP_tsu_regional.mov
http://es.ucsc.edu/~ward/LP_tsu_Atlantic_small.mov
http://es.ucsc.edu/~ward/gbanks_tsu_env.mov
II. Alika II Slide, Hawaii: Year 120,000bp
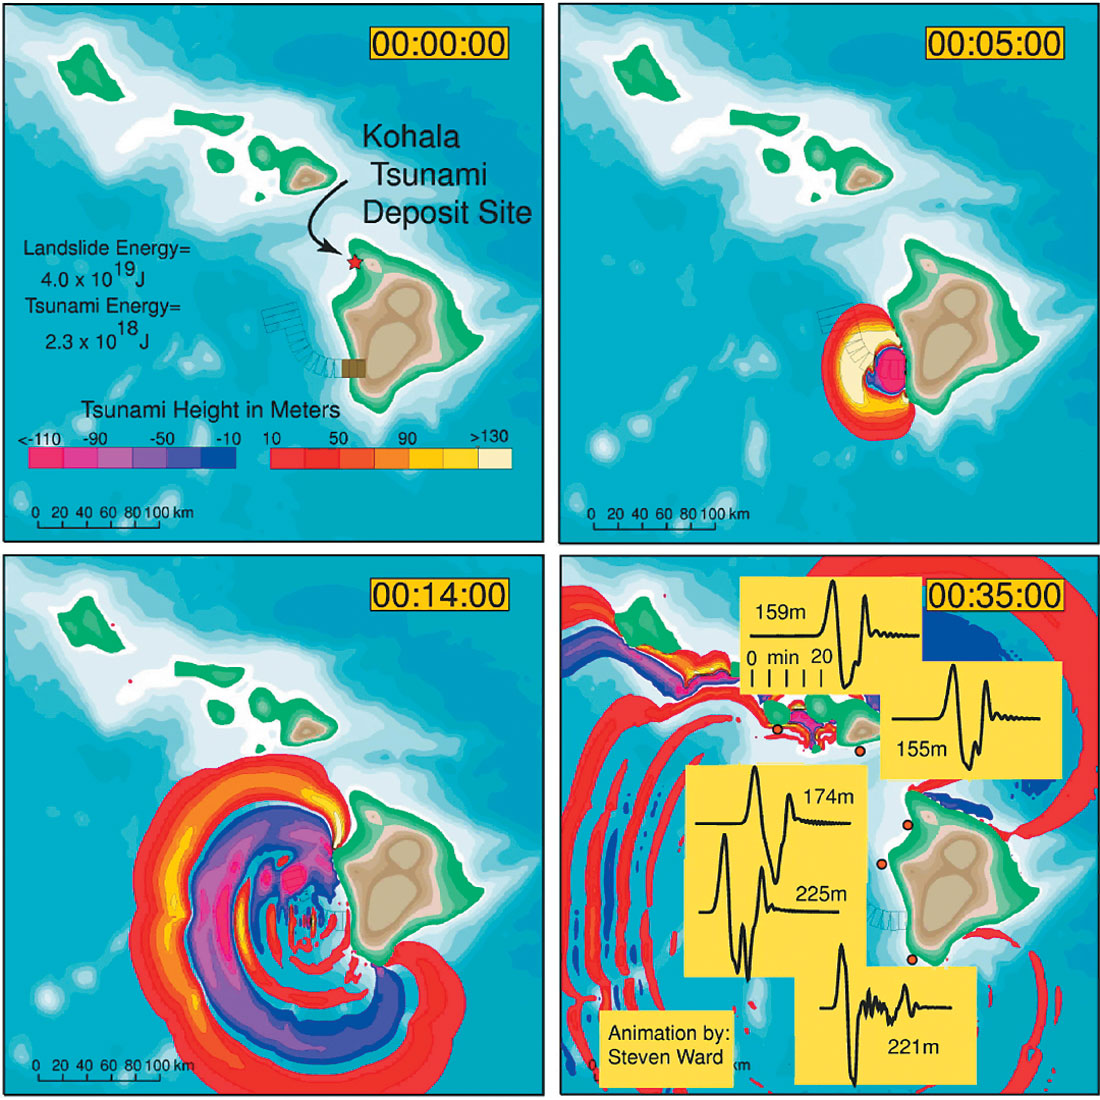
In 1964, geologist Jim Moore evidenced what, for-all-the-world, looked like giant landslide debris fields on the seafloor adjacent to several of the Hawaiian Islands (Moore, 1964). The landslides were so colossal however (up to 5000 km3) that it took years for his belief to root. Now geologists count 70 giant slides shed off the Island chain in the last 20 million years (Moore et al., 1994). One of these slides; Alika-II, at 120ka is “fresh off the press” geologically speaking. Alika-II is also notable because deposits scattered on several Hawaiian Islands have been linked to its tsunami (Moore & Moore, 1984). Recently, a team headed by Gary McMurtry (McMurtry et al., 2004) discovered corals of Alika-II age carried up and dumped 400 m above their beds of origin on the northwest side of the Big Island. Because the coral mash now sits just 20 m above today’s sea level (there has been lots of thermal subsidence of the upper mantle under Hawaii since 120ka), it took McMurtry some time to convince geologists that a paleo mega-wave was the culprit not a recent storm. For all but a few naysayers, these corals provide “smoking gun” evidence of mega-tsunami. Figure 6 shows our computer simulation of the Alika-II tsunami. This particular model is a bit anemic, running up waves to just (!) 200 m at the Kohala coral site 15 minutes after the start of the slide.
http://es.ucsc.edu/~ward/alika-2.4.mov
III. Ritter Island: Year 1888
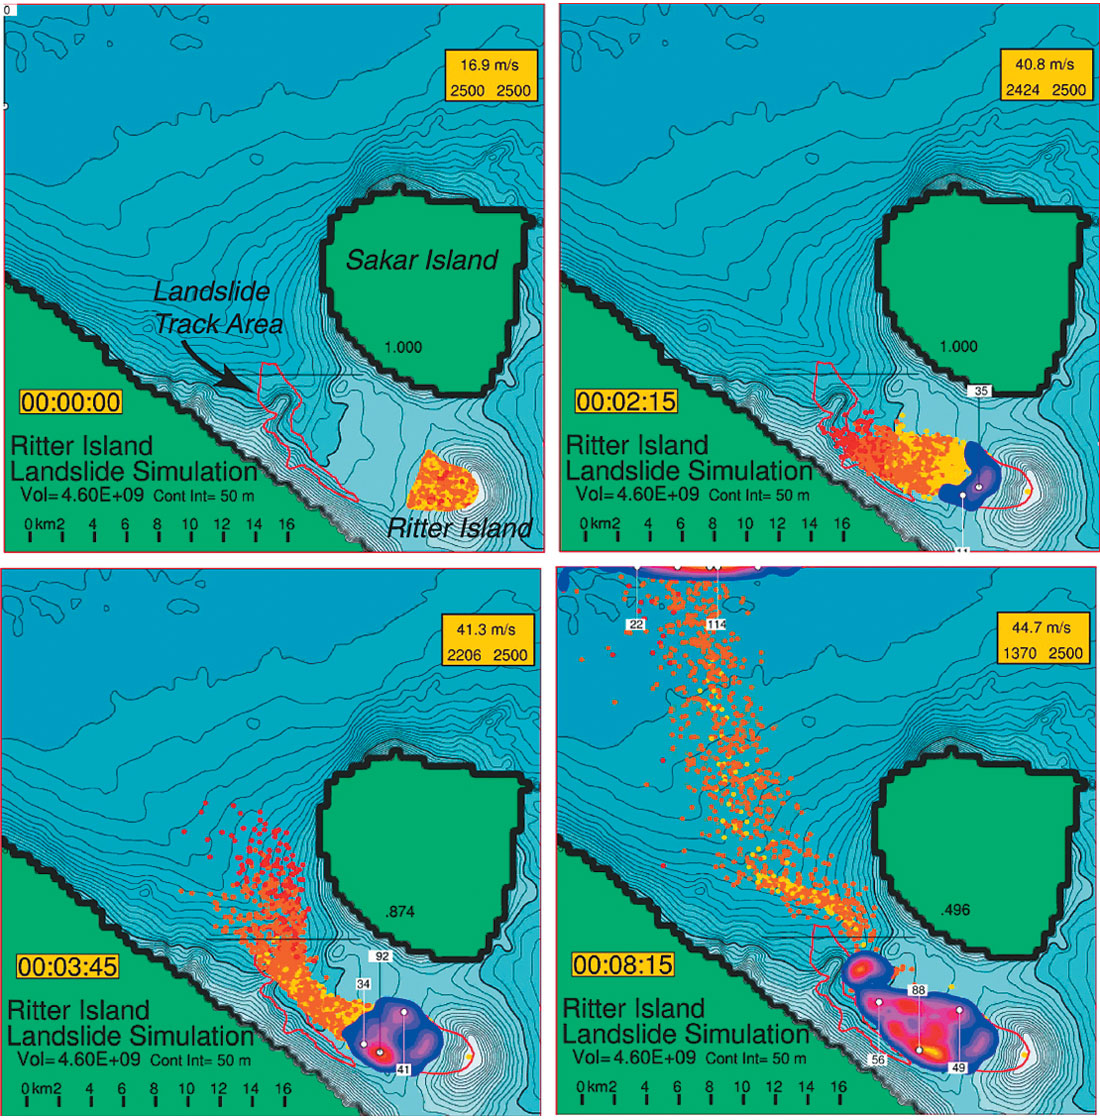
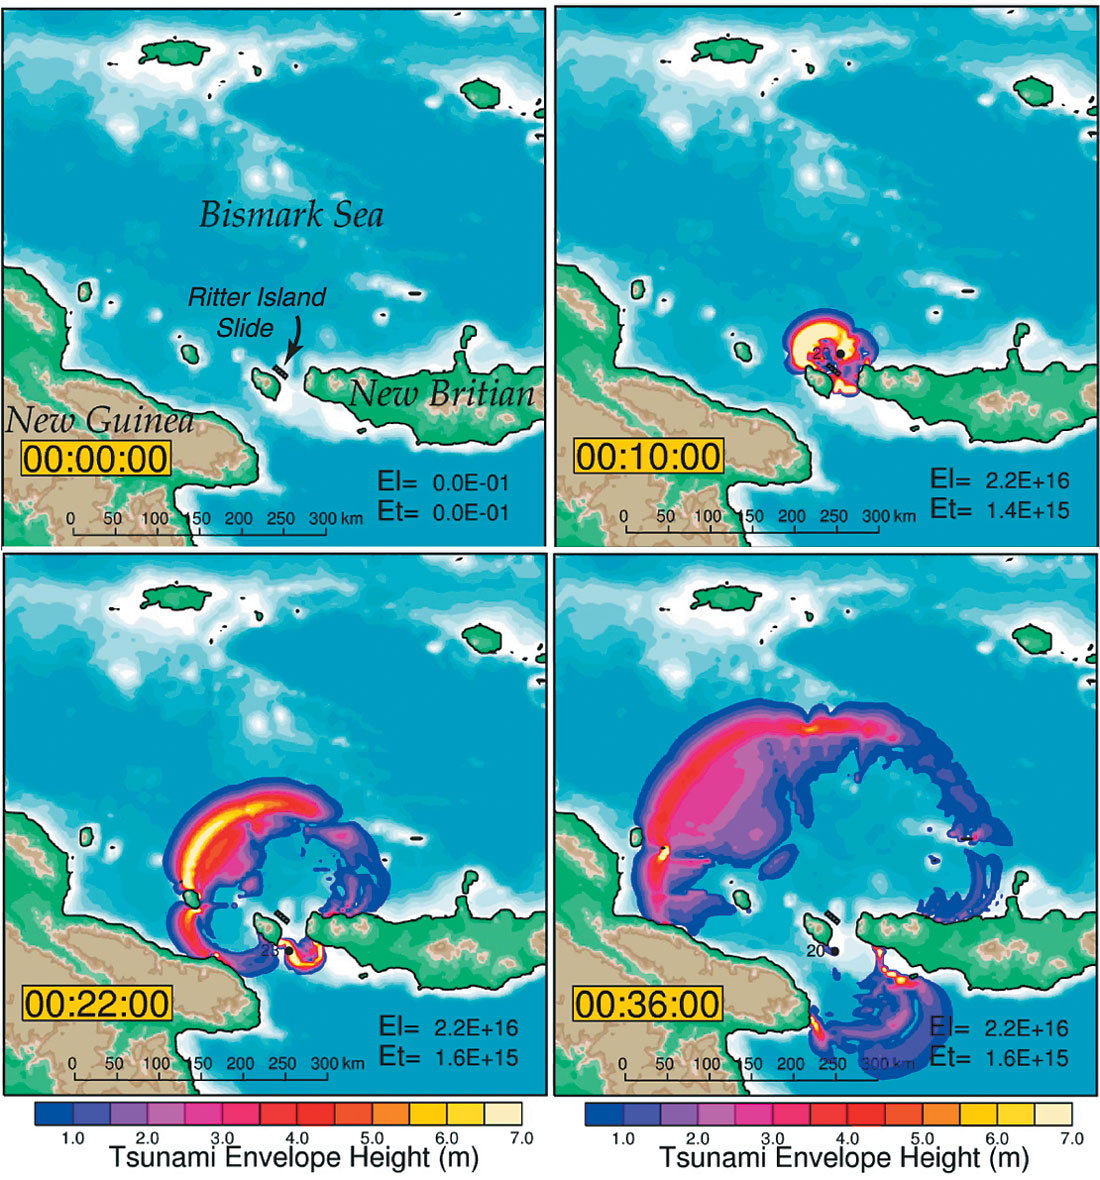
Talking about tsunami waves 100+ m high gives pause for thought. How sure are we that computer simulations work? Can we test them against real historical data? Well, mega-tsunami have been rather scarce in the past few hundred years, but tsunami have sourced from smaller island arc volcano collapses of a few km3 volume (comparable to the May 18th 1980 Mount St. Helens event). German colonists in Papua New Guinea provided perhaps the most detailed tsunami account after the March 13th, 1888 collapse of Ritter Island volcano. They tell of destructive tsunami waves 10 m or more in height up to 500 km away. The colonists used their watches to document the incoming waves like videocam–wielding tourists documented the December 26th Sumatra tsunami. The colonists’ efforts provided exceptional evidence for the unusually short period (~3 minutes) and extended duration (3+ hours) of the tsunami. A multibeam sonar survey around Ritter Island by our group in 2004 revealed a landslide deposit remarkably similar to that from Mount St. Helens. Ritter slide material followed a sinuous northwest path down a submarine valley for some 30 km. As it went around bends the landslide slopped, Banff bobsled–style, up the valley sides, leaving distinctive grooves in the wake (Figure 7). This observation proved a boon for modelers, because for the Ritter landslide to take this “Cresta run” it must have been travelling between 40 and 50 m/s.
http://es.ucsc.edu/~ward/ritter_slide4.mov
Turns out that the landslide velocity derived from deposit observation agreed well with our previous estimate based on tsunami observation (Ward and Day, 2003). We had found that waves produced by a 20 m/s model landslide were too small compared with the actual data. Waves produced by a 80 m/s landslide were too big; but waves from a 40 m/s landslide were just right (Figure 8). It looks as though our models simultaneously satisfy data from both the landslide deposit and the tsunami that the landslide created. This sort of agreement gives us confidence in using similar, but scaled-up models to understand past giant landslides and to predict what might happen the next time the flank of a La Palma – size volcano heads for the ocean floor.
http://es.ucsc.edu/~ward/Ritter_tsu_close_small.mov
http://es.ucsc.edu/~ward/Ritter_tsu_enve.mov
IV. Grand Banks: Year 1929
The 1929 Grand Banks landslide tsunami is the quintessential example of the phenomena. Not so much that it was unusual, but that it happened in recent historical time and that its causalities and effects remain fresh in mind. We know that a M7.2 quake epicentred near the intersection of the Laurentian Channel and the continental slope triggered the landslide (Piper et al., 1999). As conceptualized in Figure 9, the quake dislodged a sheet of material 20-25 m thick spanning a 250 km x 100 km region. Over the next 15 minutes the material accelerated to 50 m/s, but then the sheet quickly broke up into channelized flows. Debris flow in these channels slows to about 10 m/s and some turbidites run out for many hours and several 100 km. These slower flows sequentially broke the transatlantic telegraph cables that we have heard stories about, but they had little bearing on tsunami generation.
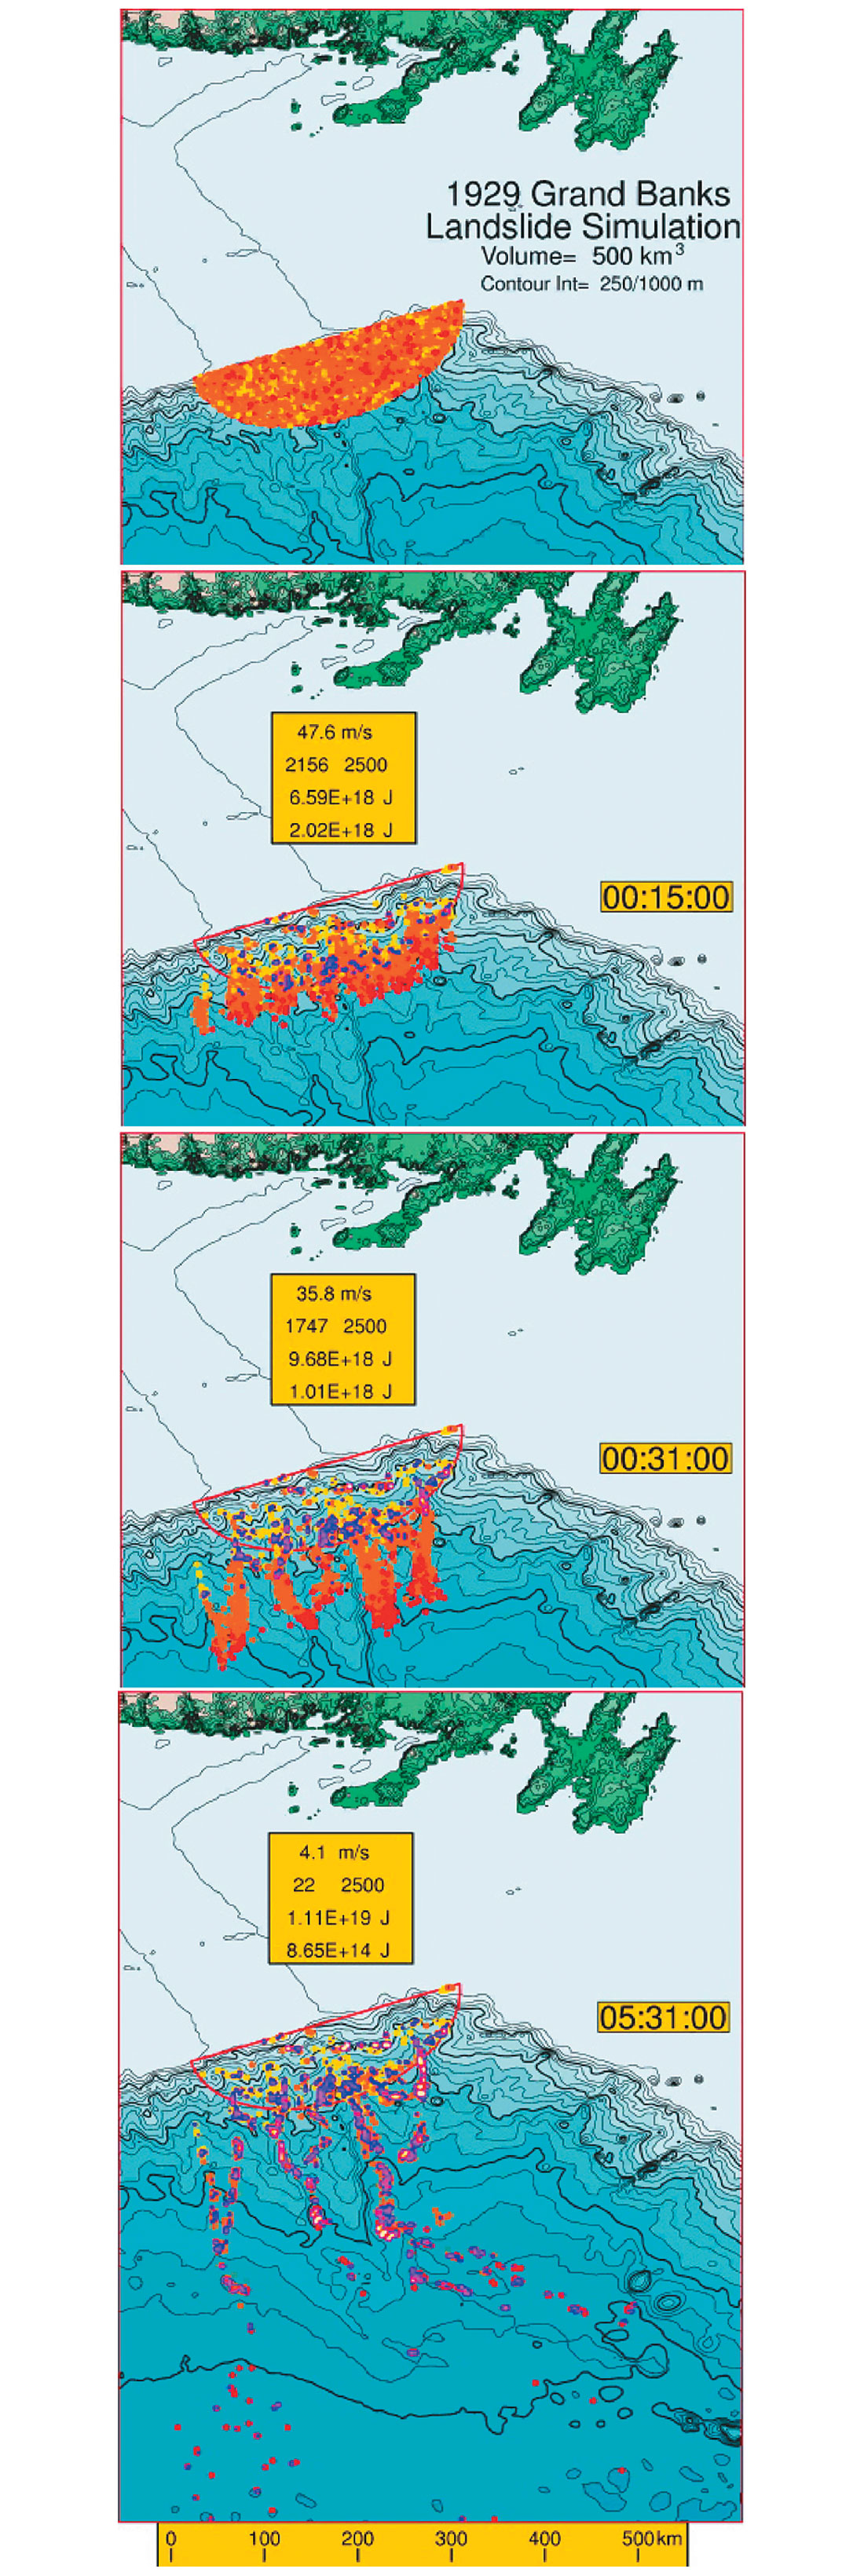
http://es.ucsc.edu/~ward/gbanks_small.mov
Figure 10 simulates the 1929 Grand Banks tsunami. Due to the strong directional variation in water depth, southbound waves quickly out distance northbound waves. The latter take 80 minutes to reach Newfoundland shores. By then, southeast bound waves have long since passed over the wreck of the Titanic 800 km out. The Grand Banks landslide released energy comparable to the La Palma collapse, however its tsunami generation efficiency was far lower (About 12% for La Palma and 0.2% for 1929). Still, runups of +6m (yellow circles) were more than sufficient to cause the observed damages and tsunami deposits on Newfoundland’s Burin Peninsula (Tuttle et al. 2004).
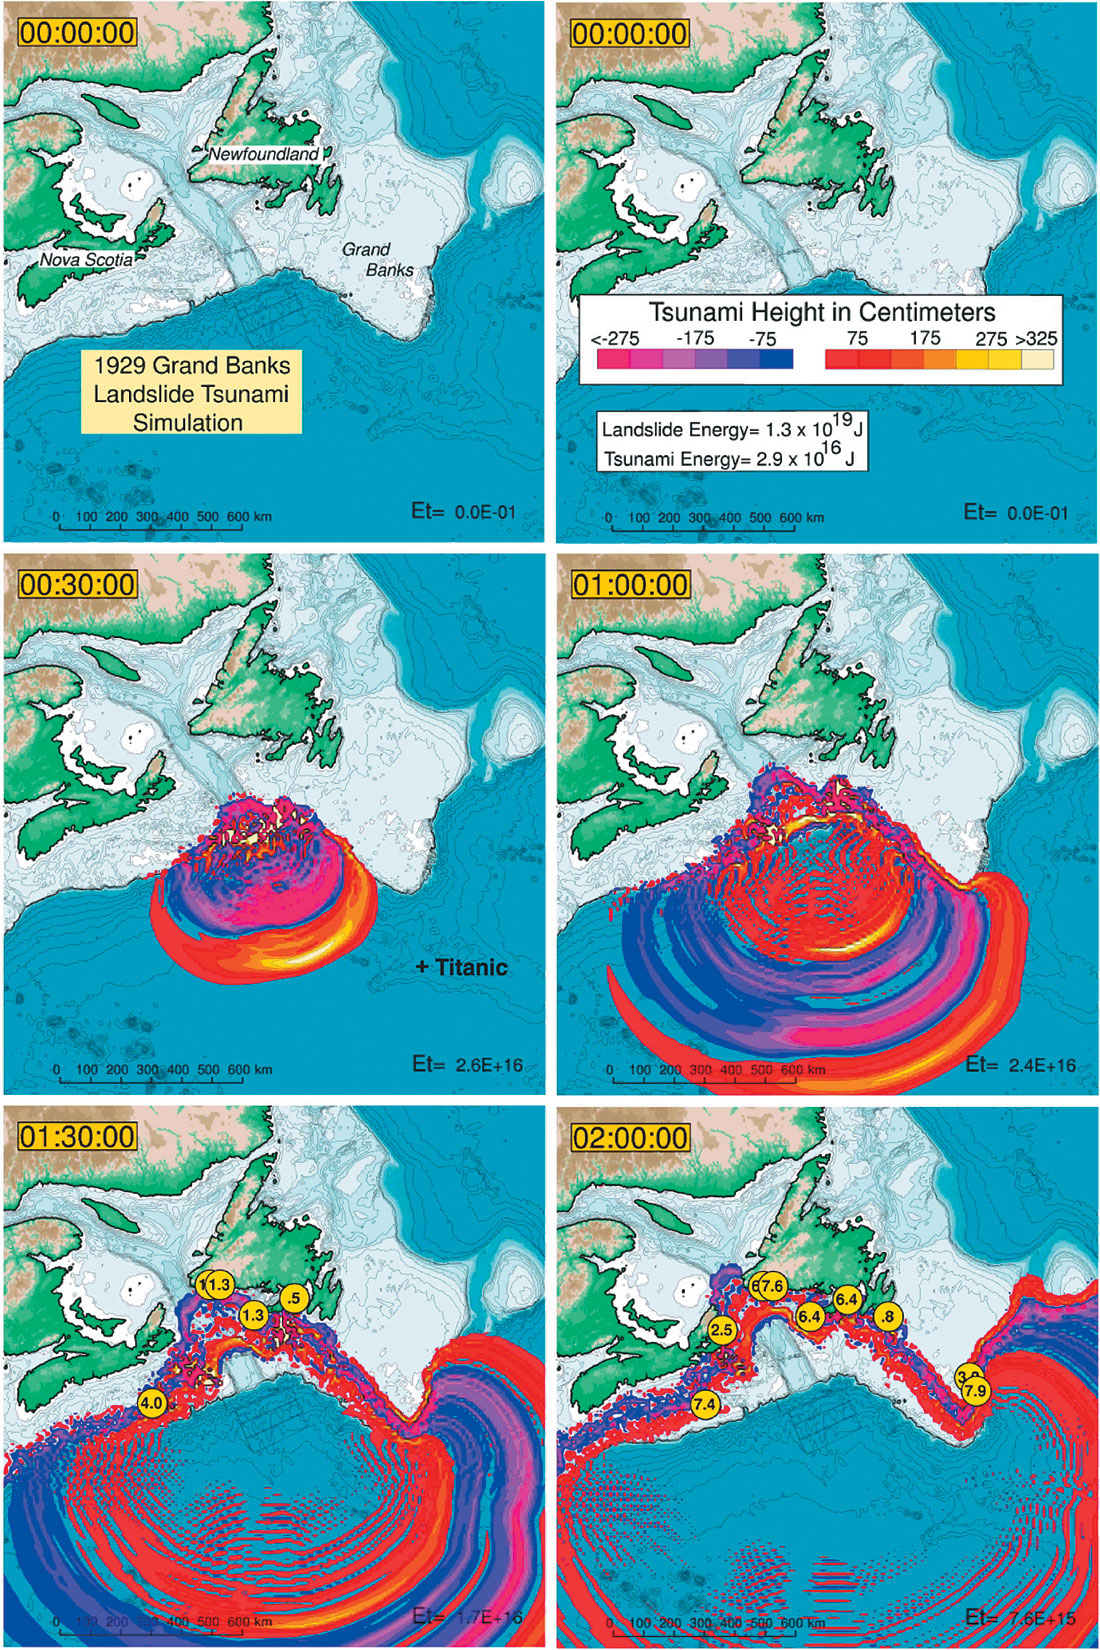
http://es.ucsc.edu/~ward/gbanks-new.mov
V. Monterey Canyon, California: Year 1000ybp
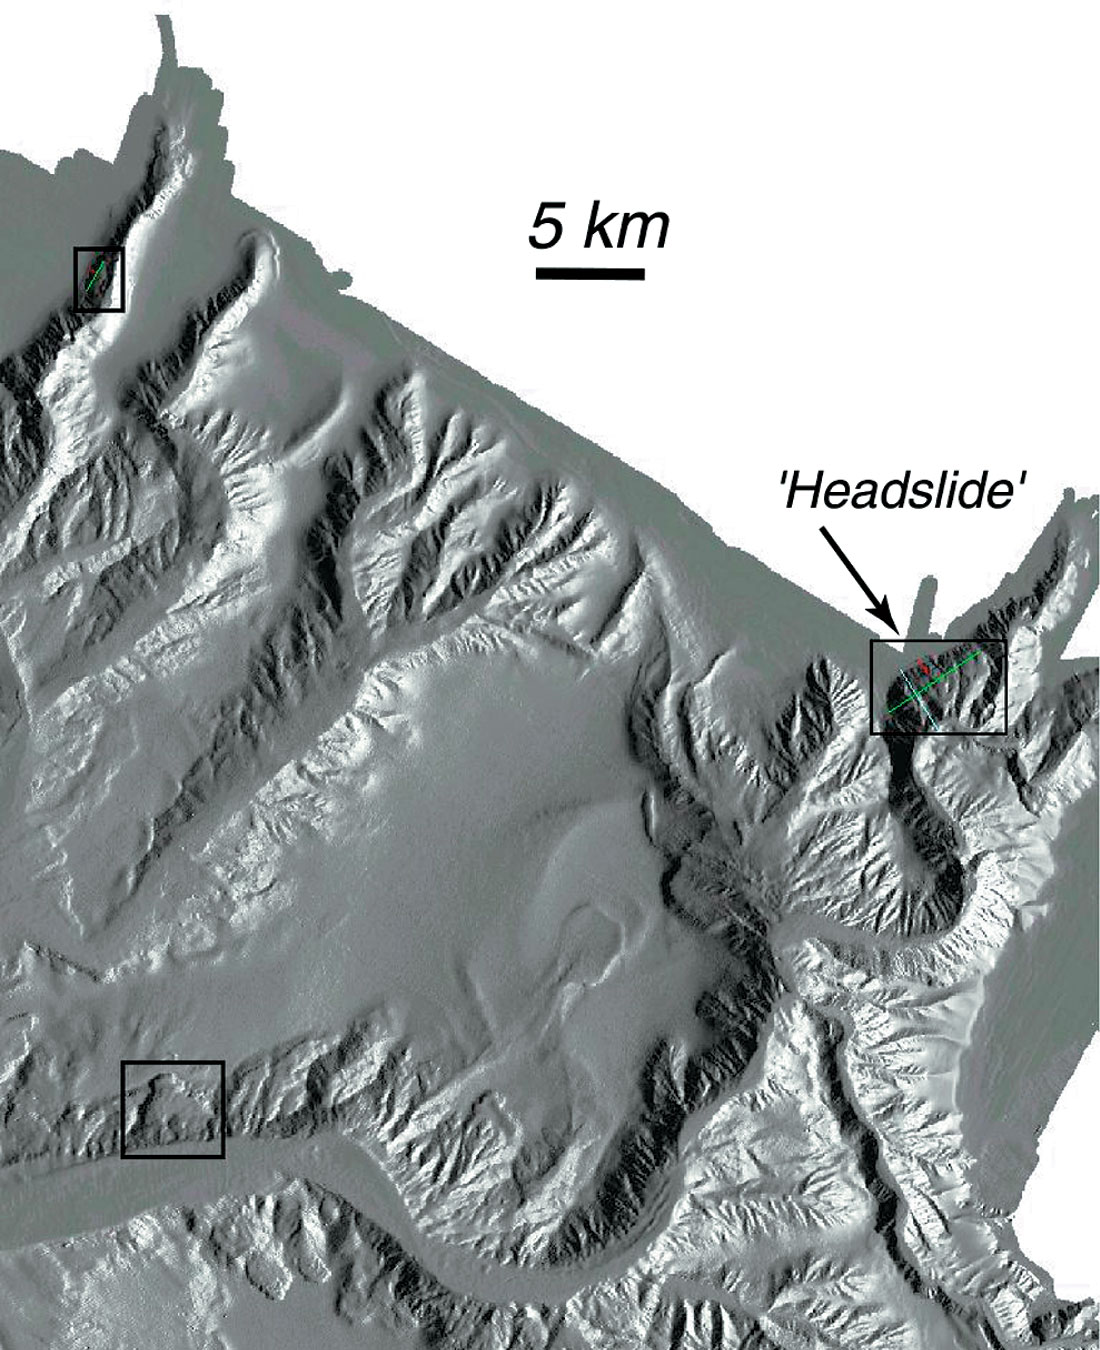
The Monterey Canyon System dominates the bathymetry of Monterey Bay California. Perched just offshore, the water covered Canyon, as wide, long and deep as the Grand Canyon, sits out-of-sight out-of-mind to most of us living nearby. Like the Grand Canyon, Monterey Canyon carries and stores massive volumes of sediment (Greene et al., 2002). One sediment source is canyon wall landslides, many wounds of which are visible in Figure 1. Figure 11 simulates a real canyon wall slide, named “Headslide” and boxed in the center right of Figure 1. Here, 0.1 km3 of material breaks off and falls 700 m. We predict that within a minute, most of the material comes to rest on the canyon floor where it is either buried or flushed out later. Like other slides modeled here, a few low friction bits of material run far away, reaching the Monterey submarine fan in 90 minutes or so.
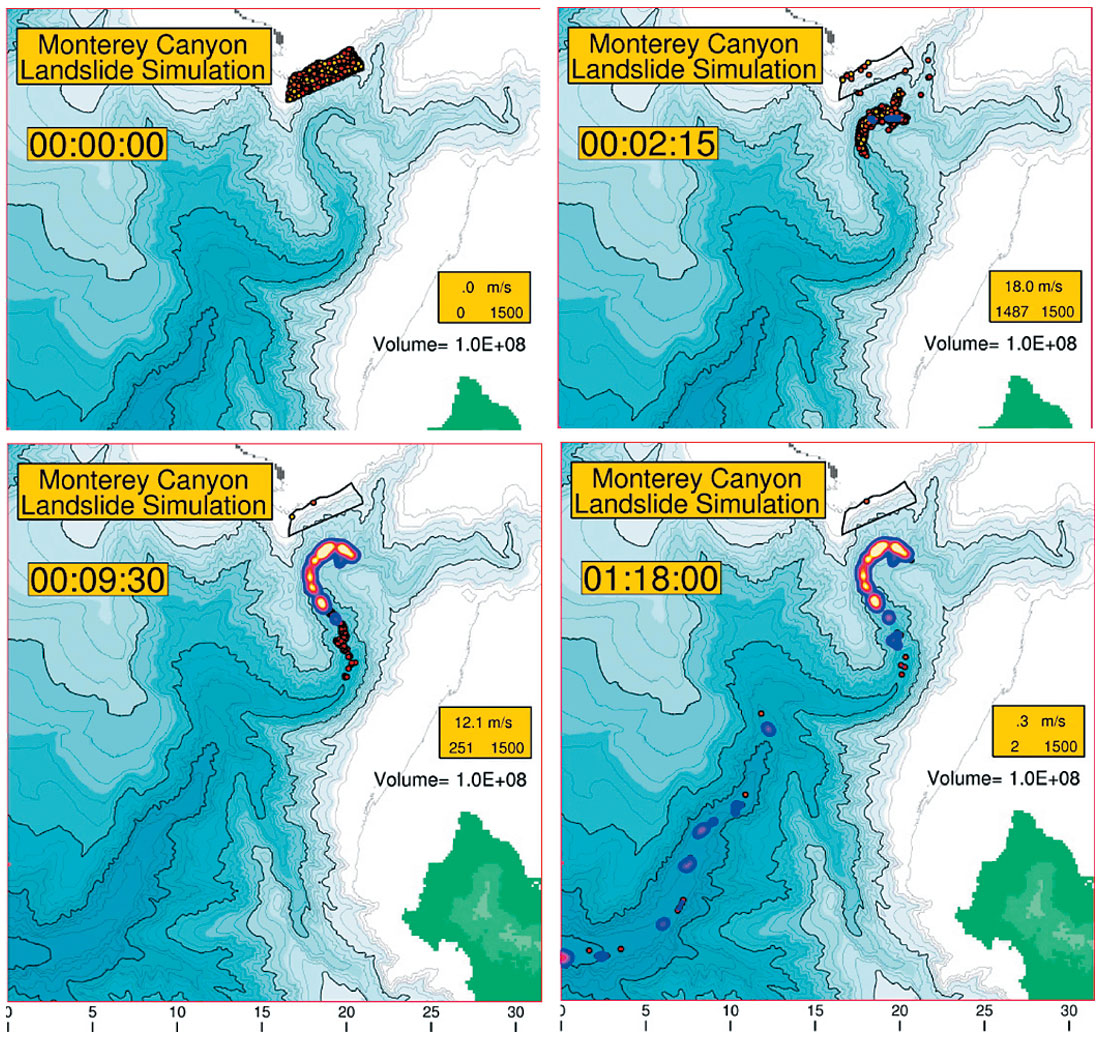
http://es.ucsc.edu/~ward/mb3.mov
Tsunami from slides like these generate in the first 30 seconds ( Figure 12). The worrisome things about failures on submarine canyon walls or on close-in continental slopes are that tsunami travel time to land can be as short as 10 minutes and runups can be unnervingly large locally. The Headslide model induced more than 7 meters of runup over 25 km of coast. If earthquakes provoke these slides, then felt shaking might alert coastal visitors to evacuate the beach prior to wave arrival. Even so, near source landslide tsunami make an exceptionally difficult hazard to mitigate.
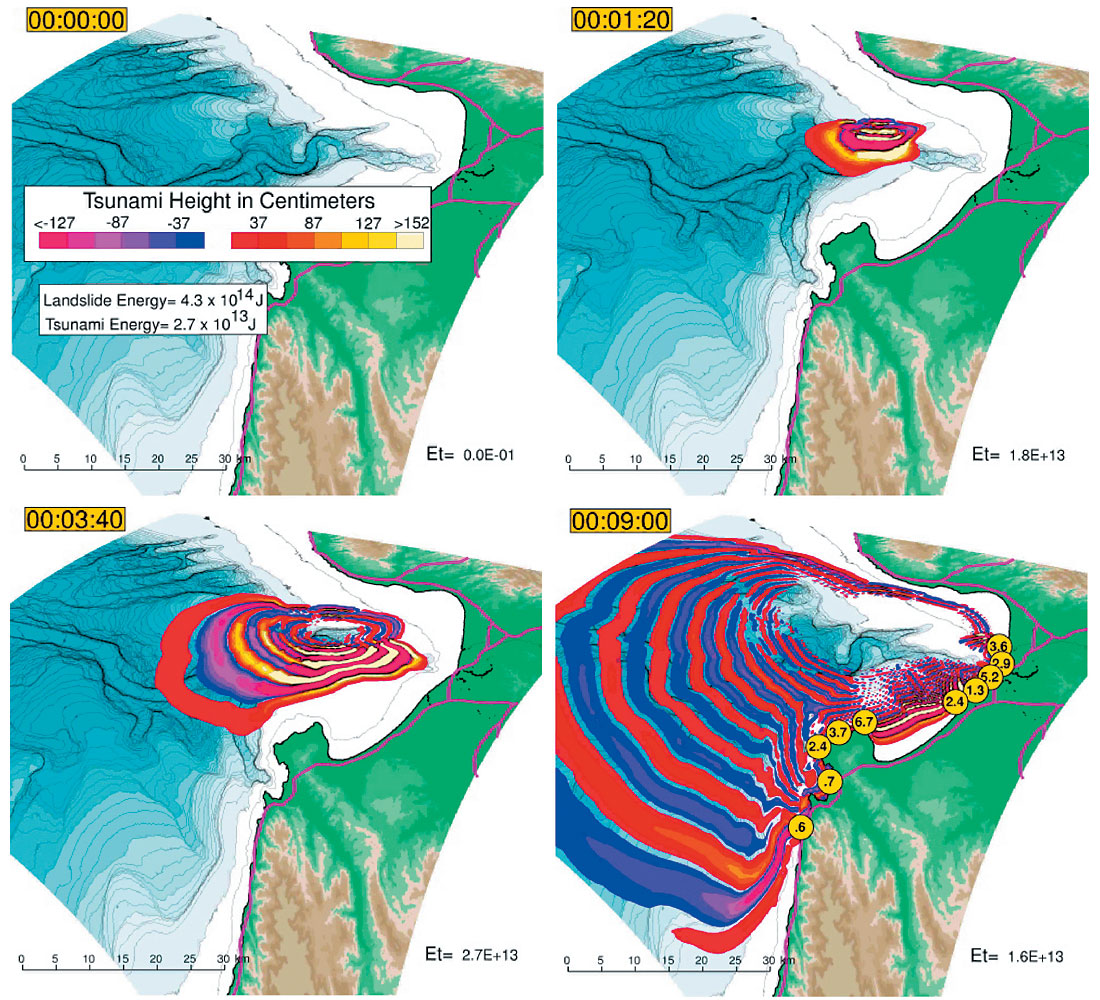
http://es.ucsc.edu/~ward/mb-slidetsu2.mov
http://es.ucsc.edu/~ward/mbay-runup-2.mov
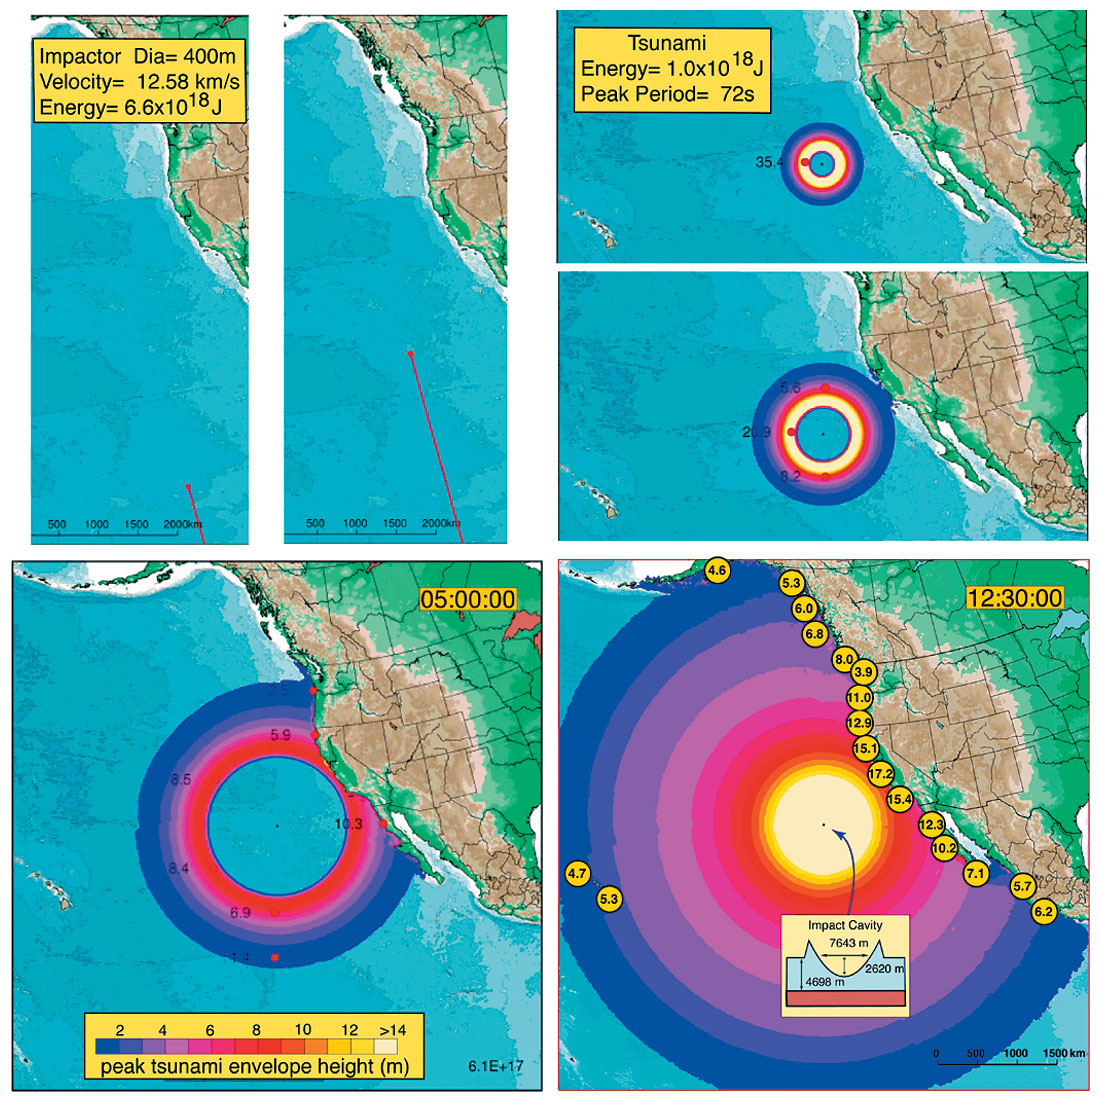
VI. Asteroid 2004MN4: Year 2036
On December 26, 2004 two events spotlighted tsunami hazard on the world stage. First was the Sumatra-Andaman earthquake whose spawned tsunami killed about 200,000 people (Lay et al. , 2005). Second was the discovery of asteroid 2004MN4 (Schweickart, 2005) which, on that day, was calculated to have a 1-in-37 chance of striking the Earth in the year 2029. Subsequent observations of the trajectory of the 350 m diameter rock have ruled out an impact in 2029; however the asteroid still gives Earth a very close shave then, passing just 30,000 km overhead. If it slips through a gravitational keyhole 600 m in diameter on that pass, the rock will be steered with palpable potential for an Earth collision on its way around in 2036. Astronomers project a narrow impact error ellipse stretching across the north Pacific to the Gulf of Mexico. Figure 13 forecasts the tsunami if 2004MN4 impacts off the California Coast. Striking at 12.5 km/s the rock blows a hole 2600 m deep and some 8 km wide. The collapse of the transient water cavity makes big waves. Fortunately impact tsunami tend to decay rapidly because of their short period (about 75s in this case). Still, waves should run up 15-20m on the California coast. Western Canada gets away lightly with just 5-10 m ones. If this happened today, we estimate damages at $400 billion USD (Chesley and Ward, 2005). A census of Near Earth Objects indicates that an asteroid 200m diameter or larger strikes the Earth every 10,000 years; a recurrence interval not too much different than the time span between collapses of oceanic island volcanoes somewhere on the planet.
http://es.ucsc.edu/~ward/2004MN4(a).mov
VII. Cascadia: Year 1700 and Soon Again
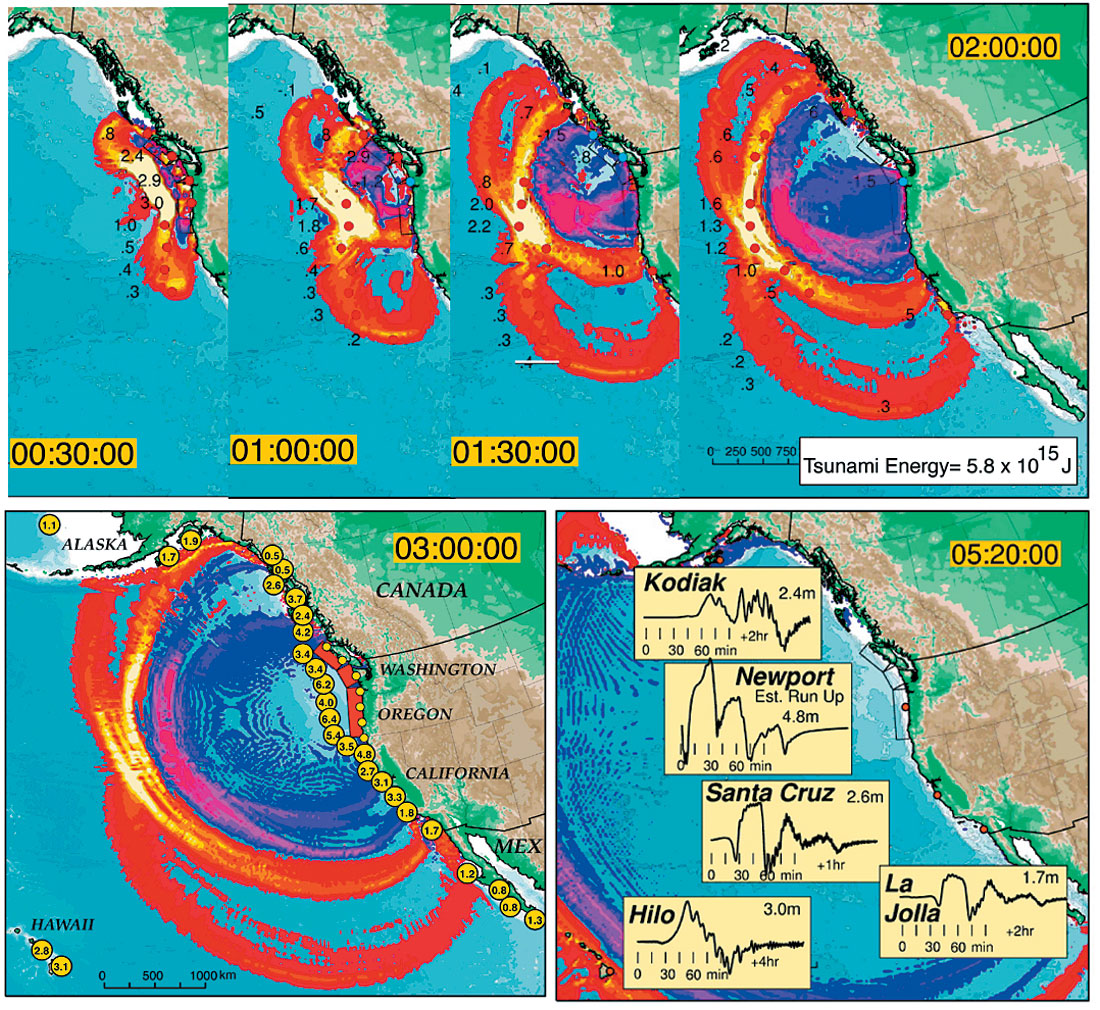
Everyone on the western shores of Canada and the United States has visions of the next Cascadia earthquake. In fact, over sensitivity to this vision may have contributed to the scare that residents received last June 14th, when the Alaska tsunami centre issued a warning for nearly the whole west coast in response to a smallish M7 quake located offshore northern California. Not the big one that time, but thanks to the wonderful efforts of paleo-seismologists (Atwater and Hemphill–Haley, 1997) we do know that seven big subduction quakes have struck the Pacific Northwest in the past 2000 years. Although not betting types, we’d wager a beer that in 2005 the next event is closer in time than the previous event (January 26, 1700) is distant. If the next quake compares to the last, 1000 km of fault might rupture with 15 m of slip. Tsunamiwise, Oregon, Washington and Vancouver Island residents stand to take the brunt with 6+ m waves (Figure 14) arriving within 30 minutes. To make things worse, those coasts should be co-seismically down dropped from slip on the fault below, so inundation zones expand. Because of the property of earthquake tsunami to radiate most strongly perpendicular to the strike of faults, coasts of California, northern British Columbia and eastern Alaska may dodge a wet bullet. The simulation gives about two meter runups down southern California Coast. Managers of the nuclear plant at San Onofre probably can rest easy.
http://es.ucsc.edu/~ward/cascadia.mov
http://es.ucsc.edu/~ward/cascadia-sum2.jpg
VIII. Indonesia: Year 2004
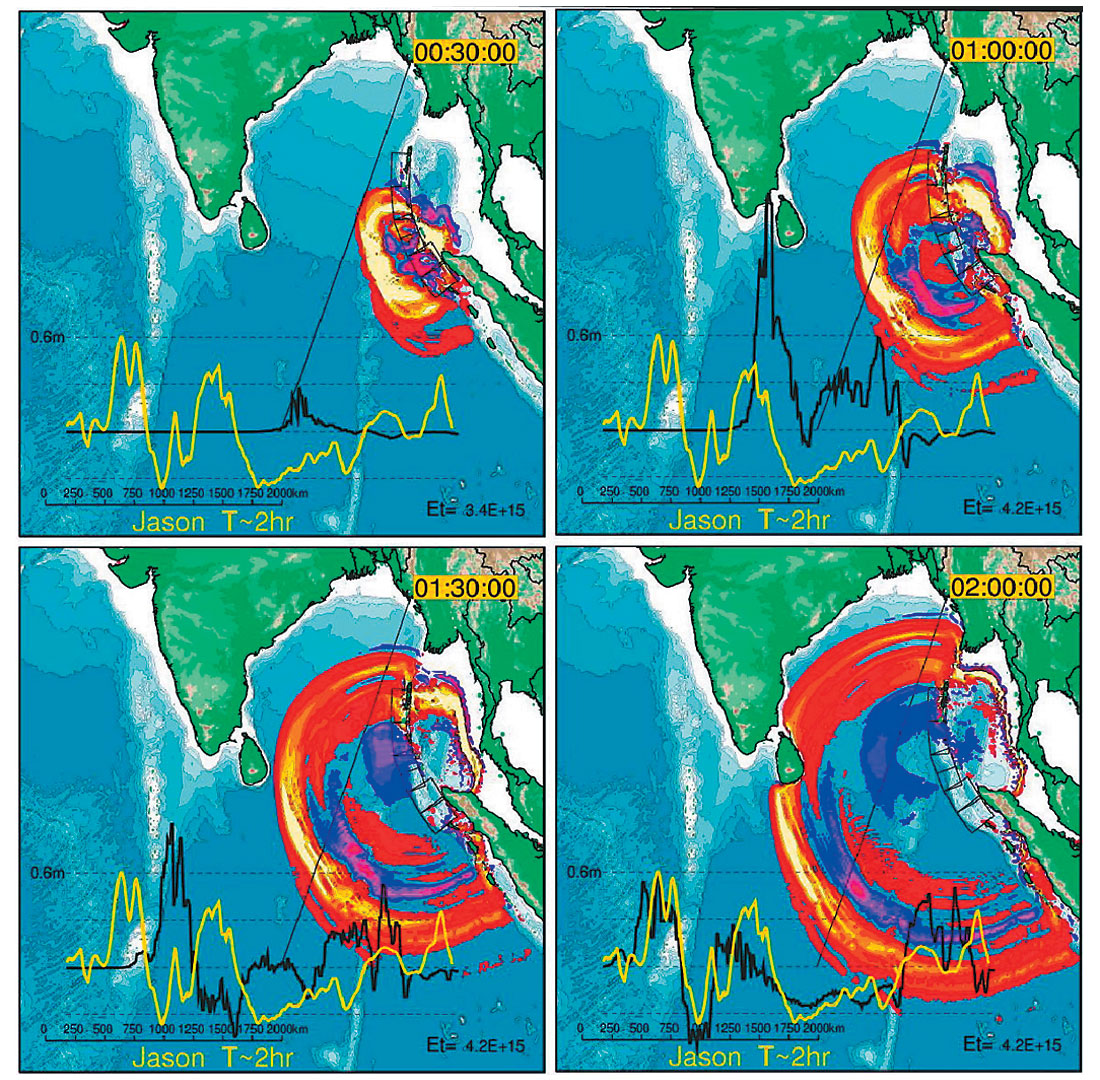
Much has been said about the December 26, 2004 earthquake and waves so just a few tsunami thoughts will suffice. At the time of the event, maybe a dozen instruments dedicated to recording tsunami existed. In contrast, seismologists had access to hundreds of first class instruments dedicated to recording earthquakes. Hardly a surprise really, that less is known about tsunami than quakes. Legislation passed by United States Congress to expand the DART ocean bottom tsunami sensor network to 30 might jump-start the field. Several other countries Figure 10. 1929 Grand Banks landslide tsunami simulation. too have promised to set up independent buoy networks. Still, unlike seismic instrumentation, costs of tsunami instrumentation seem to be valued strictly against benefits of improved hazard warning, discounting any dividends in tsunami science. Think of it, much of what seismologists have learned about the earth and earthquakes didn’t come from mitigating the greatest destructive quakes, but by studying the myriad of harmless ones. Hundreds of ‘baby tsunami’ go undetected every year and the information they contain goes with them. Future breakthroughs in tsunami data collection will likely come not in buoys but from space-based instruments. The 2004 earthquake demonstrated that radar altimetry has the potential to spot tsunami in mid ocean (Figure 15). Although this was a stunning example, radar altimetry, being nadir looking with a few km aperture, is not well suited for the task of stalking tsunami. More feasible are wide field scanning techniques like Doppler radars that detect the much larger horizontal motions associated with tsunami, or radars that image waves by their surface roughness or shadows. We’ve read that even gravity measuring satellites might someday detect tsunami (Bao, et al. 2005). By buoys or boosters, maybe by the time of the next tsunami (knock on wood that it’s just 3 inches high), we will be able to catch it in flight. However you slice it, tsunami research doesn’t seem so sleepy anymore.
http://es.ucsc.edu/~ward/indo-jason.mov


Join the Conversation
Interested in starting, or contributing to a conversation about an article or issue of the RECORDER? Join our CSEG LinkedIn Group.
Share This Article