Summary
Toe-to-Heel-Air-Injection (THAI™) is an in-situ combustion process that is used for the recovery of bitumen and heavy oil. It combines a horizontal production well with a vertical air injection well placed at the toe. Compressional and shear velocities for heavy oil are extremely sensitive to temperature. As the oil is heated by the combustion process the velocity decreases causing distinct time-delay anomalies on timelapse (4D) seismic. These time-delay anomalies indicate that the combustion front is moving from the toes of the wells, where the air injectors are located, towards the heels. Downhole thermocouples are used to measure the temperature and hence provide control/calibration points.
Introduction
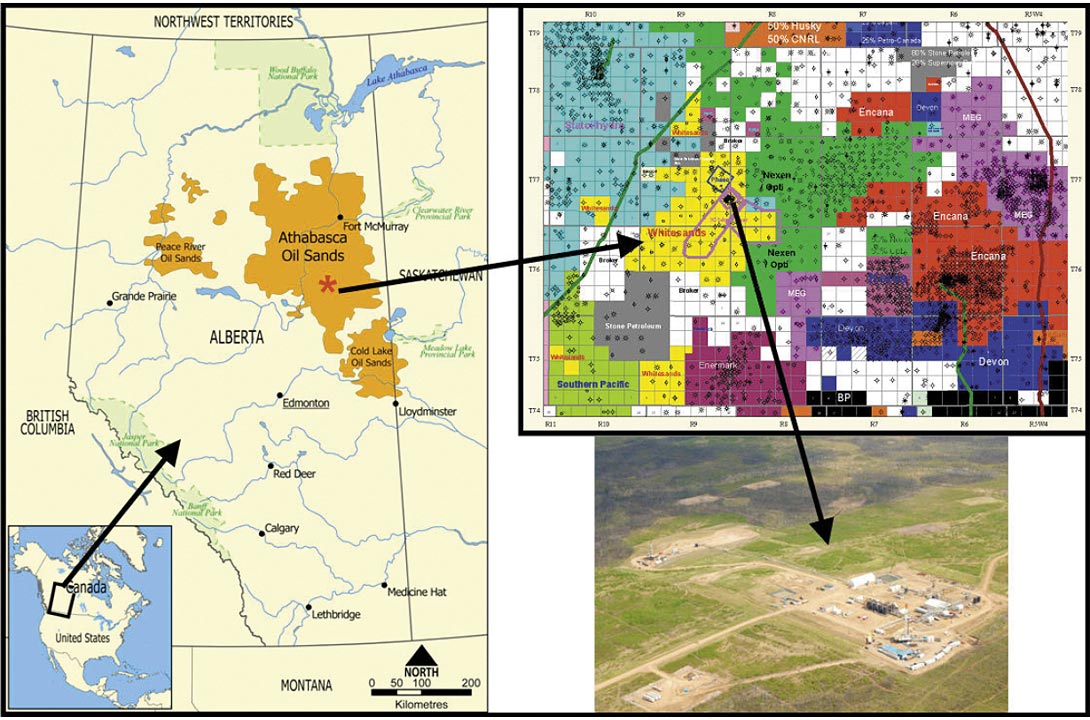
The Whitesands project is located in the Athabasca oil sands near Conklin, Alberta (Figure 1). The Whitesands pilot project is designed around three well pairs producing from a central facility. Air injection commenced on the first well pair in July 2006. Air injection on the second well pair was initiated in January 2007 and on the third pair in June 2007. The projects first THAI™ and CAPRI™ well was drilled in the second quarter of 2008 which also incorporated a revised completion design to improve down hole sand control.
The position and progress of the combustion front is being monitored using tilt meters, passive seismic and active 4D seismic. Each of the three methods identifies the combustion zone but the 4D method provides the most reliable and detailed information.
In 2003, Petrobank acquired a coarsely sampled (15 X 20m bins) 3D seismic survey for general imaging purposes. Since that time, the reservoir underwent a SAGD style pre-heating process, the initiation of the THAI™ process as well as gas production from the overlying Clearwater formation. In 2008 Petrobank recorded a high resolution (5 X 5m bins) multicomponent survey that would serve as a baseline for the 4D. We were not convinced that we would be able to see a valid timelapse signal, given the differences between the 2003 and 2008 recording parameters. The 2003 data were interpolated and regularized from the 15 X 20m bins down to 5 X 5m bins. The data were then used for 4D analysis with surprisingly good results. The 2009 survey had an identical geometry to the 2008 survey.
THAI™ and CAPRI™
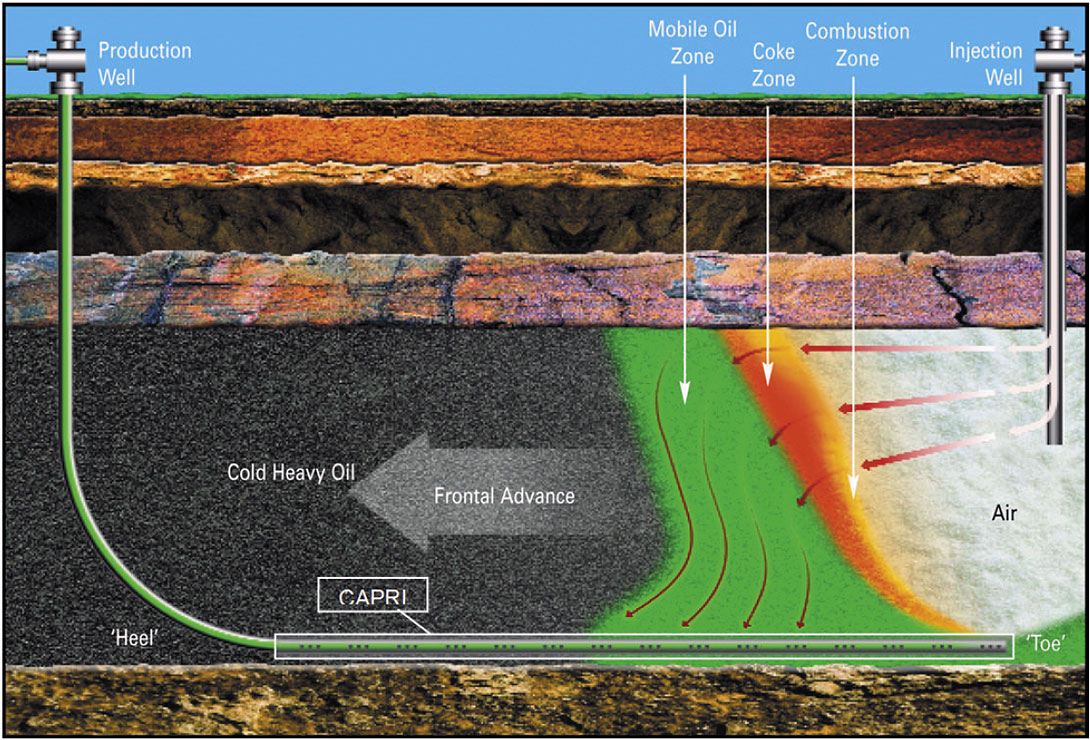
Toe-to-Heel-Air-Injection (THAI™) is an in-situ controlledcombustion process that cracks, upgrades and mobilizes heavy oil (Figure 2). Compressed air is injected in to the reservoir after a pre-injection-heating-cycle brings the reservoir up to an appropriate temperature for combustion to occur. The bitumen is then cracked leaving a coke zone that becomes the fuel for the process. In front of the coke zone is a mobilized, upgraded oil that is then produced by a horizontal well through gravity drainage. The THAI™ process does not require gas or water (as in SAGD) and in fact the produced water is appropriate for sale to SAGD producers. CAPRI™ is a catalytic process that takes advantage of the in-situ conditions created by THAI™ (namely temperature and pressure) to further upgrade the oil as it passes through a catalyst filled annulus in the production liner (Figure 2). Lab results indicate that THAI™ will provide an upgrade of about 10° API and CAPRI™ a further upgrade of about 7° API.
Conditioning of Seismic Data for Timelapse Analysis
Four seismic volumes (Figure 3) will be used in the following discussion:
- the 2003 coarsely sampled (15X20m bins) p-wave data shown on the western portion of Figure 3;
- the 2005 coarsely sampled (15X20m bins) p-wave data shown on the eastern portion of Figure 3;
- the 2008 true baseline high resolution (5X5m bins) multicomponent data in the northern portion of Figure 3; and,
- the 2009 monitor survey that has identical acquisition parameters to the 2008 data.
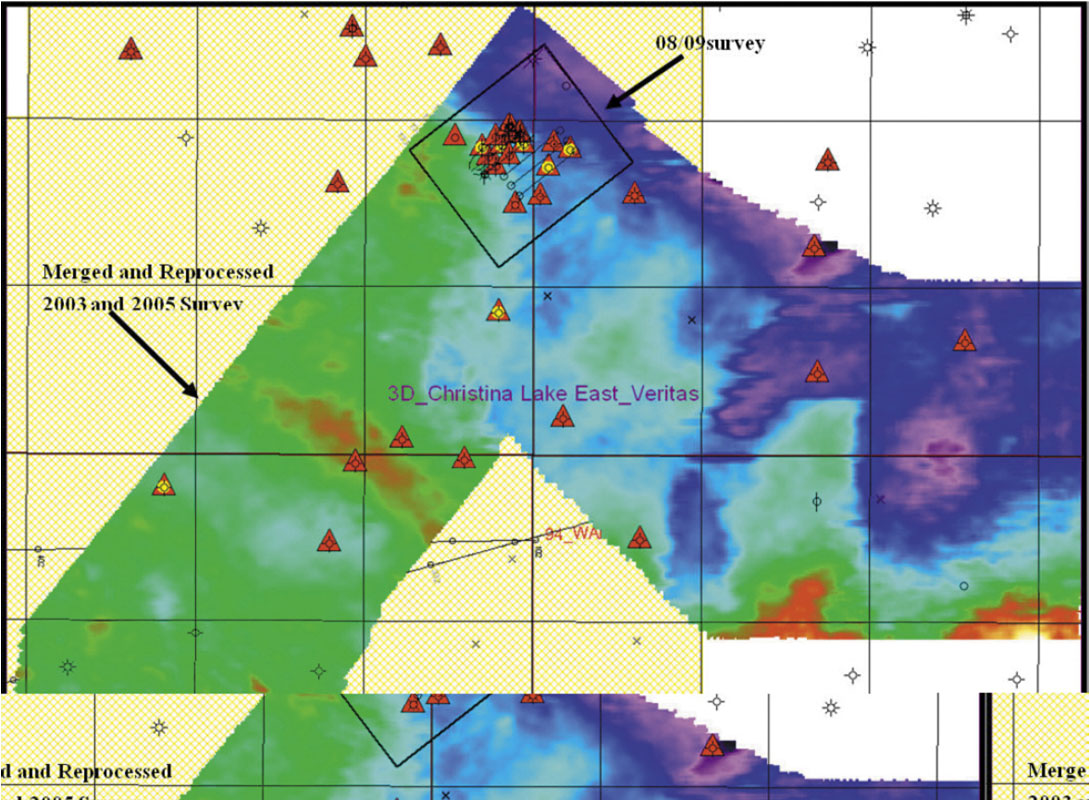
The 2003 and 2005 data were merged, processed and interpreted for regional mapping purposes. The merged volume was then interpolated and regularized in the area that overlaps with the 2008 data. Following a scheme similar to Trad et al., 2008, new shots and receivers were built using a five-dimensional (offset, azimuth, inline, crossline and frequency) interpolator based on Fourier reconstruction. By taking advantage of the multidimensional aspect of the process, information from different dimensions can be used simultaneously to infill missing data. Interpolating simultaneously in the four spatial dimensions of offset, azimuth, inline and crossline instead of just the latter two fully exploits the redundancy of the 3D data, significantly improving the spatial sampling. These interpolated data, while obviously not ideal, were used as a quasi-baseline survey for timelapse. The 2008 baseline multicomponent survey was used as a monitor survey in conjunction with the interpolated data. The first multicomponent monitor survey was acquired in Jan 2009 and the three P-wave snapshots in addition to the two PS snapshots were used for timelapse analysis.
P-wave Velocity Anomalies and Timelapse Results
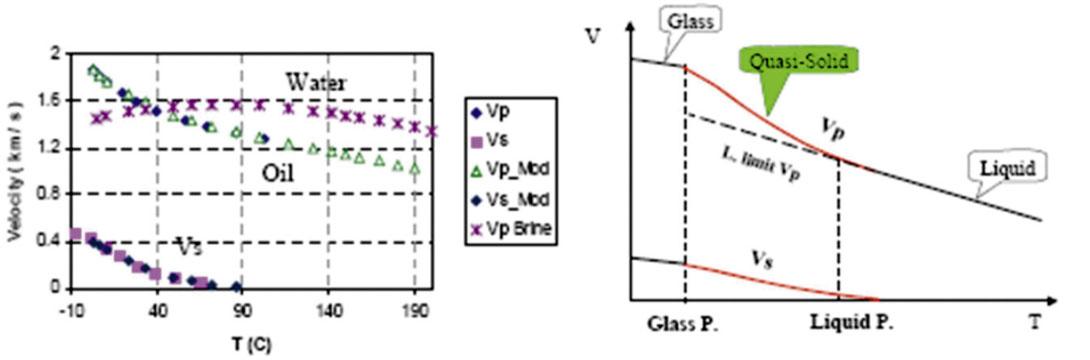
The P- and S-wave velocities of heavy oil are very dependent on temperature (Han et al., 2006). Figure 4a shows the decrease in P- and S-wave velocities from 0 to 200°C. While the P-wave velocities drop dramatically, the S-wave velocities are even more dramatic and in fact go to zero. Figure 4b shows the phase change of heavy oil with temperature. Since the heavy oil in bitumen sand acts as the matrix, the properties of the heavy oil will dominate the rock properties of the bitumen sand. As such, bitumen-sand behaves as a non- Newtonian fluid such that its shear stress and viscosity are not constant at all shear rates. Furthermore, Gassman-style fluid substitution is not valid below approximately 60°C (Han et al., 2007 and Schmitt, 1999).
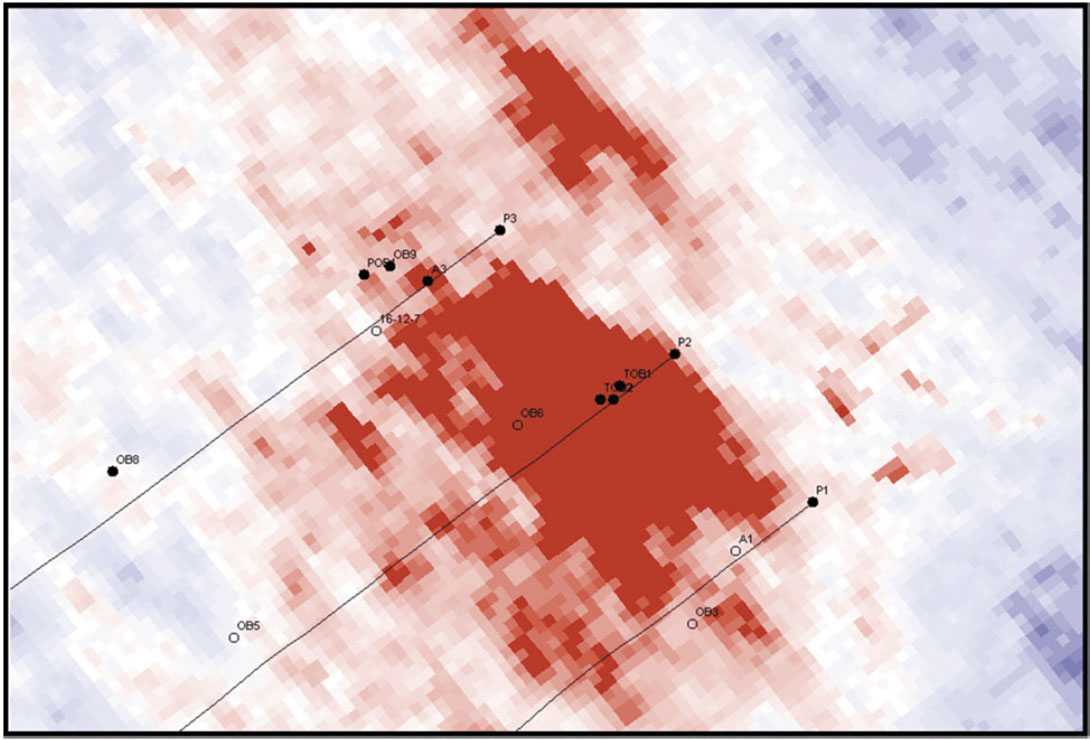
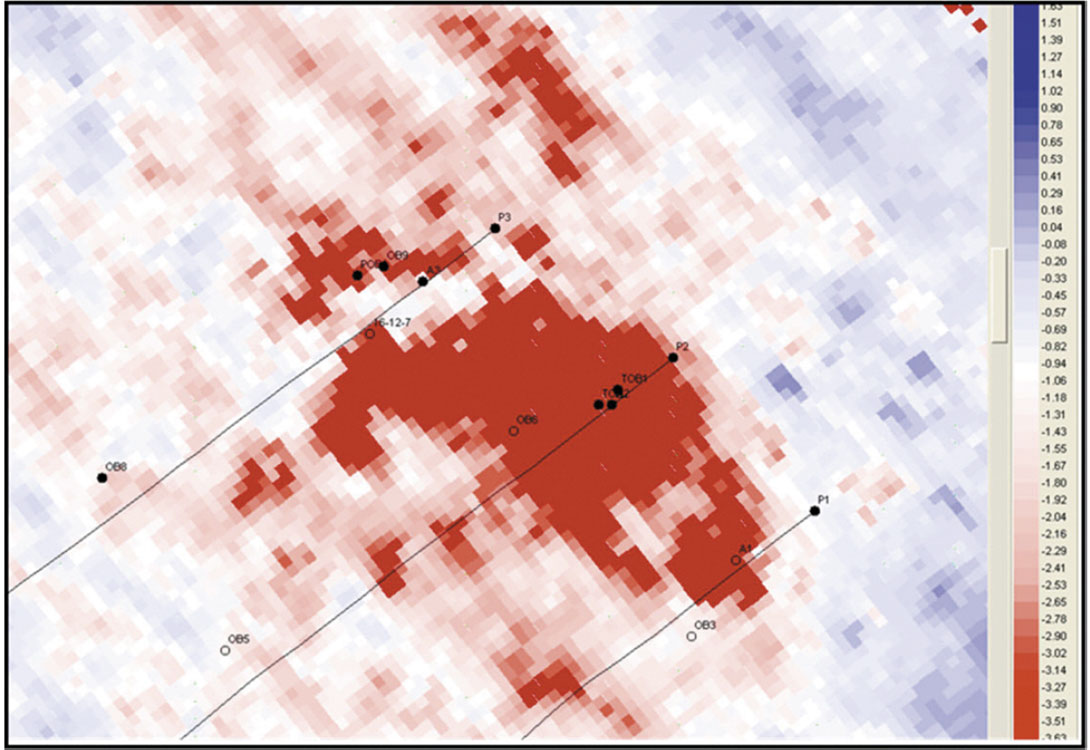
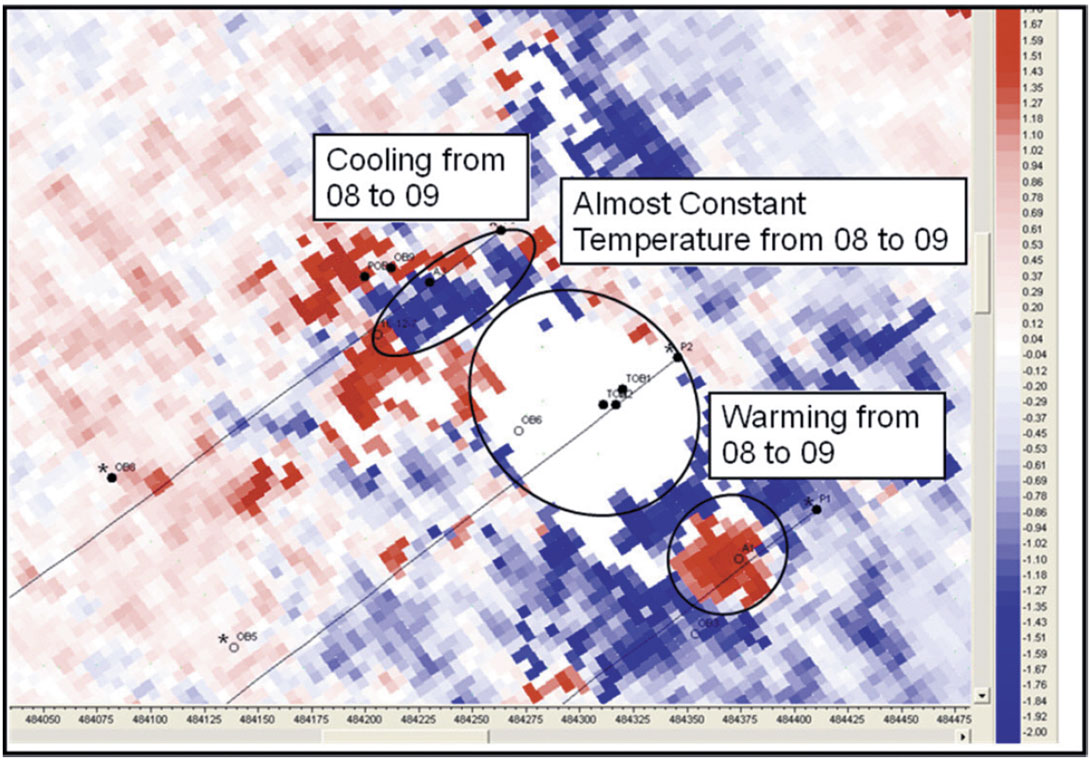
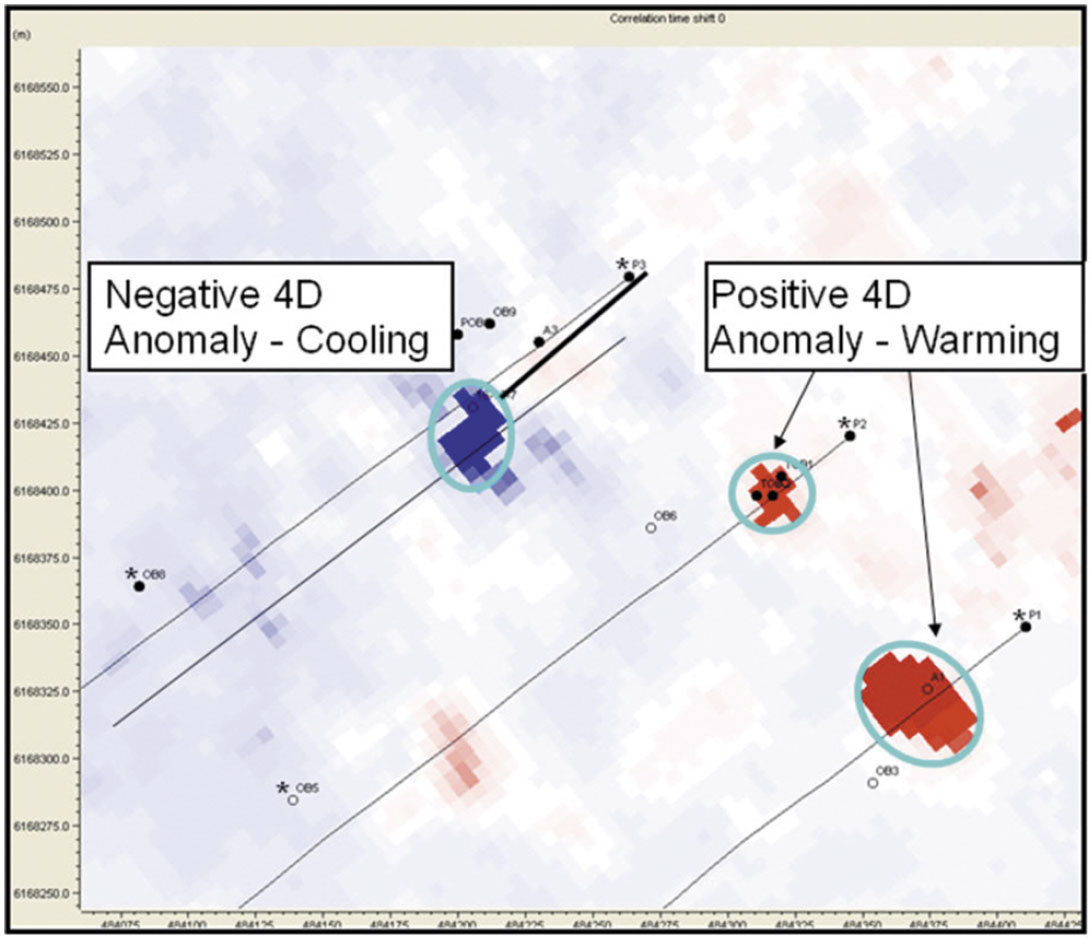
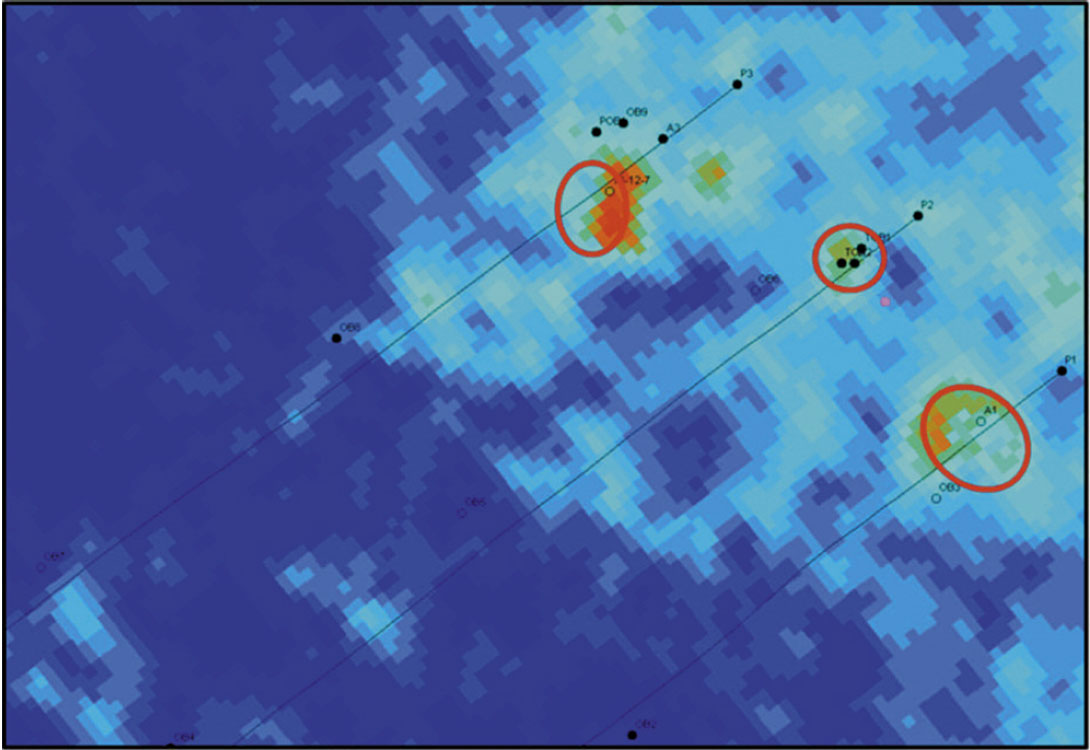
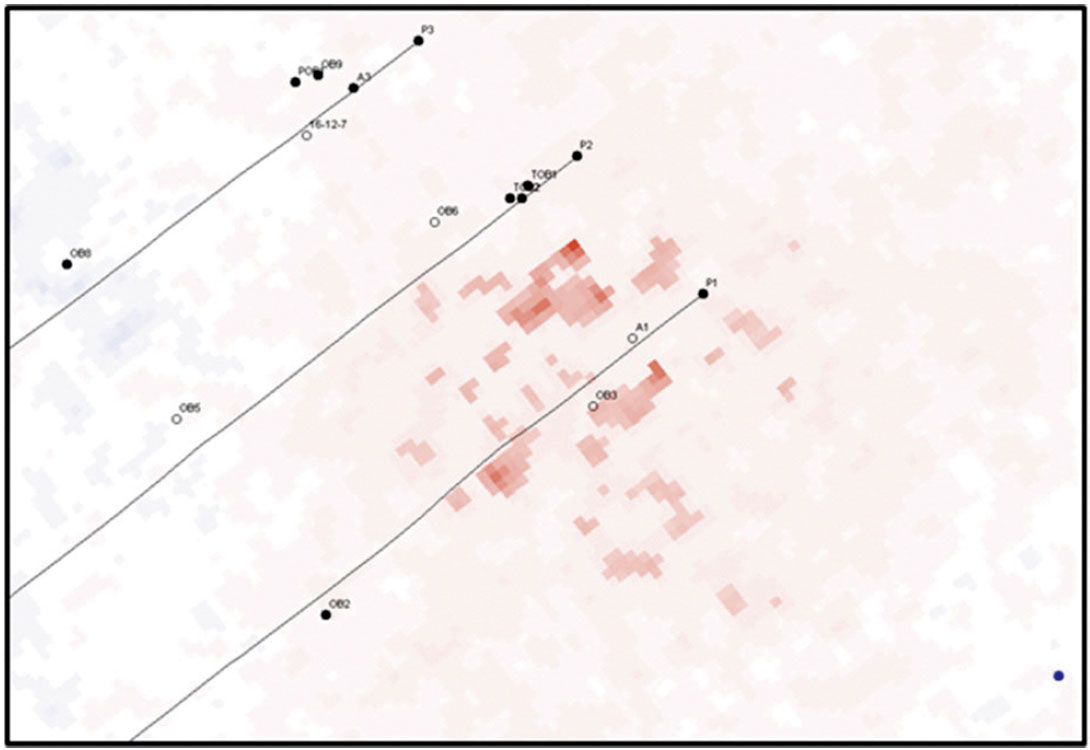
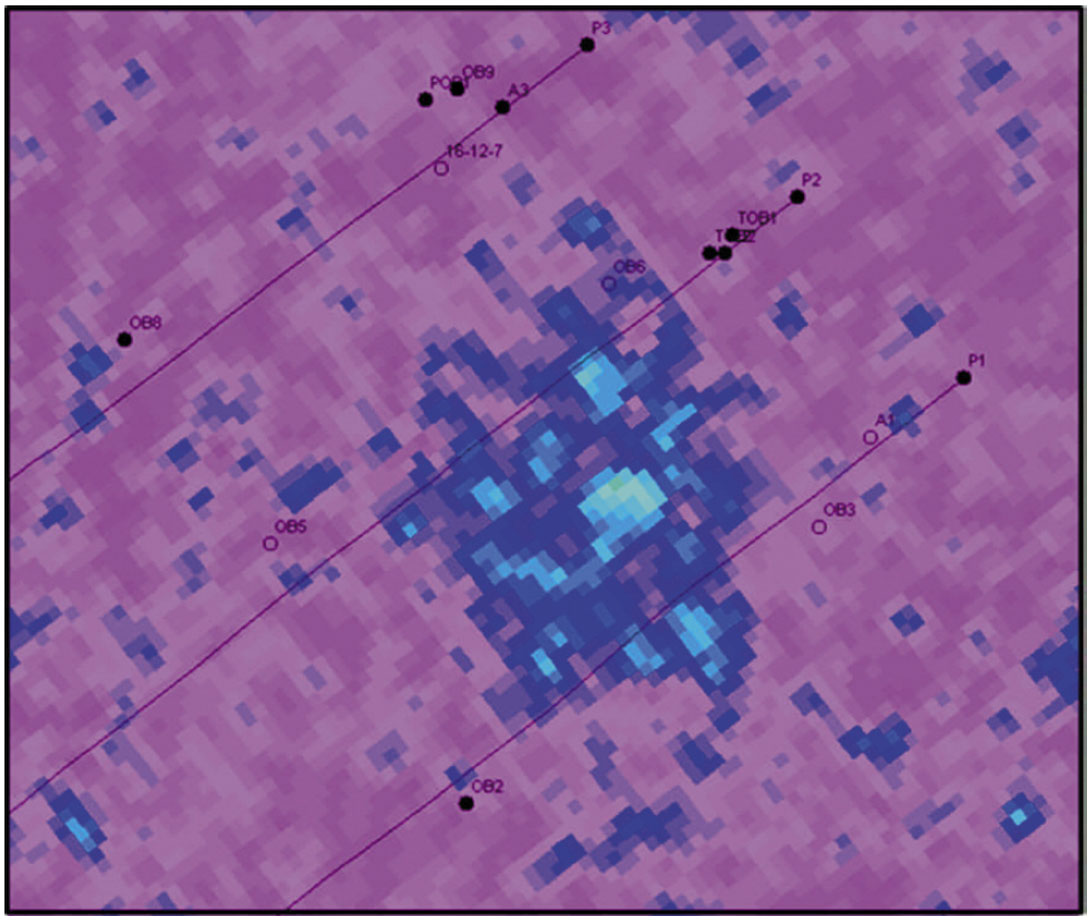
The P-wave time-delay anomalies for 2008 to 2003 are shown in Figure 5 and they clearly indicate that the lower velocity/high temperature bitumen sand is concentrated towards the toe of the producing wells and moving towards the heel. The thermocouples near the toes of the wells all indicate temperatures in excess of 600°C compared to the native state temperatures before combustion of 15°C. Figure 6 shows the P-wave time-delay anomalies for 2009 to 2003. While Figures 5 and 6 show great similarity they also highlight areas of change between 2009 and 2008. The combustion front still looks like it is moving in a toe to heel direction but some areas look like they were cooling (near A3), some areas look like the temperature has remained constant (near A2) and other areas looked like they were warming (near A1). Figure 7 shows the difference of the differences ((2009-2003) – (2008-2003)) and Figure 8 show the straight difference of 2009 and 2008. Figure 9 shows the amplitude differences for the PP 2009- 2008 data. While we don’t show the full suite of comparable amplitude anomalies they do agree with the time delay anomalies but in a less dramatic way.
Shear-wave Timelapse Results
Figure 10 shows the time-delay anomalies for the 2009-2008 PS data and Figure 11 shows the amplitude differences for the PS data. It is important to go back to Figure 4 to understand why we might not be seeing similar time-delay anomalies on the PP and PS. We know that the THAI combustion process can exceed temperatures of 600°C and that the temperature profiles show a focusing of the effectively warmed area. That is, as the process stabilizes the higher temperatures become more focused. The pre-ignition- heating-cycle (PIHC) and the initial start-up conditions of the THAI process will increase the temperatures well beyond the point where the shear velocities go to zero. If we were able to go back to the native state temperatures (approx. 15°C) with the baseline PS then it is conceivable to imagine a very sharp line coinciding with the subtle change in temperature from 15°C to 90°C that the PP data would not be as sensitive to. The critical temperature for THAI combustion to occur is at about 90°C and so it may be possible to monitor the PS real-time velocity decrease (+ve delta T) to that point and hence guide the ignition timing.
Conclusions
The compressional– and shear-velocities of bitumen sand decrease dramatically with increasing temperature. The THAI™ process can be monitored using timelapse seismic and the results indicate that the combustion front is moving from the toe area of the producing wells towards the heel area.
Multidimensional interpolation can be used to dramatically reduce the bin size and hence increase the trace count of coarsely sampled 3Ds. The integrity of the interpolated data is sufficient for monitoring THAI™ combustion-style production using timedelay 4D methods. The implications for production monitoring of enhanced oil recovery is substantial using interpolation.

Acknowledgements
The author wishes to thank Petrobank Energy and Resources Ltd. and Whitesands Insitu Partnership for allowing the presentation of these results and CGGVeritas for seismic acquisition and processing.
Related Reading


Join the Conversation
Interested in starting, or contributing to a conversation about an article or issue of the RECORDER? Join our CSEG LinkedIn Group.
Share This Article