Introduction
In today’s era of tight commodity prices, there is a push to minimize the breakeven price (BEP) for resource plays and maximize their production. To lower BEP, exploration and production (E&P) companies have been drilling multiple horizontal wells off a single pad therefore reducing the environmental impact and minimizing the well moves. New technologies in drilling have led to wells being drilled at a higher rate which has significantly reduced the cost of drilling.
To lower costs, E&P companies have been diligent in how their exploration and development dollars are spent. Often, vintage 3D seismic programs that cover producing well sites are not of high enough resolution to be of significant value to resolve the inner details of the reservoir during its producing life. Reshooting the 3D with an objective of resolving features within the reservoir may be technically realistic but often economically or environmentally unfeasible. Geoscientists are constantly striving to add value to their projects which has led to interest in other lower budget seismic options that are available. One option is the Vertical Seismic Profile (VSP).
A significant amount of information with economic value can be derived from a VSP (Stewart, 2001). Some of this information includes:
- Improved velocity model
- AVO behaviour
- Multiple identification
- 2D reflectivity image away from borehole
- Anisotropic measurements
- High frequency 3D reflectivity volume around from borehole
A significant benefit of a VSP is the minimal environmental/carbon footprint it has. Minimizing environmental impact is achieved by placing surface source points on existing cutlines, cutblock, or other open areas. Detailed modeling will also help reduce the environmental impact of a VSP by minimizing ground disturbance to what is absolutely necessary. Strategic placement of surface points based on appropriate modeling will minimize the environmental impact while optimizing the economic value of the data that a VSP will provide.
In this low-cost environment, it is innovative ideas that tend to lower costs and environment footprint, such as the coordination of the simultaneous acquisition of multiple types of seismic programs such as a VSP and surface seismic (Charles et al., 2019). An E&P company could also acquire a surface microseismic project at the same time, if a well was to be fracked during the acquisition of the seismic. It comes down to optimizing opportunity to achieve the full benefit and a minimal cost. The cost of the source points could be shared between the seismic acquisition and the VSP. If a fracking job could be coordinated as well, the cost of receivers could be shared between the seismic acquisition and the surface microseismic receivers. Although challenging, coordinating all these operations can have significant impact on the BEP of the play. It is thinking out of the box and trying to utilize synergies that will make a company more cost effective. The three datasets (3D, VSP, and microseismic), if recorded as proprietary data, could later be licensed as speculative data generating some income to offset the original costs of the acquisition. The goal is to minimize costs and maximize return. Income generated from the sales of seismic licenses can be used to purchase other seismic, and if done so is not a taxable income.
Why acquire a VSP
In the simplest form, a VSP is a useful tool to obtain measurements of rock properties of the subsurface (Stewart, 2001). Rock properties include velocity, impedance, attenuation, and anisotropy. Due to the simple fact that the downgoing seismic energy is only required to travel through the highly attenuative near surface once, the VSP data will be of higher frequency and therefore higher resolution at depth when compared to surface seismic. The ability to extract local velocity estimations as well as anisotropic measurements even with no knowledge of the overburden makes a VSP an excellent tool for advanced processing methods (Grechka et al., 2007).
The potential value added of a VSP to exploration or development projects depends on the complexity of the VSP. In order of increasing complexity, they have been summarized below:
- Zero-offset VSP (Checkshot)
- Walkaway VSP
- Multi-azimuth VSP
- 3D VSP
There is increasing cost with each of these survey types, but the information that can be extracted also increases. Every project has different geological challenges associated with optimizing well production which means the increased economic value that seismic can provide will also vary between projects. Below is a list illustrating the values of the different kinds of VSP projects (Stewart, 2001):
- Zero-offset VSP (Checkshot)
- Improved velocity model
- Walkaway VSP
- Improved velocity model
- AVO behaviour
- Multiple identification
- 2D reflectivity image away from borehole
- Multi-azimuth VSP
- Improved velocity model
- AVO behaviour
- Multiple identification
- 2D reflectivity image away from borehole
- Anisotropic measurements
- 3D VSP
- Improved velocity model
- AVO behaviour
- Multiple identification
- 2D reflectivity image away from borehole
- Anisotropic measurements
- High frequency 3D reflectivity volume around from borehole
Improved Velocity Model
The fundamental information that can be extracted from a VSP is the seismic time-to-depth relationship. A precise time to depth relationship can be used to correlate the time domain surface seismic to depth (Stewart, 1989). The time-to-depth relationship from a VSP can be used to calibrate sonic logs for ‘time drift’. On top of the improved time to depth relationship, valuable insight into other earth properties such as attenuation and shear wave contamination can be gained. VSPs can be used for correcting phase rotation of P and PS data, depth registration of P and PS data (Morrish and Bellman, 2013).
Improving the accuracy of depth calculations can be of great value when using seismic to guide the drill bit. If the improved accuracy of the depth model can increase the probability of keeping
the horizontal well in zone, the small cost of the VSP can be easily recovered from the increased well production. The highly improved velocity model can also be extremely valuable in the depth placement of induced seismicity events during a fracking project.
AVO Behaviour
AVO information of a reservoir zone can be extracted from a walkaway VSP (Coulombe et al., 1996). High frequency VSP data can provide valuable information into understanding the AVO response and tuning effects within the reservoir zone. Understanding these effects can further de-risk any prospective AVO play within the project.
Multiple Removal Contamination of a reservoir zone by multiples in surface seismic data is a common issue for many reservoirs all over the world, including the deep basin of Western Canada Sedimentary Basin (WCSB). In the deep basin of the WCSB, there are many multiple-generating coal layers that have frustrated geoscientists for generations. VSP is a tool that can help the suppression of both long and short period multiples (Dubey and Sinha, 2001). The successful suppression of multiples can allow stratigraphic detail, previously obscured by multiples, to become clear. The increased resolution within a reservoir can significantly increase the value of surface seismic data to an E&P company.
Anisotropic Measurements
Seismic images usually become noticeably clearer when an anisotropic velocity field is used in processing (Grechka et al., 2007). The increased ‘crispness’ of the seismic image can allow for increased resolution within the reservoir, as well as information that relates anisotropy to physical causes such as lithology, fractures, and stresses. 3D or walkaround VSPs can be used to help identify natural fractures within the borehole area at the depth of the receivers (Priol and Jocker, 2009). As well, in situ measurements of anisotropy, velocity, attenuation, multiples, stress and fracture orientation can be achieved with high resolution thanks to 3D VSP (Campbell et al., 2013). The ability to quantify anisotropy from VSP data allows further improvements to the resolution of surface seismic, thus further increasing the VSP`s value to an E&P company.
High frequency 3D reflectivity volume around from borehole
As mentioned previously, the inherent nature of a VSPs higher frequency content (when compared to surface seismic) is one of the greatest values of a VSP. Higher frequency content leads to high S/N images, making 3D VSPs very valuable for reservoir characterization in the vicinity of the well (O’Brien, 2013). The higher resolution data near the well will also help identify smaller faults/fractures that are beyond surface seismic resolution (Hardage, 2000).
Inclined heterolithic strata (IHS), which are formed by laterally-accreting, fluvial-estuarine point-bars (Dahl et al., 2010), can create compartmentalization within the point bar, preventing communication from one compartment to the other. If the horizontal well is parallel to the IHS only that compartment will be drained. This can help explain the variability of production between two adjacent horizontal wells.
To avoid this issue, it is important to drill 90o to the IHS bedding, cutting across the different compartments in the point bar. With traditional seismic IHS are difficult to see due to frequency and parameter limitations. The higher frequency nature of the VSP data will allow geological complexities such as this to be imaged more clearly, allowing the fracking program to be designed to maximize production based on geology.
Geoscientist love to extract information from data, and generally the more data the better. The most important element is to determine which of the above information will have the greatest impact on the BEP. The main driver in today’s development of fields is to minimize cost but maximize production and return.
Modeling a VSP
Modeling is a valuable tool to understand what kind of information can be acquired from a VSP (Hardage, 2000). Whether it is ray tracing or finite difference modeling, these tools can help to understand the value of acquiring a VSP for the project. Information such as dip of seismic reflector, subsurface coverage for a particular VSP geometry, fault detection and magnitude, angular unconformities or IHS bedding can all be potentially extracted from VSP data. Ray tracing is invaluable for determining the optimum field layout of the VSP to maximize return on investment. Modeling can prohibit the recording of more data than is necessary to reach exploration objectives. It can also be used to determine how much of a subsurface anomaly can be imaged by a VSP geometry.
Interested in acquiring a VSP, what needs to be known?
When considering acquiring a VSP, it needs to be determined what information will bring the greatest economic benefit to the project. Once it is determined that the value of the VSP data is worthy of the necessary capital investment, it is time to model the VSP. Important variables that are required to determine a proper cost estimate include:
- Type of VSP survey required (Zero-offset (check shot), Walkaway, Multi-azimuth, 3D)
- Service providers equipment available
- Number of surface source points, and their locations
- Subsurface receiver interval and span (depend on tool’s available and tool move ups required)
Modeling of the VSP project can help:
- Determine the illumination of the coverage area – how far from the borehole can a structure be imaged depending on incident angles/offset for target depth
- Determination of critical angle – furthest offset that will contribute to subsurface image
- Tool length impact on subsurface image area or volume
- Azimuthal modeling for anisotropy
- Incident angle analysis for AVO work
Walkaway VSP
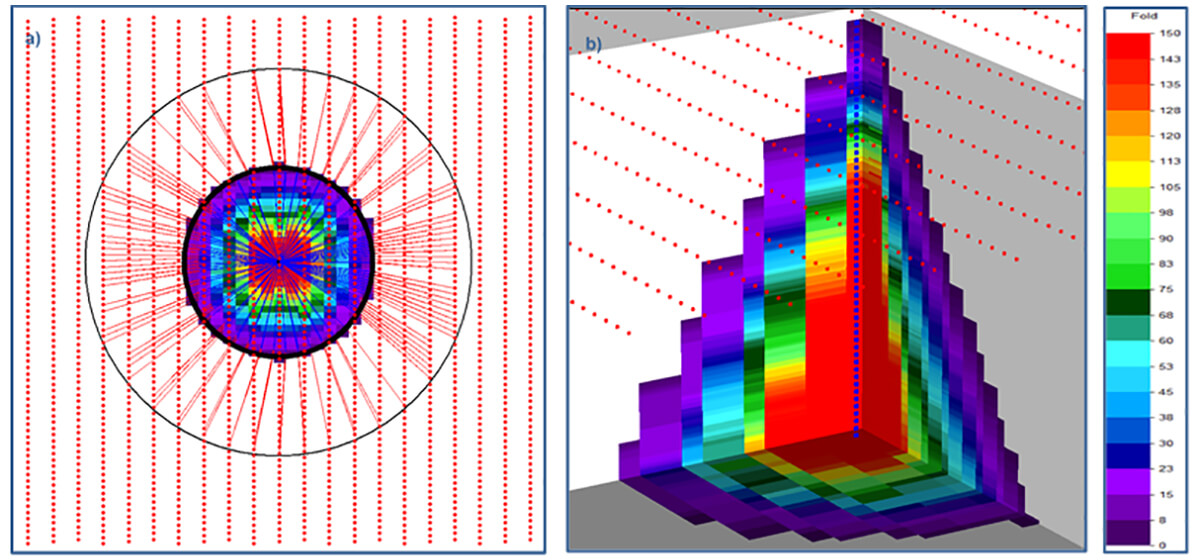
Figure 1 shows a standard walkaway VSP from a map and 3D view perspective with surface sources in red, and the borehole receivers in blue. The VSP parameters that are ideally determined by modeling are:
- Source line direction
- Receiver Interval
- Far offsets
- Surface shot interval
- Borehole receiver depth range
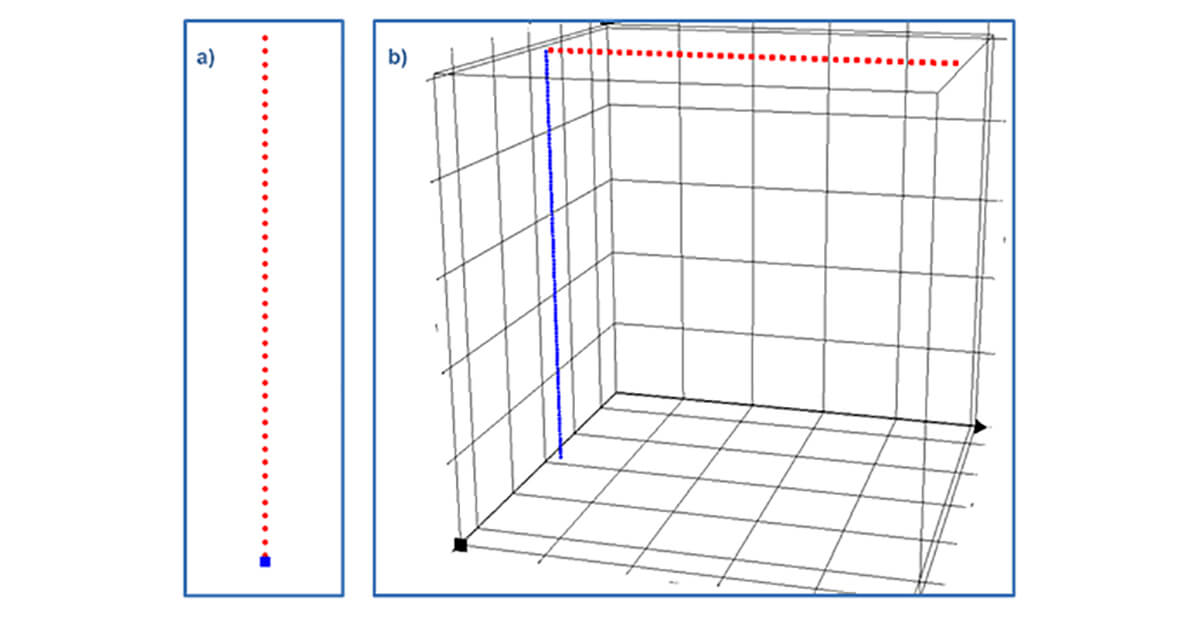
Figure 1. Walkaway VSP (sources - red circles, receivers - blue squares). a) Map view, and b) 3D view (source - red circles, receiver - blue squares).
Source line direction
Typically, the direction of the surface source line will depend on ground access to minimize environmental impact (i.e., existing cutlines, roads, open areas, etc.). At the same time, any geological imaging implication needs to be considered. An example would be fault identification where it would be geologically ideal if the line direction could be oriented perpendicular to the fault.
Receiver interval
The borehole receiver interval is a parameter that can be analyzed to determine spatial aliasing limitations but quite often the limitations are on the specifications of the tools that the local borehole acquisition companies have available. Therefore, any modeling done regarding the receiver interval is completed more to understand any spatial aliasing limitations present for a proposed VSP.
Far offsets
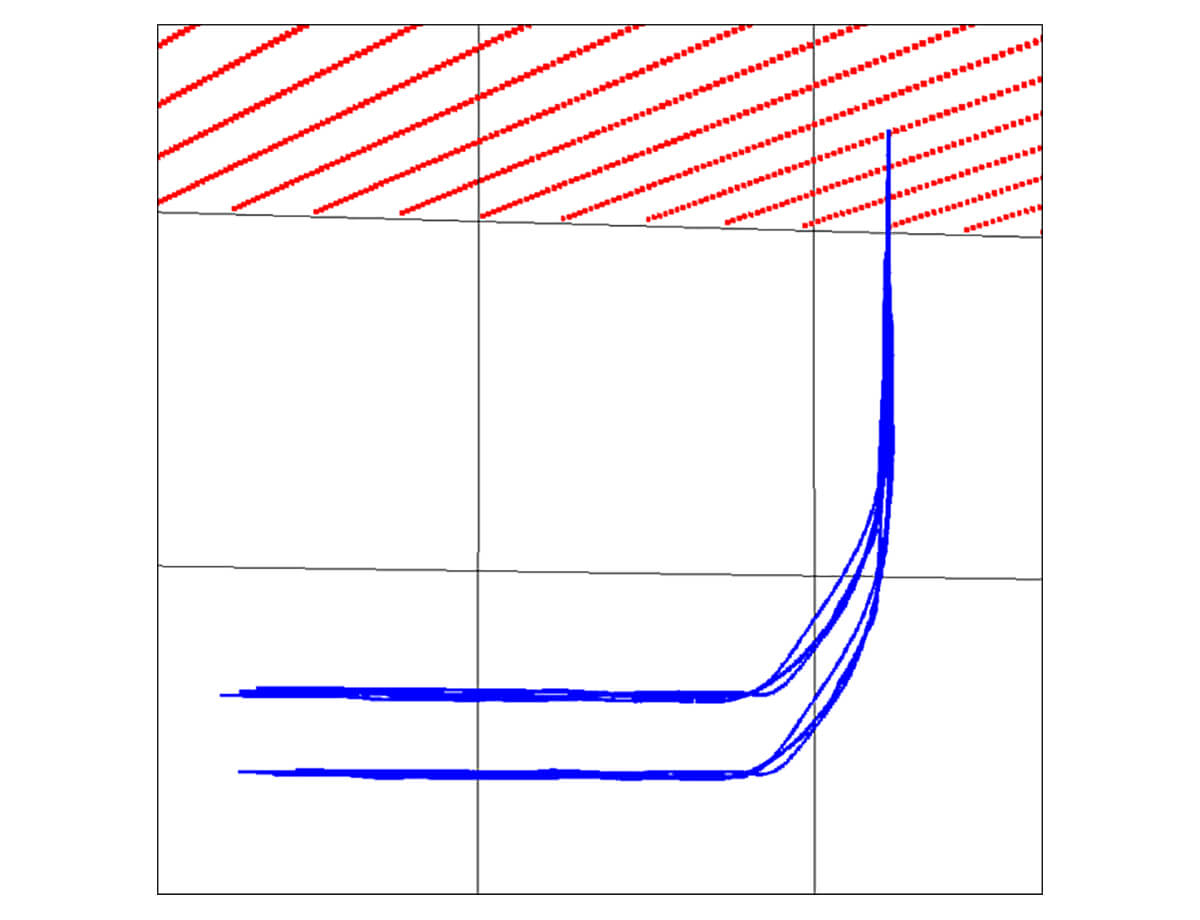
Modeling for far offsets requires a realistic velocity model for the project area, calculating the critical angle via ray tracing, and determining the maximum offset to image the target zone. Figure 2 shows a 2D ray tracing demonstrating the down-going waves as red and up-going receivers as blue.
In this example, notice that the last 9 source points (SP) are beyond the critical offset and therefore should be removed because they do not add value to imaging the target zone.
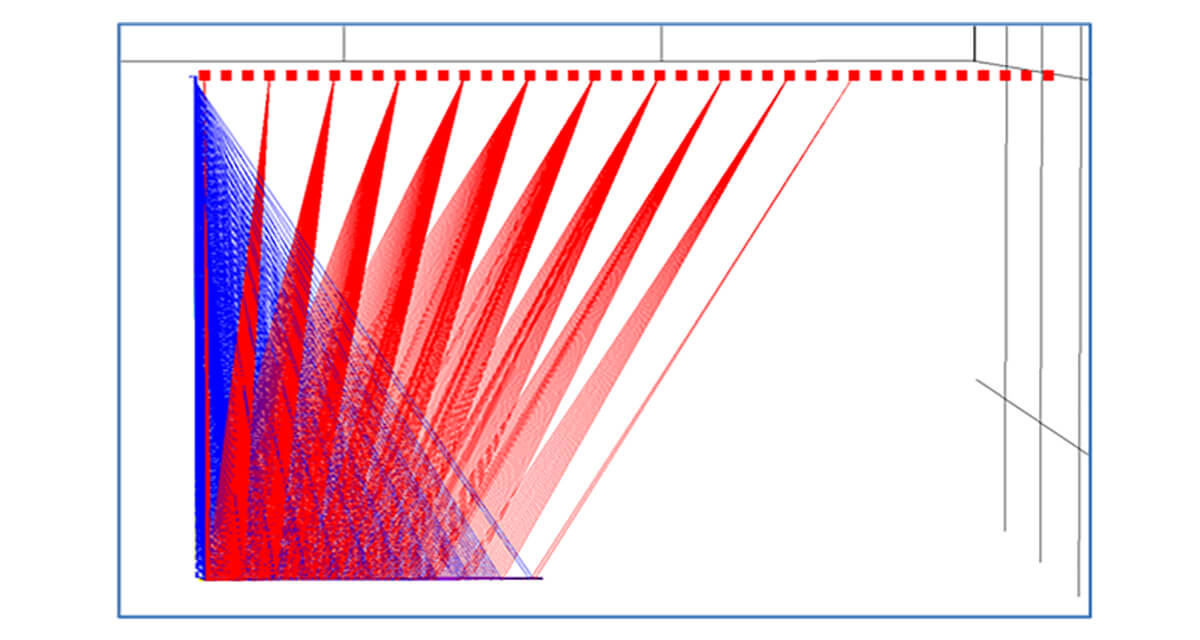
Figure 2. Walkaway VSP (sources - red circles, receivers - blue squares) – Ray trace demonstrating down-going rays as red and up-going rays as blue.
Surface shot interval
Varying the shot interval can help improve the signal-to-noise ratio (S/N) of the data. Depending on how many tool movements are required, the same surface position may need to be acquired multiple times and therefore adding significant cost if there are too many SPs. In Figure 2 there are 28 SPs illustrated for the walkaway VSP. If 4 tool moves are required to collect rays from the surface to the target zone, each shot point will need to be required 4 times for a grand total of 112 source points. If vibroseis is used as the source, the vibe will have to travel the length of the source line 4 times (for each tool move).
Borehole receiver depth range
A critically important part to determining the source far offset is determining the depth range of the borehole receivers, specifically how shallow the receivers should be. The ray tracing image in Figure 3a demonstrates that to image out as far as possible from the borehole, receivers will have to be shallow in the borehole.
Based on the descriptions above, notice the intertwined nature of the borehole depth range and far offsets for VSP modeling.
Typically, the downhole tool cannot extend from surface to target zone, so multiple tool moves are required to extend the receiver coverage to the shallow part of the well. Figure 3 demonstrates the impact of not acquiring borehole receivers in the first 500 m of the borehole. The far offset subsurface coverage has been significantly reduced when there are no shallow borehole receivers. In Figure 3b ~240 m of far offset imaging has been lost by not placing the tool in the first 500 m of the borehole.
It is important to note that the far offsets will be of lower frequency (compared to the near offsets) but will show the AVO effect, allowing the type of AVO within the data to be determined.
This is valuable information for interpreting traditional seismic data. The frequency content of the VSP far offset traces will still be of higher frequency than surface seismic since the wavefront energy only has to travel through the highly attenuative near surface once, hence higher vertical resolution and less tuning. None of the above modeling takes into account the integrity of the borehole in the near surface and any negative impact it may have on the far offset data.
To determine the far offsets for a VSP requires modeling with a proper velocity model. Modeling is important to minimize costs by optimizing how many source points are to be recorded, as well as how many tool movements are required. The number of tool movements is defined by the depth range of borehole receivers required, divided by the length of the tool. Every time the tool is moved, the appropriate source points need to be repeated at varying offsets, which can significantly increase the cost of the project. For example, if 4 tool movements are required to cover the entire length of the borehole, then all the source points will be shot 4 times. The prospect of having to acquire every source point in the survey 4 times establishes how important it is to model the VSP to optimize exactly what is needed to be acquired to reach the technical and economic objectives of the project.
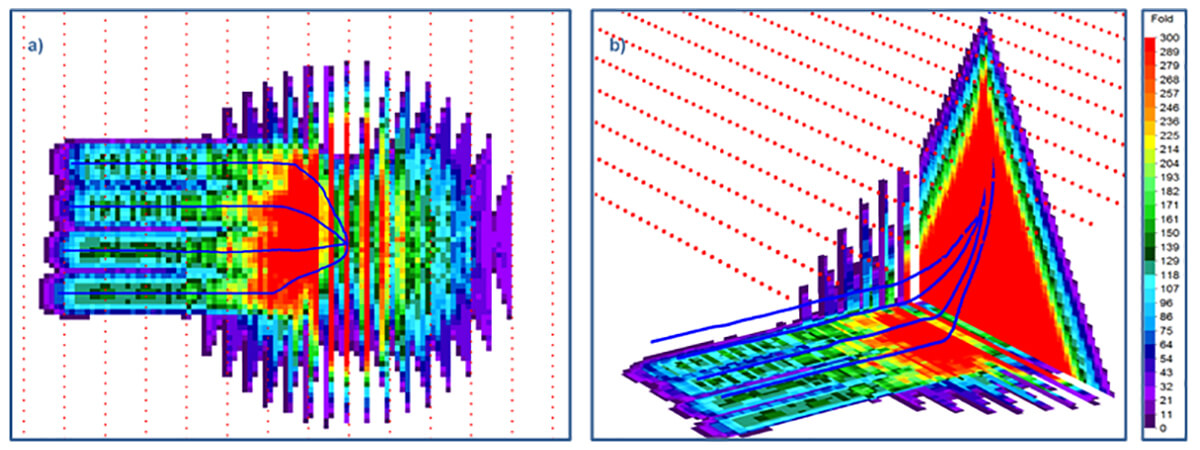
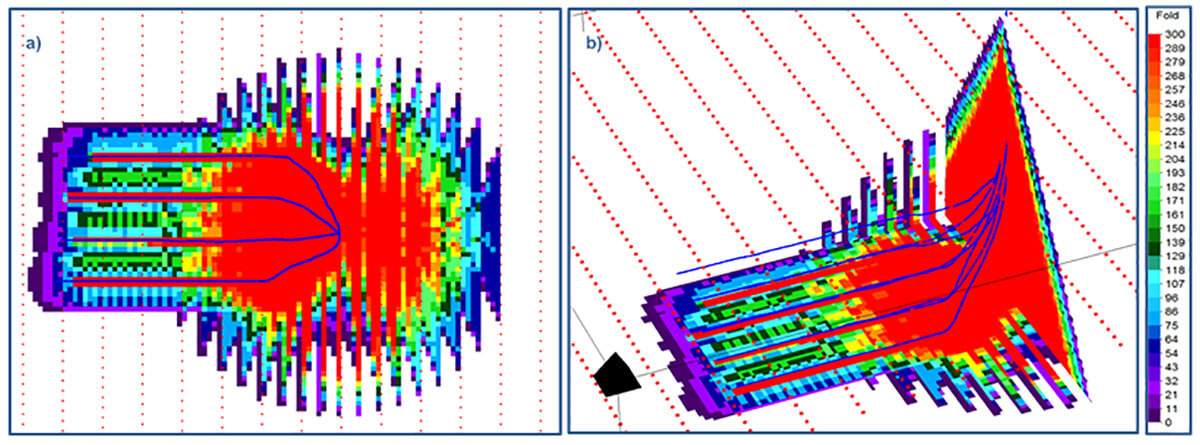
3D VSP
A 3D VSP is shown in Figure 4 with a consistent source line interval and station interval. When considering a 3D VSP, adding additional tool moves must be carefully evaluated. Any additional moves can easily add 100's of additional source points and significantly increase costs. 3D ray tracing of the 3D VSP from Figure 4 is shown in Figure 5 to demonstrate source/receiver pairs that will contribute to imaging of the VSP.
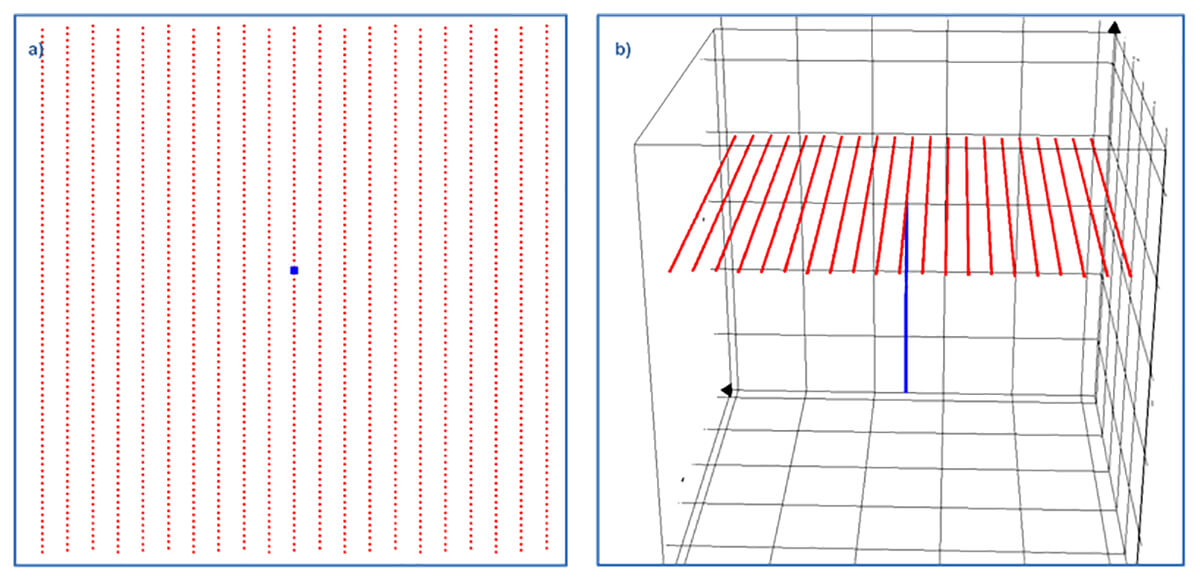
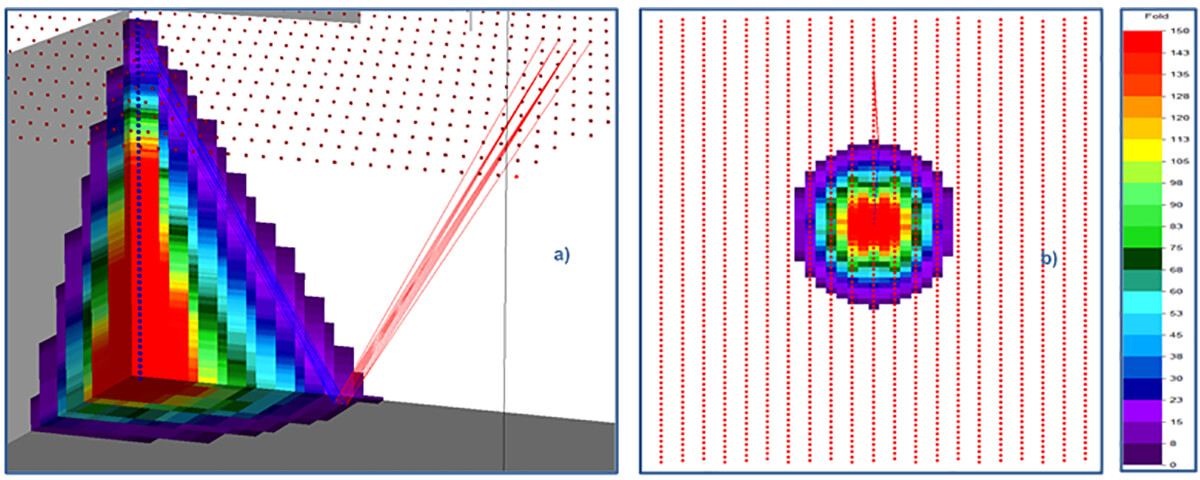
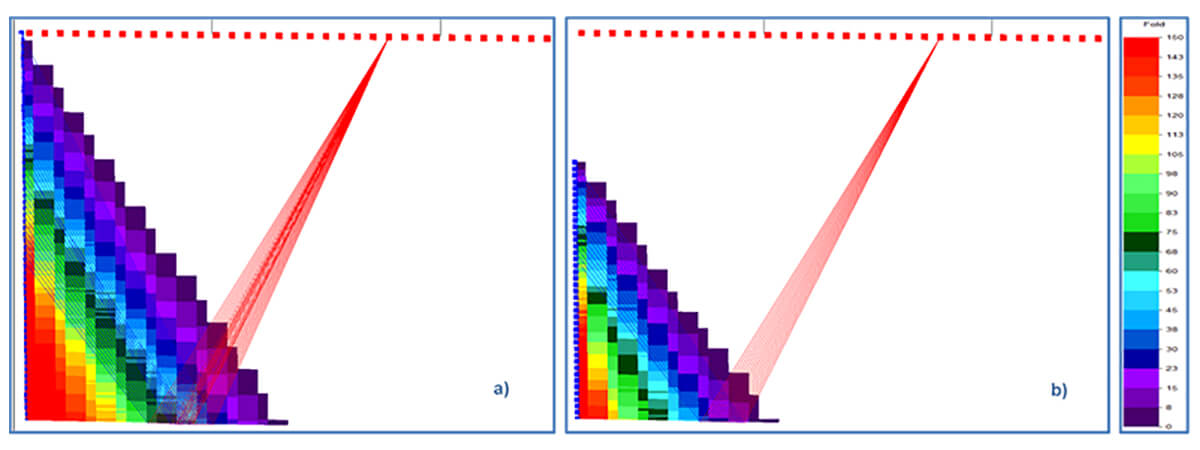
Figure 6a shows a map view showing the largest offset sources to image the 1500 m target. The source point energy past the black radius of 1850 m will go critical at the target reflector. Based on the modeling, there is no point acquiring any points of greater offset than 1850 m from the vertical borehole. Removing all the source points beyond 1850 m offset will result in a significant savings in capital. The inner radius represents the lateral extent of imaging out from the borehole to a radius of 925 m. Understanding that the absolute maximum that can be imaged from the vertical borehole is 925 m for a target depth of 1500 m is also helpful to understand the imaging limits of a VSP.
If applying an AVO analysis to the VSP data is of value; understanding incident angle fold coverage is critical (Figure 7). The inner black radius is the zero-outline edge of fold coverage at the 1500 m target depth. The plots give a relative comparison of incident angle ranges to help understand the limitation of any AVO analysis that is technically possible for the VSP data.
Using Distributed Acoustic Sensing (DAS) as a VSP tool
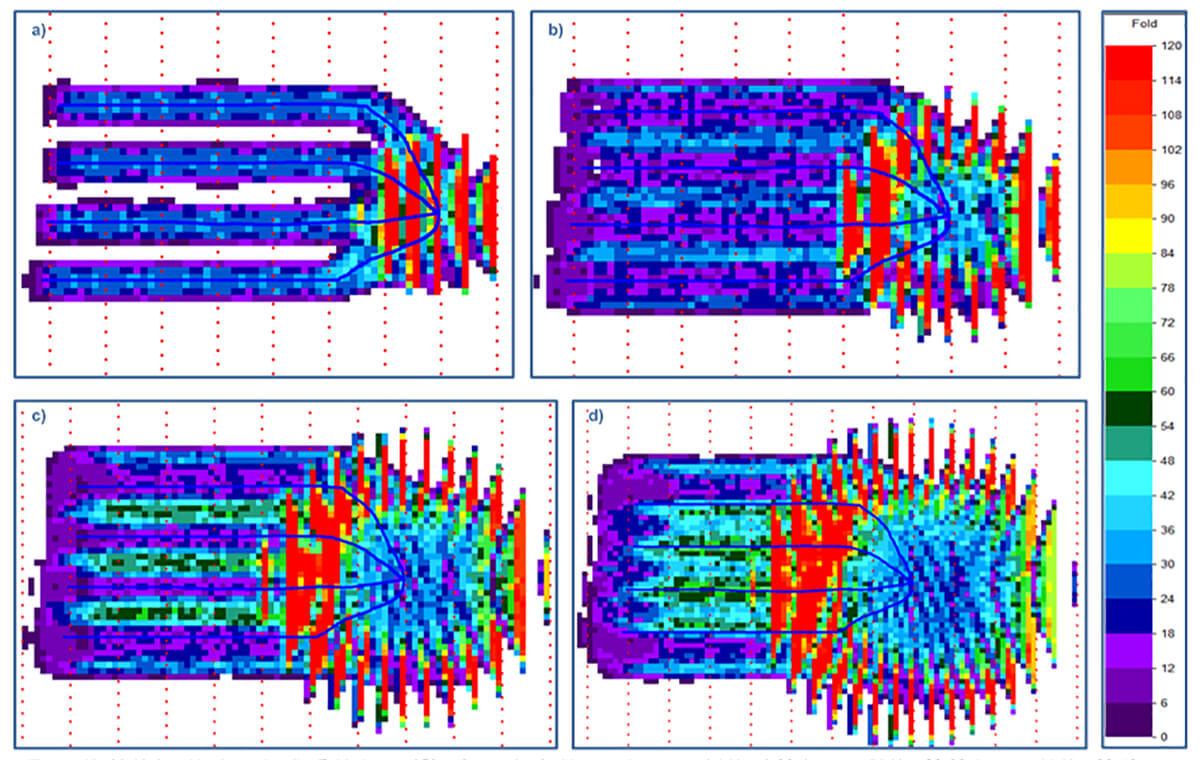
With the development of Distributed Acoustic Sensing technology, recording VSP with DAS equipment adds another type of data that can be collected to provide additional value to the project area. The question becomes what kind of imaging information a DAS VSP can provide over/above a standard VSP. The most obvious difference is the extremely small station interval that can be recorded with DAS. Any potential aliasing of high frequencies caused by the larger sensor spacings in typical downhole tools has been removed with the DAS sensor spacing. Another interesting opportunity is recording the DAS information on the horizontal portion of the borehole, on top of the typically recorded vertical portion (Figure 8). What additional imaging can be achieved by recording the horizontal well segment? This is where modeling can help answer the potential imaging value along the horizontal boreholes.
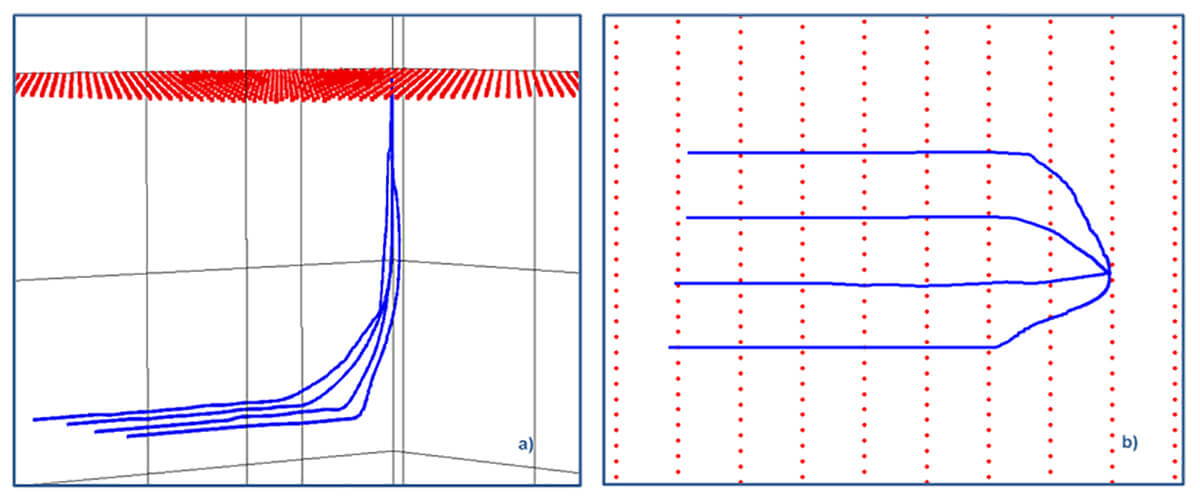
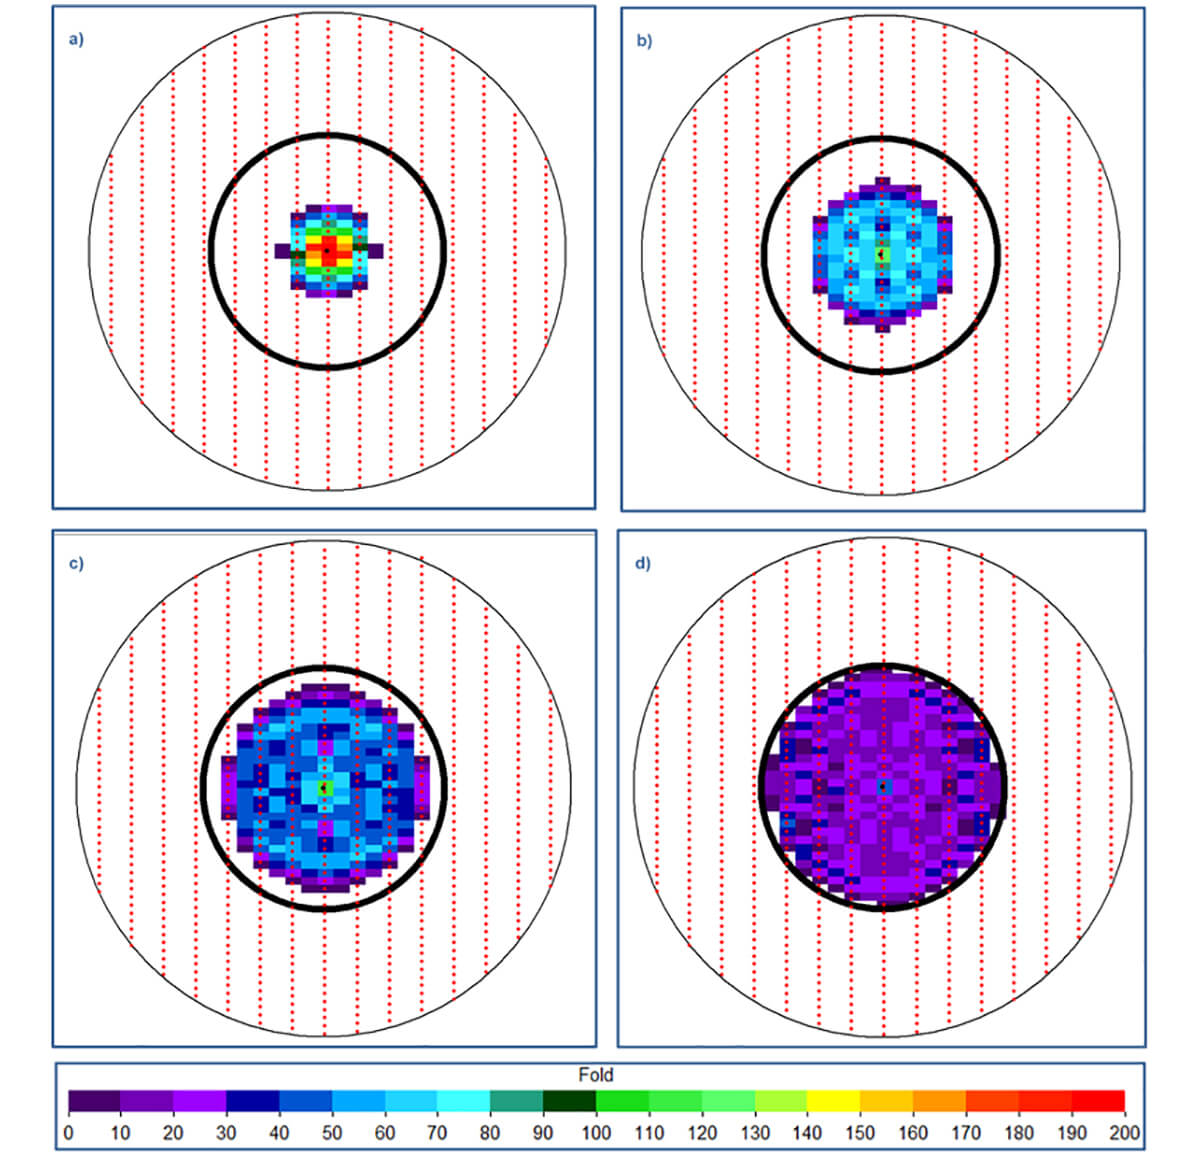
Figure 9 shows the fold coverage at approximately 50 m below the horizontal borehole (1450m). Notice that, at 50 m below the borehole, what is being imaged is directly beneath each horizontal, which is unfortunate as the area of greatest interest is where the horizontal well is located.
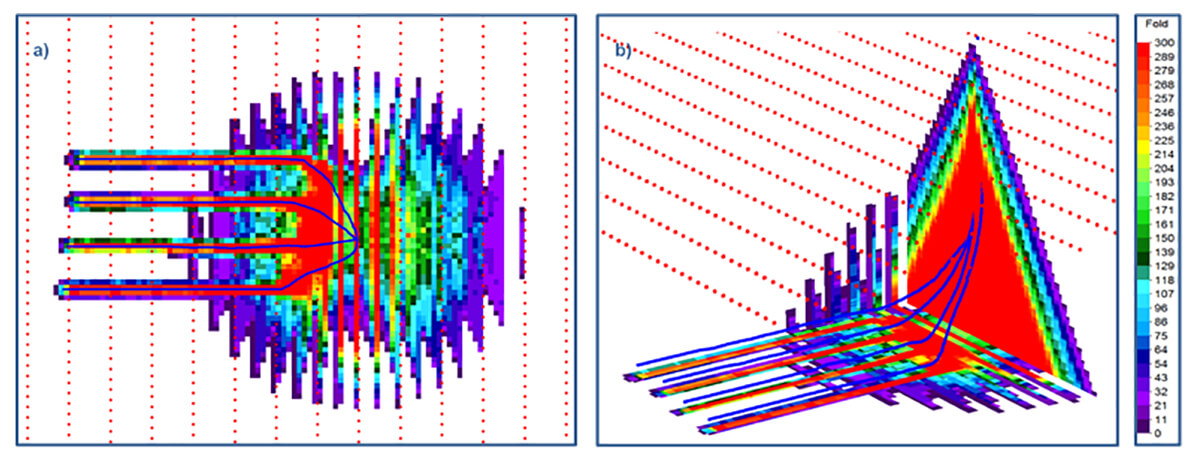
Figure 10 shows coverage at 150 m below the borehole. The additional separation between target depth and DAS sensor location has become large enough to allow for the areas between the horizontal boreholes to be imaged. Unfortunately, the area of interest is directly surrounding the horizontal, therefore it significantly reduces the value of DAS imaging along the horizontal well bore. Although not all is lost, as the direct arrivals will still be recorded directly along the entire length of the horizontal borehole, which will provide very detailed velocity information that can be very valuable to the project development.
In certain unconventional plays such as the Montney, multi-tiered horizontal wells are becoming increasingly popular. If multi-tiered horizontal well was to be examined where the upper horizontal is 200 m above the lower horizontal (Figure 11), DAS imaging can become significantly more valuable.
Imaging a reflection (between horizontals) 50 m below the horizontal borehole is not achievable, as shown in Figure 9, but the lower horizontal borehole that is 200 m below is a different story. Figure 12 shows that the DAS sensors present in the shallow horizontal will allow for imaging at the depth level of the lower horizontal. The ability to fully image the lower horizontal borehole could add significant value to development of the project over the life of the well.
(a) Map view of fold coverage, and (b) 3D view of fold coverage.
It would be interesting to look at the impact of any AVO analysis of the deeper horizontal location by looking at incident angle fold plots. Figure 13 shows an example with 4 different incident angle ranges with full fold coverage between horizontal wells, for incident angles greater than 20 degrees.
Even though the first 20 degrees of incident angles is missing between the boreholes, there still may be significant value for acquiring these data, even more if the 4D repeatability of the survey is considered with higher frequency, higher resolution data. The potential value increase can be significant if this kind of survey would be used as part of a rock properties study, as full range of incident angles would be present (Charles, 2019).
Another important aspect of VSP modeling is to properly model the PS data. It is often assumed that if PP data is recorded, the PS will be fine. Often, this is an incorrect assumption therefore it is recommended to design and model for PS anytime 3C geophones are used.
3C 4D VSP in the heavy oils in South East Alberta and South West Saskatchewan
3C 4D VSP data can help to determine fluid flow, which can help in the determination of future enhanced recovery techniques. In the heavy oil sands, different production techniques are utilized such as steam injection and Cold Heavy Oil Production with Sand (CHOPS).
With CHOPS the development of the wormholes can be monitored using a 4D VSP, because when the sand is produced, it will cause the reservoir pressure to fall below the bubble point, causing the gas to come out of solution and causing a time lapse anomaly (Wikel and Kendall, 2013).
In thermal recovery processes, the PS splitting can be used to detect stress effects in the reservoir and/or caprock. These data can be used as a constraint on reservoir simulation and for geomechanical analysis of the reservoir and caprock (Wikel and Kendall, 2013).
4D VSP in resource plays to determine hydraulic stimulation
The development of unconventional reservoirs like the Duvernay or the Montney is dependent on the horizontal and vertical well spacing, completion strategy, and timing among other factors. There are issues now in unconventional plays where parent wells were drilled to hold the lease and determine the production. After the parent wells were drilled, E&P companies are going back in and drilling the child wells but are encountering interference between the parent-child wells which is affecting production in both wells (Meek et al., 2017).
In the Permian, Pioneer Natural Resources acquired 4D 3D VSPs in a vertical well using an external DAS optical fiber, before and immediately after the stimulation of two offset horizontal wells. The fiber optic cable makes the acquisition of repeatable 3D VSPs inexpensive compared to traditional geophone sensors. There were amplitude changes and traveltime differences observed in the 3D DAS VSP that changed azimuthally between the before and after volumes. The height of the stimulation inferred from these differences was similar to the height estimates obtained from analysis of the other methods employed, such as a conventional VSP with geophones, microseismic data, tiltmeters, external pressure gauges, radioactive tracers, and distributed thermal sensing (DTS) (Meek et al., 2017).
Using the 4D 3D VSPs provided a more comprehensive and accurate estimation of the hydraulic fracture geometry and the dynamic processes taking place internal to the propagating fractures. These data could also be used to calibrate fracture models and the fracture interaction with the surrounding unconventional reservoirs (Meek et al., 2019).
Understanding the frack geometry can help in determining the spacing between adjacent horizontal laterals. In unconventional fields, the “parent well” is generally drilled to hold the lease for production and to prove up the reserves using a Type curve. Type curves analyzes the pressure drawdown (flow) and buildup tests. Type curves are pre-plotted solutions to the flow equations for selected types of formations and selected initial and boundary conditions. They are the best representation of well performance and EUR expectations for multistage frac unconventional plays (Schulte, 2019). Based on the Type curves, “child wells” are drilled adjacent to the parent but if the spacing is too tight when the child well is fracked, it interferes with the parent well and the pressure goes down in both wells reducing the permeability. Placement of child wells need to be optimized so they don’t interfere with the parent well and they are not too far apart that would leave behind hydrocarbons in the unconventional reservoir.
Conclusions
Every well in every project have unique geological and geophysical variables that make modeling and design an important step in the acquisition of every VSP. Variables can include varying geology, velocity model, reservoir depth, horizontal borehole configuration, surface constraints for source points, and many others.
VSPs are a valuable tool for E&P companies to add economic value to their projects and to obtain high frequency image of the reservoir that may illuminate geology that is not seen in the traditional seismic, such as IHS bedding. Spending the time to properly model and optimize the acquisition of the VSP is critical to minimizing cost and environmental footprint while maximizing the economic value of the VSP to the project.
4D 3D VSPs have been used successfully in the heavy oil sands and also in the unconventional plays to better understand the fluid flow and the reservoir. This type of information is crucial in building the geomodel for the reservoir simulation. The better the geomodel is, the better the production history match will be, which substantiates the reservoir simulation. Determination of what is affecting the reservoir and understanding fluid flow is important in both conventional and unconventional plays and in determination of the economics of the field.
Distributed Fibre Optic Sensing (DFOS) allows for multiple 3D VSPs to be recorded over the life of the field and allows not only for DAS to be recorded but temperature (DTS) and strain (DSS). DFOS is still in its early stages and as E&P companies work with the data, they will develop machine learning allowing what is happening in the reservoir to be inferred. This will allow E&P companies to optimize production and minimize cost, which leads to higher profit margins from a field and it equates to lowering of the BEP. Modeling of DFOS is going to become more important as we progress further with this technology.


Join the Conversation
Interested in starting, or contributing to a conversation about an article or issue of the RECORDER? Join our CSEG LinkedIn Group.
Share This Article