In 500 BC, the Greek philosopher Heraclitus wrote, “Nothing endures but Change”. When referring to man, the natural change of things is usually the result of endless attempts to make something better. When we visualize how seismic data recording will look in 10 years the only thing we know for certain is that it will be different than it is today. The sustained high price of imported oil over recent months and the growing emphasis on increasing oil and gas production, particularly through enhanced recovery, to meet ever higher demand emphasize the need to better understand the complexities of recently discovered reservoirs as well as to gain access to the “higher hanging fruit”. Conventional seismic recording methods are unlikely to provide the additional information necessary to meet these demands, and a change of methods seems inevitable. Through the use of new exploration and production tools we are taking steps toward defining the future of seismic in the oil and gas industry.
The first rationalization must be that seismic data and its resultant value to our industry is really a system of highly technical topics. Business drivers tend to break these topics into logical sectors. We can categorize these sectors as hardware technology, data acquisition technology, data processing technology, and interpretation technology. Nearly every geophysicist in our industry can probably describe his or her role by emplacement in one of these technology sectors. In general our efforts to improve the value of each of these sectors, for business reasons, could be described as a desire to access more data or to get better results. The second rationalization must be that all our efforts are generally focused on being able to predict details regarding the earth. The better we can do this as geophysicists, the more successful we are at what we do, no matter which technology sector we find ourselves working in. Combining these rationalizations we can form a generalized goal statement for geophysics and chart where seismic data is headed in the future. In 10 years, seismic data will be providing a more detailed picture of the earth and correspondingly its relevance will be increased as well.
The reality of these technology sectors is that advances in our capabilities usually require utilization of technology advances from other sectors. Hardware technology for recording seismic data is often the first technology that must advance and is then followed by improved field methods, processing and interpretation. Hardware technology is currently going through a series of dramatic changes. The general goal is to record the earth response to seismic wave propagation with the highest degree of accuracy possible. Contemporary assumptions regarding P-wave data such as vertically arriving plane waves and an isotropic earth are giving way to the acknowledgement that these assumptions are limiting what we can do with seismic data. The introduction of MEMS (Micro Electro Mechanical System) based 3C sensors and recording systems that are designed to deal with the specific requirements of efficient full wave acquisition have to a great extent eliminated the initial barrier to general advancement of seismic recording technology. High fidelity three-component digital sensors are yielding a wealth of information related to seismic wave propagation and the potential for significant gain seems tantalizingly close at hand. The view that three-component recording devices are only for those who wish to see shear waves is becoming increasingly out-dated and giving way to the belief that we must see seismic data as a complex vector wave field. In this vector wave field, traditional P-wave or S-wave data will need to be extracted and surface wave data need no longer be viewed as annoying noise with no value. In 2005 the seismic industry witnessed land acquisition with recorded channel counts approaching 20,000 live channels per record. Predictions for the future show nothing but the demand for increased channels counts. The current trend could be easily described as dense full wave field acquisition. By recording dense, wide azimuth 3D data with high fidelity three-component sensors we are getting data which creates the opportunity for seismic technology to step beyond many of its current limitations. With this opportunity will come many challenges for field methods, data processing and interpretation but without it, traditional single component P-wave recording will remain limiting.
Vector processing methods are beginning to meet some of the challenges. Azimuthal velocity analysis and azimuthal AVO analysis techniques first published in the late 1980’s are some excellent examples of processing methods that are based on earth model assumptions that are not limited to an isotropic earth. They represent the type of vector processing which will yield a wealth of new information. More recent efforts are processes which isolate wave types from full wave recording. Polarization filter methods are allowing processors to attenuate specific wave modes such as surface wave noise in P-wave data. These new methods make no assumptions regarding spatial sampling and tend to better preserve the original bandwidth in the filtered seismic data without adding any azimuthal bias due to mixing caused by transforms such as FK. This leaves the filtered data as a much truer representation of the vector wave field than can be expected from older methods. Other processes correct for high velocity layers in the near surface yielding superior P-wave results in areas with permafrost layers or areas with complex near surface geology causing similar complications.
Near-surface high velocity layer correction
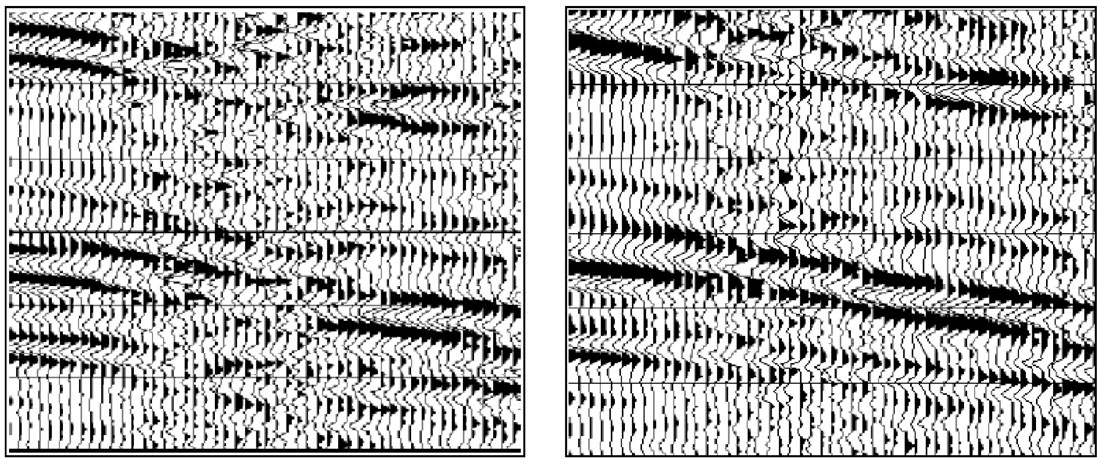
In this example (Figures 1 and 2) we show improved stack response for P-wave data in the presence of a high velocity near-surface layer, e.g. permafrost, basalt, carbonates. A simple correction similar in complexity to familiar surface consistent static corrections yields a superior stack result. This type of correction recognizes that P-wave energy is not vertically emergent due to ray bending caused by high velocity near-surface layers. By recording in three-components we can gain even greater understanding of the near surface, in particular, using horizontal components to recapture lost P-wave energy that is emerging more horizontally than vertically.

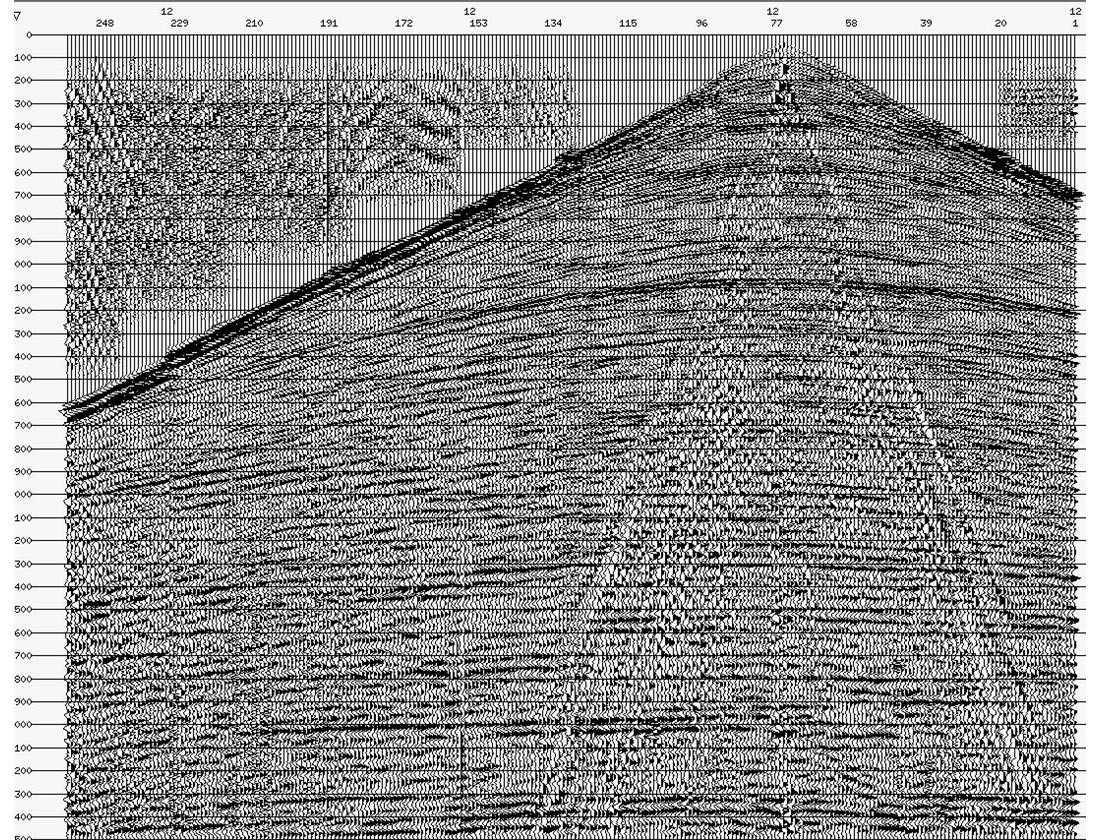
Azimuthal Velocity Anisotropy
In the next example (Figure 3) we show the impact of azimuthal velocity anisotropy on CDP gather data. If this type of effect is recognized and corrected, superior stacks and migrations are possible. Additionally, anisotropy attributes derived from this type of analysis yield a wealth of new information from P-wave data.
Another of the key areas where we can take advantage of hardware technology growth, diverge from the routine and immediately apply new technology and new problem-solving approaches is by applying multicomponent (3C converted-wave) seismic to our imaging requirements. We would like to focus on this area as an example of where change can occur and what benefits can be expected.

Research into the value of multicomponent seismic methods can be traced to earthquake seismology experiments in the 1800’s, however it was not until the 1970’s that they were applied to exploration and not really until the 1990’s before seabed imaging of offshore gas-clouds rekindled interest and demonstrated value to the industry.
Industry acceptance of the multicomponent methods has historically been hampered by equipment availability and equipment design, which have engendered the commonly voiced mantra that the technique was “too expensive”. These concerns, today, are essentially eliminated through the availability of MEMS based 3C sensors and purpose-built recording systems. Other barriers to growth have been:
- lack of interpretation and analysis tools
- high cost/value perception
- poor data quality
- immaturity of data processing techniques and experience
An industry questionnaire gathered at the SEG Shear Wave Summer Workshop, 2000, in Boise, Idaho captured these very points. Interestingly, a similar questionnaire posed to the attendees at the recent EAGE-sponsored Multicomponent Research Workshop in Pau, France, demonstrated that some traction has been gained for multicomponent techniques. Specifically, there is more conviction in applications to the detection of shallow gas, lithology and density prediction, stress characterization, and a particular jump in confidence in reservoir monitoring. Key concerns remained the first and last bullets as listed above although a number of data processing companies have demonstrated great advances in these areas. New application categories have surfaced relating to obtaining better images from OBS P-wave data acquired with 4C sensors or resulting from better water-column multiple attenuation, and from wide azimuth data recording. The use of multicomponent data for improved P-wave imaging has a firm group of supporters onshore, in particular from the Canadian heavy oil producers. It remains clear that widespread acceptance of multicomponent methods is critically dependent on the continued demonstration of value from field projects and the development of experience and procedures for data processing and interpretation.

3D P-wave seismic acquisition routinely provides us with faithful structural images but often lacks the ability to deliver complete and distinct information about rock properties. The combining of shear (S-) wave data with P-wave data can provide the extra information to reduce risk and create new opportunities ( Figure 4). There is a real need in oil and gas exploration and development to go beyond the structural imaging that P-wave can generally accomplish, to understand issues such as pore fluids and their movement, rock types, porosity, permeability, stratigraphy and fracture geometry and intensity. P- and S-waves behave differently in fluid and solid combinations in the subsurface and the joint use of these wave types provides more complete information than either individually can provide. Combined interpretation of both P- and S-wave reflectivity offers the ability to discriminate lithology, estimate porosity and characterize fractures and possibly fluid content. Using both P-wave and S-wave data invariably reduces economic risk by providing the explorationist with more complete subsurface information, even if only corroborative, resulting in better well placement earlier in the cycle and fewer wells being drilled, providing greater reserves per well, all leading to better overall project economics.
Supporting Examples
The following example (Figures 5 and 6) is from the Anadarko Basin in Oklahoma, a major gas production province with mature fields and on going exploration efforts. In the survey area, thin sands (less than 8m each) produce natural gas from the Mississippian Springer Formation (approximately 70m thick), at depths near 3.2km. Production is primarily related to porosity development. Wells with 8-12% porosity are generally commercial. An embedded, static 3C patch was recorded concurrently within a P-wave survey. The source was 5lb dynamite at 20m depth.
PP and PS Data Comparison (3C sensors)
Figure 5 shows the P-wave (PP) data and converted-wave data (PS). The PS data is presented in PP time. Differing reflectivity indicates additional information is available when using both wave modes for interpretation. On examining the Springer reservoir level, changes in both P-wave (PP) and converted-wave (PS) reflectivity associated with gas production were observed. A linear regression waveform classifier was used to quantitatively determine if using the PP and PS data together could provide a better empirical estimate of gas production than using PP data only. For 17 wells in the 3C3D image area with Springer penetrations and tests, a simple log trace was created representing cumulative gas produced. Using cumulative gas as the target, a neural network was trained and an estimate of gas production using the seismic data was derived.
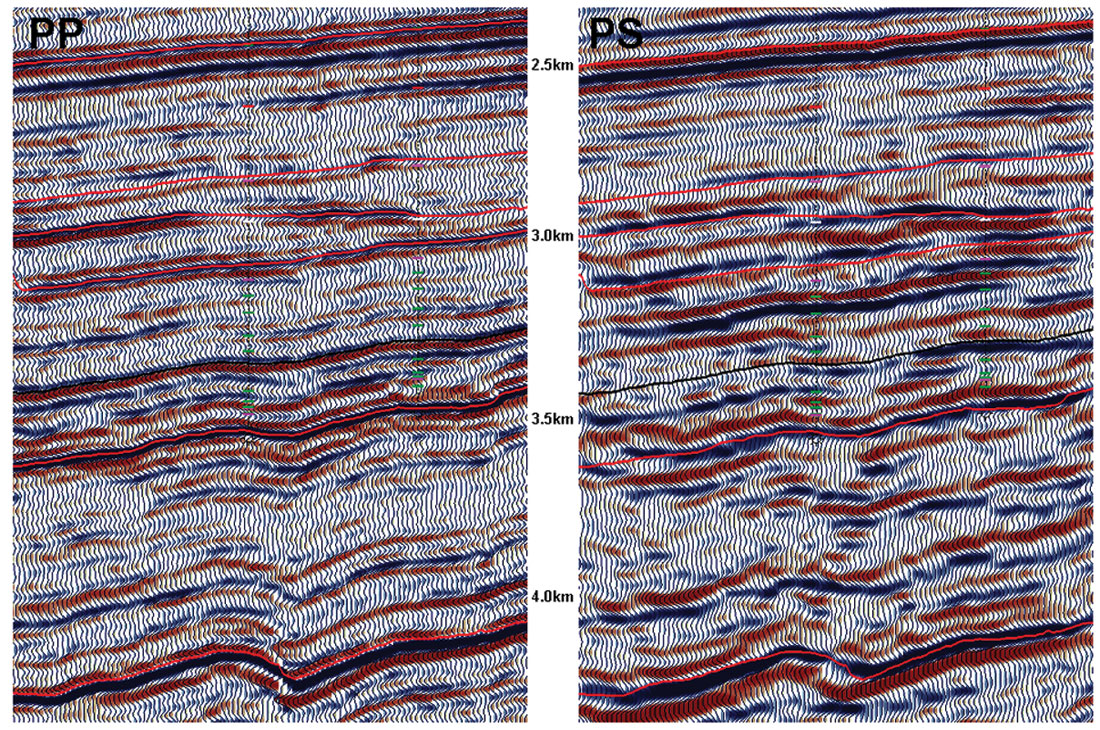
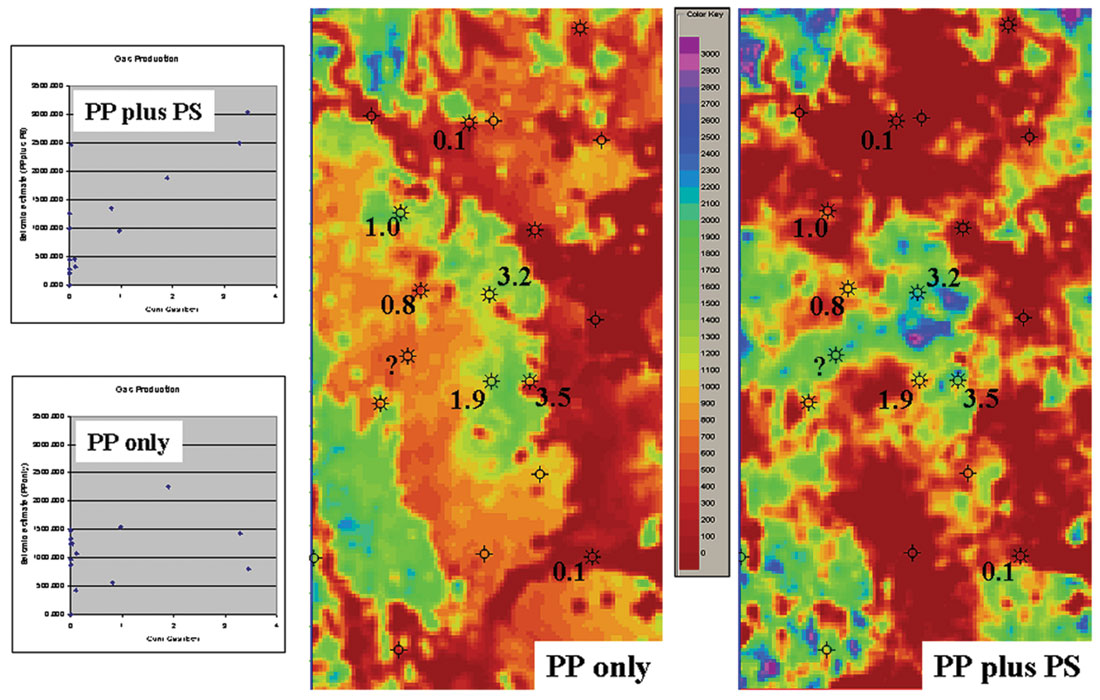
Figure 6 shows the empirical results for predicting cumulative gas production. Results using both PP and PS data correctly identified the three wells with higher cumulative gas produced. Cross-plots of estimated gas versus actual gas production show that using PP and PS data together produced a more accurate linear fit than when using the conventional P-wave data alone.
Predicted Gas Production based on seismic data attributes
3C data have additionally found a following for P-wave image improvement. Historically, large arrays of P-wave geophones have been used in 2D receiver lines to filter troublesome ground roll. In 3D acquisition, fewer geophones are employed for logistical reasons, resulting in shorter effective arrays. Surface-wave attenuation relies principally on processing solutions. In both 2D and 3D scenarios, removal of the surface wave “noise” can produce an attendant reduction in image resolution because of the high-cut filtering effect of the array and the noise-removal processing. By recording the full 3-D particle motion using 3C MEMS sensors, polarization filters can be applied to attenuate the ground roll and other surface waves without placing any demand on costly increases in spatial resolution because these techniques are single station operations. Polarization filters rely on the uniquely characteristic elliptical motion of the ground as the surface waves pass by. By measuring this motion with three-components it is possible to identify the signal caused by the surface waves and, once identified, remove it with minimal impact on the underlying reflection data. (Figures 7 & 8). Polarization filters can be used to improve both the P-wave and S-wave data.
Polarization Filtering Example
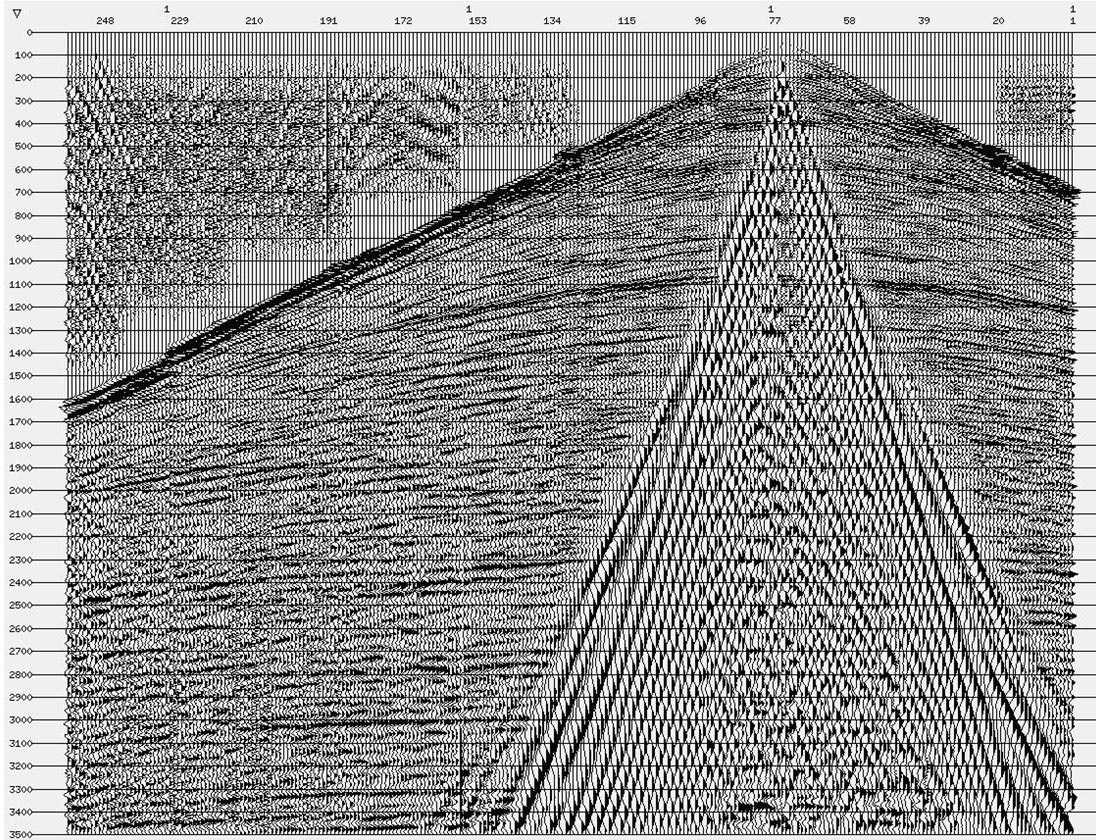
Figure 9 shows improved P-wave data quality from single-sensor 3C MEMS seismic data compared to geophone arrays. Two 2D seismic profiles are shown. Section A is recorded using conventional geophone sensors deployed as 6 element linear arrays over 20m. Section B utilized a single 3C MEMS sensor centered on the geophone arrays. These 2D profiles traverse a steeply dipping thrust. The faults and steeply dipping base of the thrust are better imaged using the single-sensor 3C MEMS sensors.
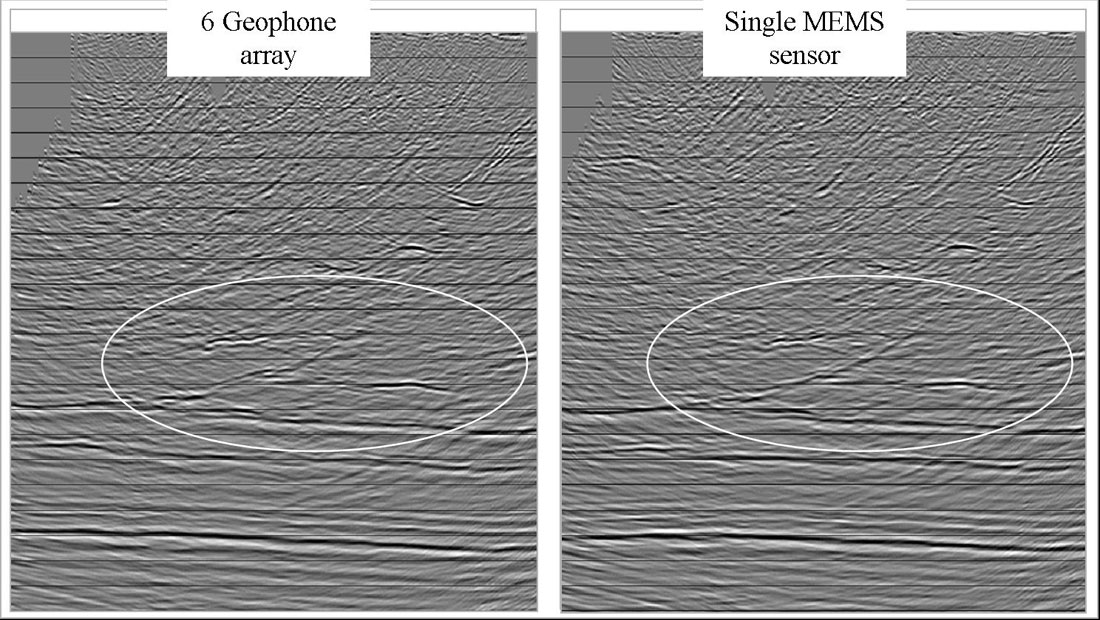
Canadian Foothills – P-wave example
Multicomponent techniques provide an array of potential applications to solve specific problems ranging from corroborating P-wave results to providing solutions where P-wave data alone are inadequate. New information available from these techniques can provide critical detail to form a better understanding and more effective exploitation of oil and gas reservoirs. We expect that the acceptance and use of multicomponent technology will continue to grow as new tools and products are developed and as our experience levels and comfort factors increase. Englemark writes: “The ability of multicomponent data to provide unique or improved solutions to virtually all imaging and characterization problems makes it the seismic tool of choice for the future”. Truly, this could be a wind of change.
The authors would like to express their thanks to John Gibson, Steve Roche and Rob Kendall of Veritas DGC and to Tagir Galikeev, Edward Jenner and Marty Williams from Input/Output, for their help in writing this article.


Join the Conversation
Interested in starting, or contributing to a conversation about an article or issue of the RECORDER? Join our CSEG LinkedIn Group.
Share This Article