This column, coordinated by the VIG Committee, is oriented towards the demonstration, promotion, or encouragement of the value of integrated geophysics. This may include short technical notes, business cases, workflow examples, or even essays. The format of the column is purposefully open, relaxed, and flexible to allow a wide variety of discussion without unnecessary burden. The column will generally be written by persons on the VIG committees, however, all members of the CSEG are invited to submit a short value oriented article to the VIG committee through committee chair George Fairs (GFairs@Divestco.com). Additionally, the VIG committee invites your letters. If you have a story, question, or comment about the value of geophysics, please send it on to George Fairs. We hope that the letters and columns that we publish are unique and different: tied together only by an interest in encouraging the value in our science and profession.
An Example of Measureable Value from a 3D Seismic Survey
The objective of this column is to show that applying quantative methods of geophysics, does add direct value to projects, especially in the application of full cycle economics, in the exploitation and production of oil and gas within the Western Canada Sedimentary Basin (WCSB).
“Geophysics is the study of the earth’s physical properties and of the physical processes acting upon, above, and within the earth”. It includes seismology, geomagnetism, gravity, radar and other electrical methods.
This is a very broad definition but we can say that Geophysics is applied through many quantitative methods and processes in exploiting the resources of the Western Canada Sedimentary Basin. My bias, based on over 30 years of working in the geophysical side of the industry, is that true value is gained by integration of all aspects of the industry including economics environment, geology, engineering and of course geophysics.
Where is the value in applying geophysics?
Value is not just economics: it is the usefulness in all elements of the decision making processes. It is the way that it can assist in making better and more rewarding judgements. Hunt (2013) illustrated the connections between uncertainty, variation, and geophysical information in decision analysis and their impact on economics. Geophysical value may also take on other forms. There can be great value on the environmental side when we consider how the exploitation affects the environment by the ongoing operations used in extracting the resource including the number of surface disturbances. Minimising the number of surface disturbances and the time to extract the resources increases value to the project (time is money). Geophysics can also be used to increase land use efficiencies, and sometimes to help avoid operational and environmental catastrophe. Consider the catastrophic Jocelyn Creek SAGD steam release in Alberta in 2006 that had a devastating impact on the surface and environment. This release was caused by shear failure of the cap-rock of the zone being produced and treated. Wikel et al (2012) showed that it is possible to use time-lapse multicomponent seismic data to monitor cap rock integrity and inform the business leaders of the probability of such a devastating failure. Wikel et al’s work is an example of a geophysical diligence. In situations such as this, seismic may be an element of the necessary diligence procedure that good business people follow, and have a preferential value.
PRACTICAL EXAMPLE: heavy oil in east central Alberta
A practical example of how 3D seismic has assisted in increasing value is that of a heavy oil prospect in the East Central area of Alberta. In this area heavy oil prospects are dominantly sand deposits and are fluvial in nature. Typically the geometry and target can be described as:
- Areal extent is between 200 and 2000 hectares
- Vertical thickness of the reservoirs can be up to 30 metres
- Depth of target is approximately between 400m to 1000m.
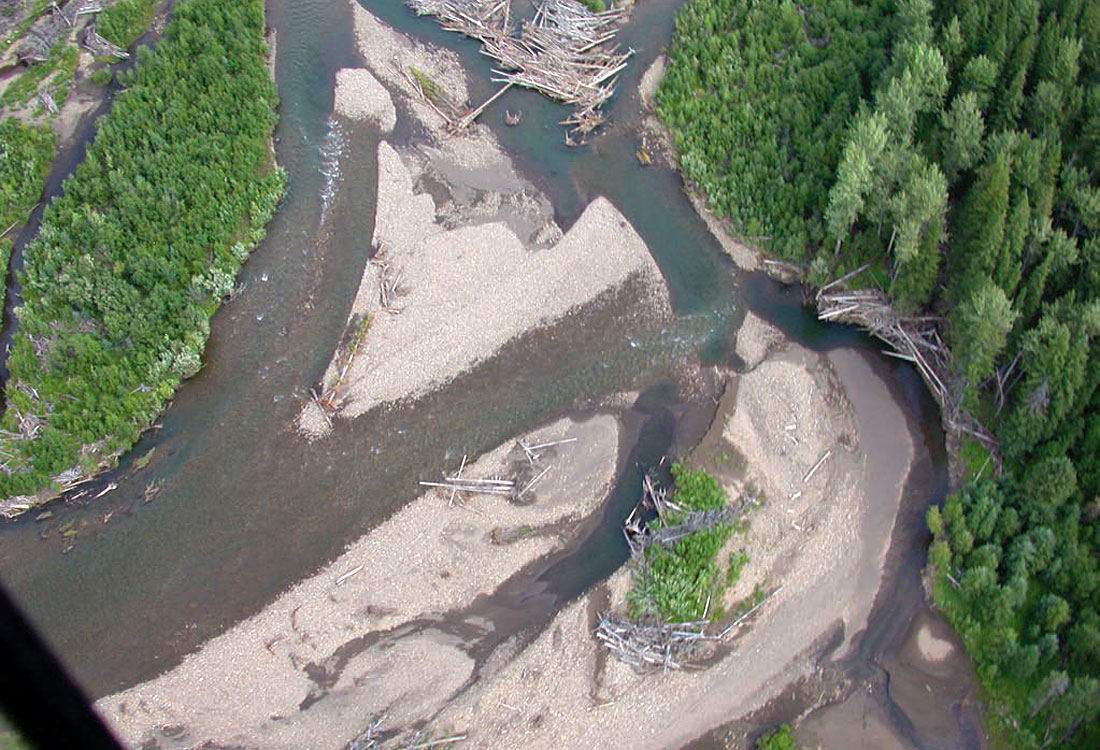
Channel morphology is important to the mapping of fluvial systems, so let us employ the principal of uniformitarianism and first look at the geometry of a recent fluvial deposit. An example is shown in Figure 1. In the picture we can see that the sands are deposited in a series of complex geometries.
The picture depicts a fluvial deposit that is representative of many Mannville age heavy oil pools in the WCSB.
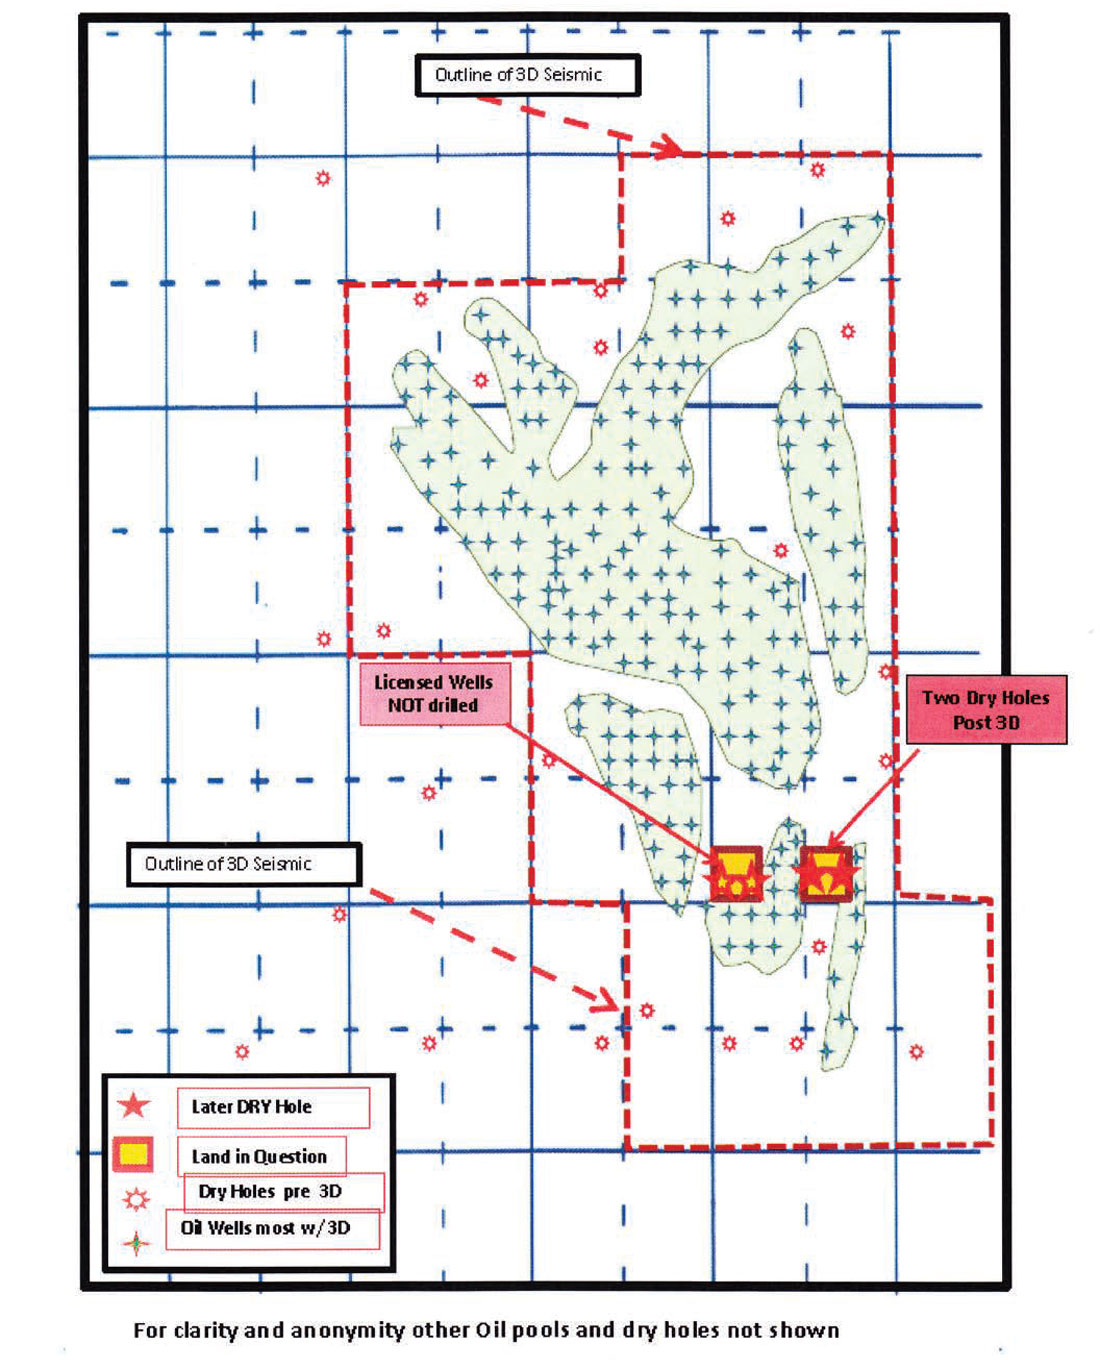
The project area is greater than 10 sections. The reservoir is up to 30m thick with log estimated porosities of up to 30% and at a depth to target of 750 m to 800 m. After the initial discovery of oil, a proprietary 3D seismic dataset of about 2400 ha in size was acquired to determine the areal extent and geometry of the exploitable resource. Figure 2 illustrates the 3D area and the potential resource area. Some 200 successful wells, mostly deviated from pads, were drilled and brought on production over the life of the project. General spacing was approximately 200m intra well.
The operator eventually decided to relinquish a number of Legal Sub Divisions (LSD) back to the crown. This action was taken because the integrated seismic interpretation was that they contained no reservoir. Returning valueless land created a reduction in the ongoing operating lease cost. I have only shown two key LSD’s that were returned, for the sake of clarity. These LSD’s are highlighted in orange in Figure 2, and were interpreted from the integrated seismic as having shale rather than sand.
The two LSD’s were subsequently posted by another operator at a Crown lease sale. The new operator did not own the 3D seismic, which was proprietary to the original company. At the subsequent land sale a sum of $100,000 was paid for the mineral rights of two LSD’s. This works out at $3125/ha ($1250/acre). Within a month of the land sale, four wells were licensed to drill on these lands. Two wells were subsequently drilled, both of which encountered shale rather than reservoir sand. Unsurprisingly, these wells have never been put on production. The other two licensed wells were never drilled.
This outcome strongly implies that the interpretation of the original operators was correct in that the lands held no value. The original operator had and used the seismic data in Figure 2. It is therefore assumed that the interpretation of the company who subsequently purchased the reposted land was different than the original operator. The only major difference in information between the two companies was the seismic data. I induce that the difference in interpretation was due to the fact that the new operator did not have seismic data over these lands to assist in their evaluation. The new operator only had well logs and the engineering (production) data, and they incorrectly concluded that economic resources lay under these two relinquished LSD’s.
So an estimate of the cost of the outcome is as follows.
Cost of drilling (without seismic)
Land lease cost $100,000, cost to drill two dry wells $700,000 (10 days drilling), professional costs $50,000 which includes the Geologist Engineers and Land person’s cost, for a total expenditure of approximately $850,000.
Cost of seismic (this directed the first company not to drill)
At the time of drilling all-in seismic costs were approximately $50,000 / km2. This includes all costs such as mob, demob, acquisition, processing and professional consulting including interpretation. It is estimated that to evaluate this prospect a minimum of 6 km2 of data would have been required for evaluation.
So a total cost including interpretation was estimated to be: $350,000.
Cost savings argument
For a cost of $350,000, the seismic saved the first company from drilling two non economic wells. The second company did not buy seismic, saving them $350,000 and costing them $850,000 in land, time, and dry wells. If we consider this from the original company’s perspective, the land costs would not be included. This means that the seismic saved the original company $700,000 (the drill costs) and potentially could have saved the second company as much as $500,000 ($850,000 which they spent less the $350,000 for the seismic they needed to acquire).
Summary
In summary I would like to say that we should approach the exploitation of our hydrocarbon resources with a full holistic approach. Consider the quality of the acquisition parameters, the processing methods and the integration of all other pertinent data before we make the economic decision. Value is more than reducing capital, consulting, and labour costs: we have to think in terms of how better we can fully exploit a dwindling resource. Consideration of all aspects on the effect on society must be taken, as this in itself adds value.
The example illustrated in this column illustrated a clear economic advantage from the use of 3D seismic.
3D seismic adds value.
References
Hunt, L., 2013, Estimating the value of Geophysics: decision analysis: CSEG RECORDER, 38, 5, 40-47.
Wikel, K., Kendall, R., Bale, R., Grossman, J., DeMeersman, K., 2012, 4D-3C Geomechanical Study of In-Situ Bitumen Recovery Utilizing Toe to Heel Air Injection (THAI), Alberta, Canada, EAGE First Break, 30, 43-53.


Share This Column